Harmonic Analysis
NZDUSD H1. Bullish crab. After the massive drop, the price reached monthly support that is within PRZ created by crab pattern. It may be a sign of reversing.
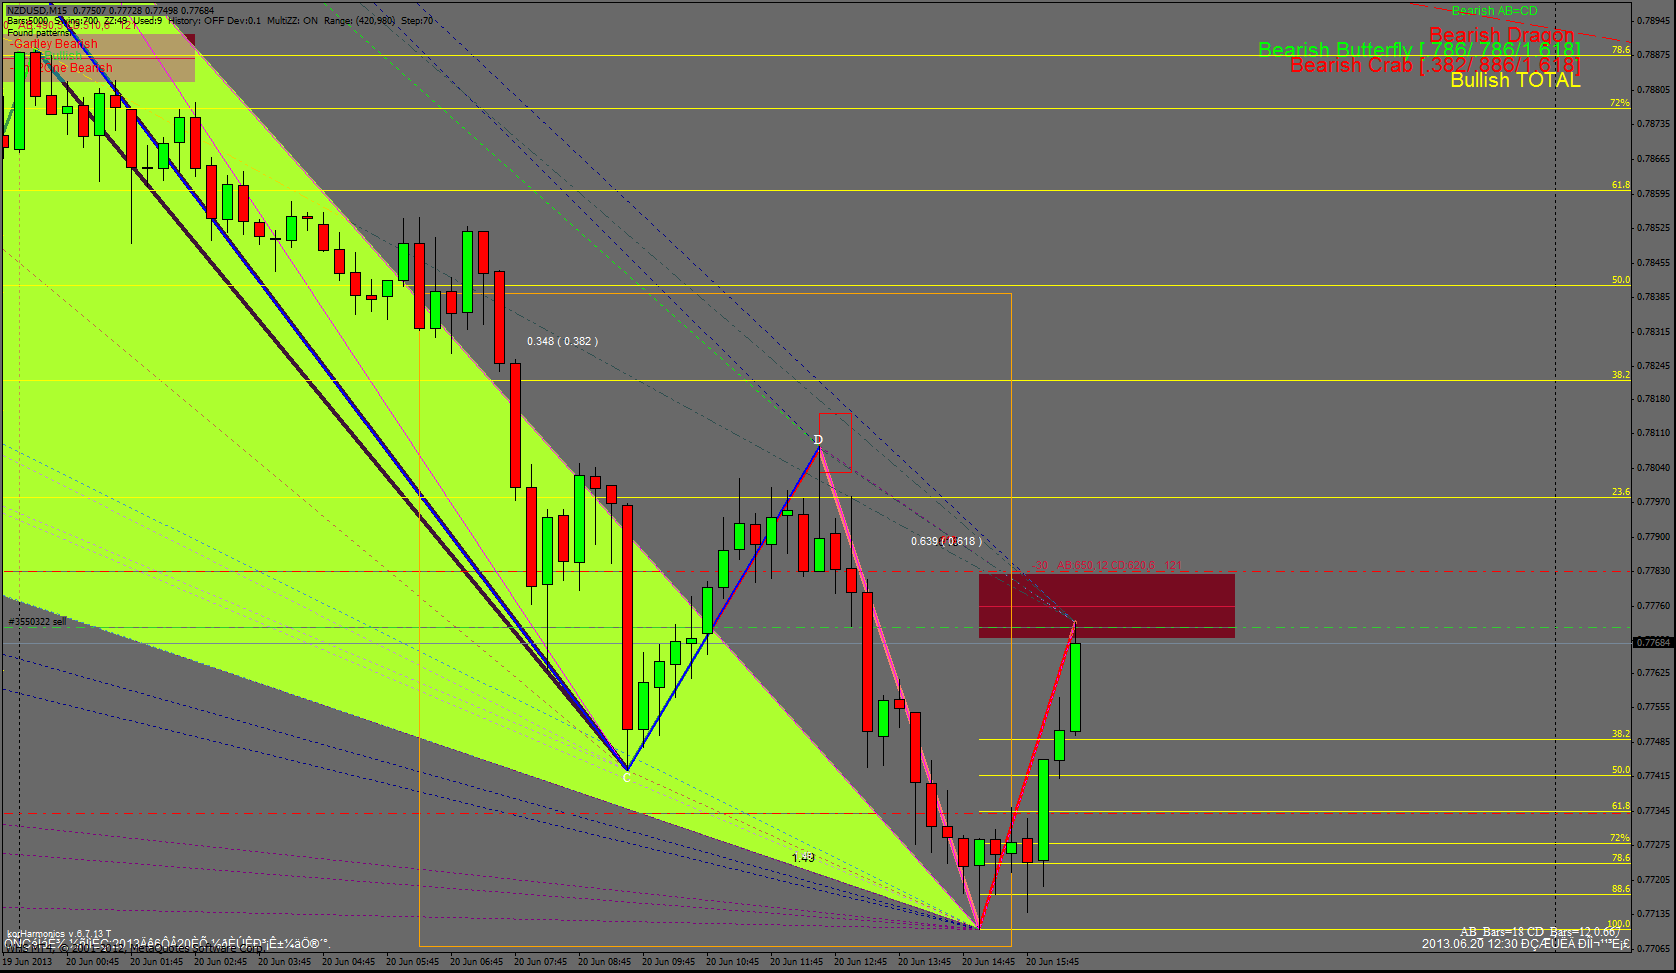
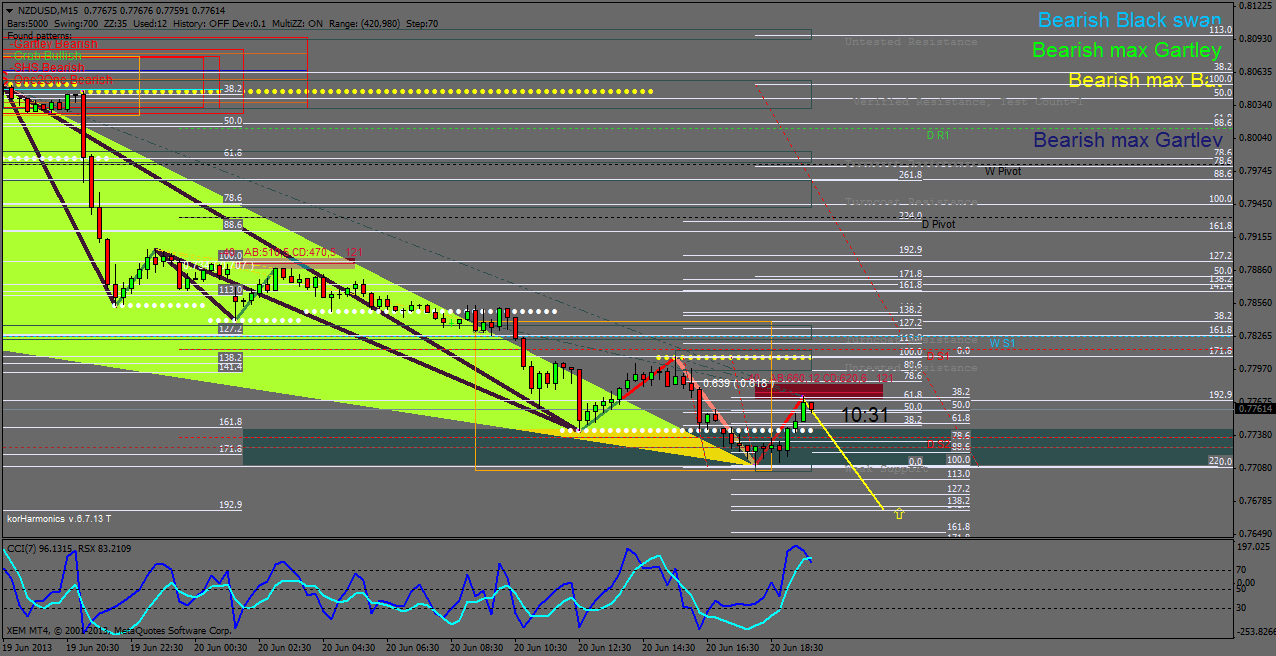
NZD/USD M15 one2one Bearish
0.618 of the last down swing, Scalping then
NZD/USD M15 one2one Bearish 0.618 of the last down swing, Scalping then
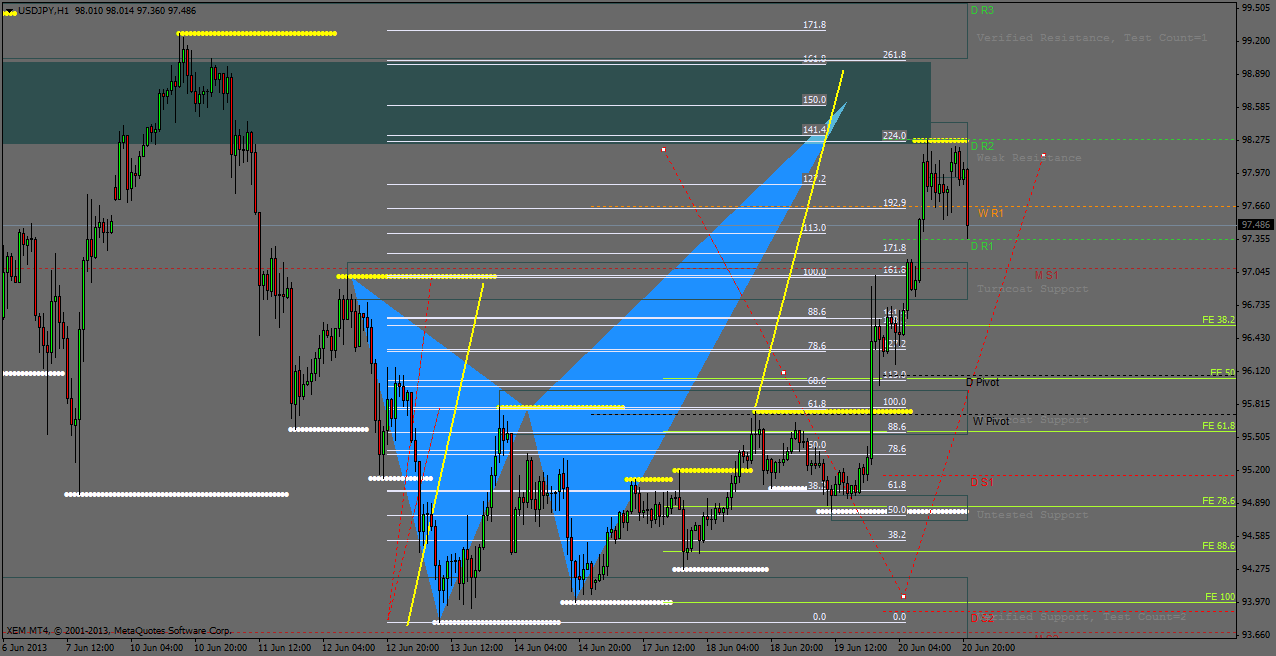
Then this might happen. Bullish ABCD. Sorry for my messy chart.
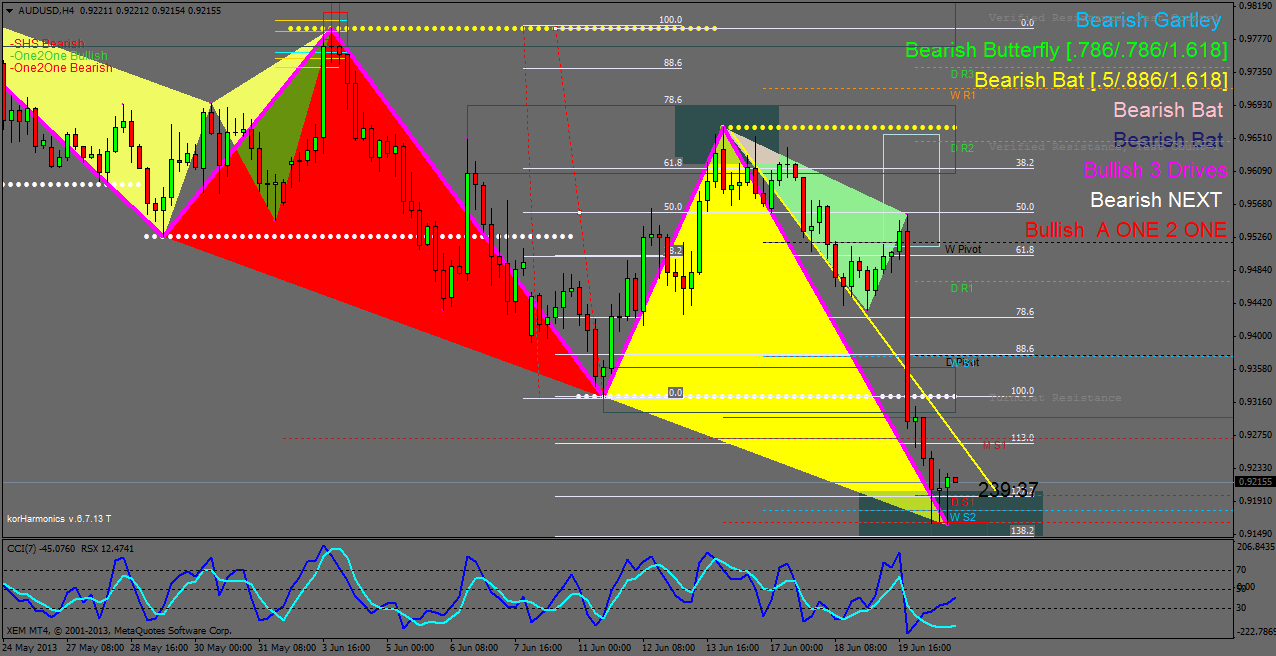
AUDUSD H4. Bullish 121, three drives and ABCD. The price touching second weekly support. The price dropped like crazy so further down moment may occur. Or else harmonics and ratios will beat it.
in your first picture, are you drawing the cyan shaded triangle(bcd leg in this case) yourself or do you have an indicator that draws emerging patterns for you? if so, which indicator is that?
thanks in advance.
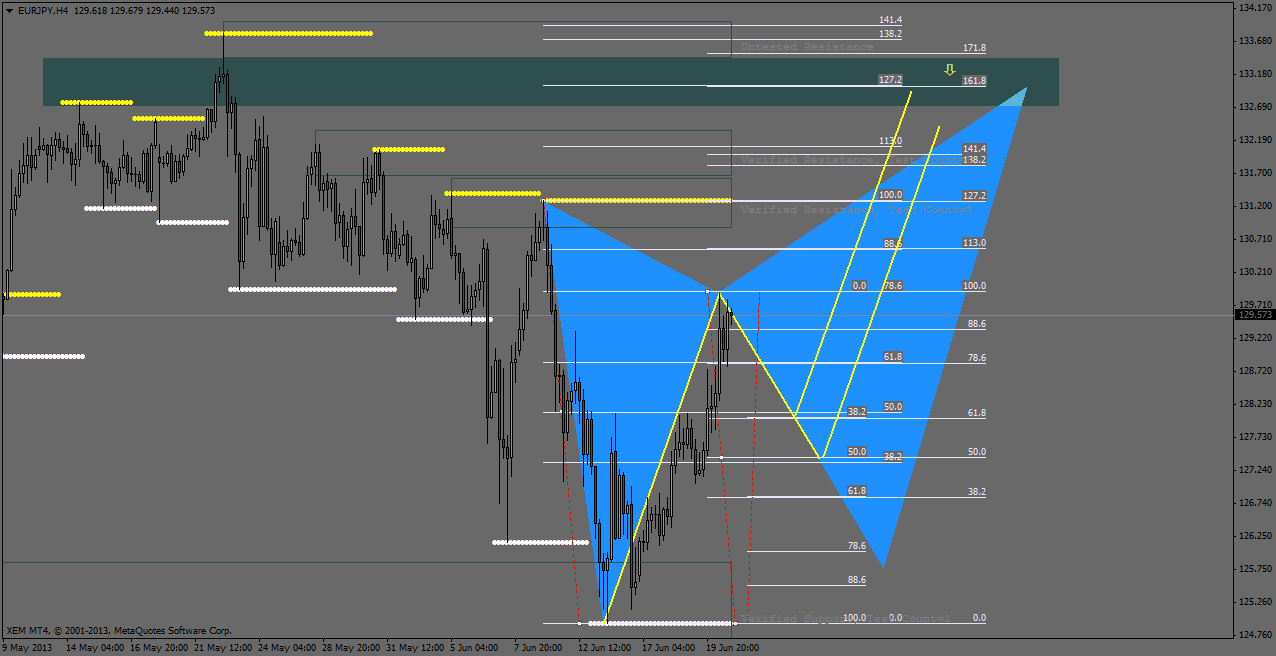
EURJPY H4. Possible bearish butterfly and 38.2 and 50 AB=CD might happen.
when adding zup indi's to your template, how do you make it so that zigzag lines with ratios do not appear on chart?
when adding zup indi's to your template, how do you make it so that zigzag lines with ratios do not appear on chart?
ExtStyleZZ=false.
- Free trading apps
- Over 8,000 signals for copying
- Economic news for exploring financial markets
You agree to website policy and terms of use
Hello traders,
This thread is dedicated to harmonic trading and price action/structure trading.
The thread has become a one-man show for a while. I thought I would shut the thread down but I decided to contribute more.
I'm not a professional trader and I will never be and I never want to be. Because you don't have to be professional to be a trader.
Anyhow, I hope you can learn something from my contribution.
For ZUP and harmonic indicators, settings, coding and programming click here https://www.mql5.com/en/forum/173588.