Harmonic Analysis - page 261
You are missing trading opportunities:
- Free trading apps
- Over 8,000 signals for copying
- Economic news for exploring financial markets
Registration
Log in
You agree to website policy and terms of use
If you do not have an account, please register
Whose channel and any rule to draw those (i.e. low-high or Low to Low or sthg?) I would love to see the bull here for the pension plan
What do you mean by whose channel? It's equidistant channel from MT4. It's not generated by any indicator. And as I told you, there's no rule to draw. I don't keep it unless it sits at support and resistance I find. You don't see a lot of potential on lower time frames that you usually pay attention to?
EURUSD 4H - Potential bearish cypher.
Irad, is your idea of drilling down to H1 and minimize the risk? When you look at the PRZ in this case could have been done. Or what do you think?
no, that's not how I define stoploss,
and I don't drill down timeframes or anything like alfonso,
I use Price Action for entries on S&D area, and targeting opposing S&D areas, if I see some S/R on it's way I'll get alert and watch for PA(Price Action) for my stop(manual close).
EURUSD 4H - Potential bearish cypher.
look Ryu,
as I said yesterday, our entries are almost alike,
your possible entry for this EU is my final target and my possible entry point(I'll look for PA to short).
GU 4H @ supply zone, also gartley pattern that harmonic traders probably already in the trade.
H1 showed bearish engulfing candle
1st target around 1.66
2nd target around 1.65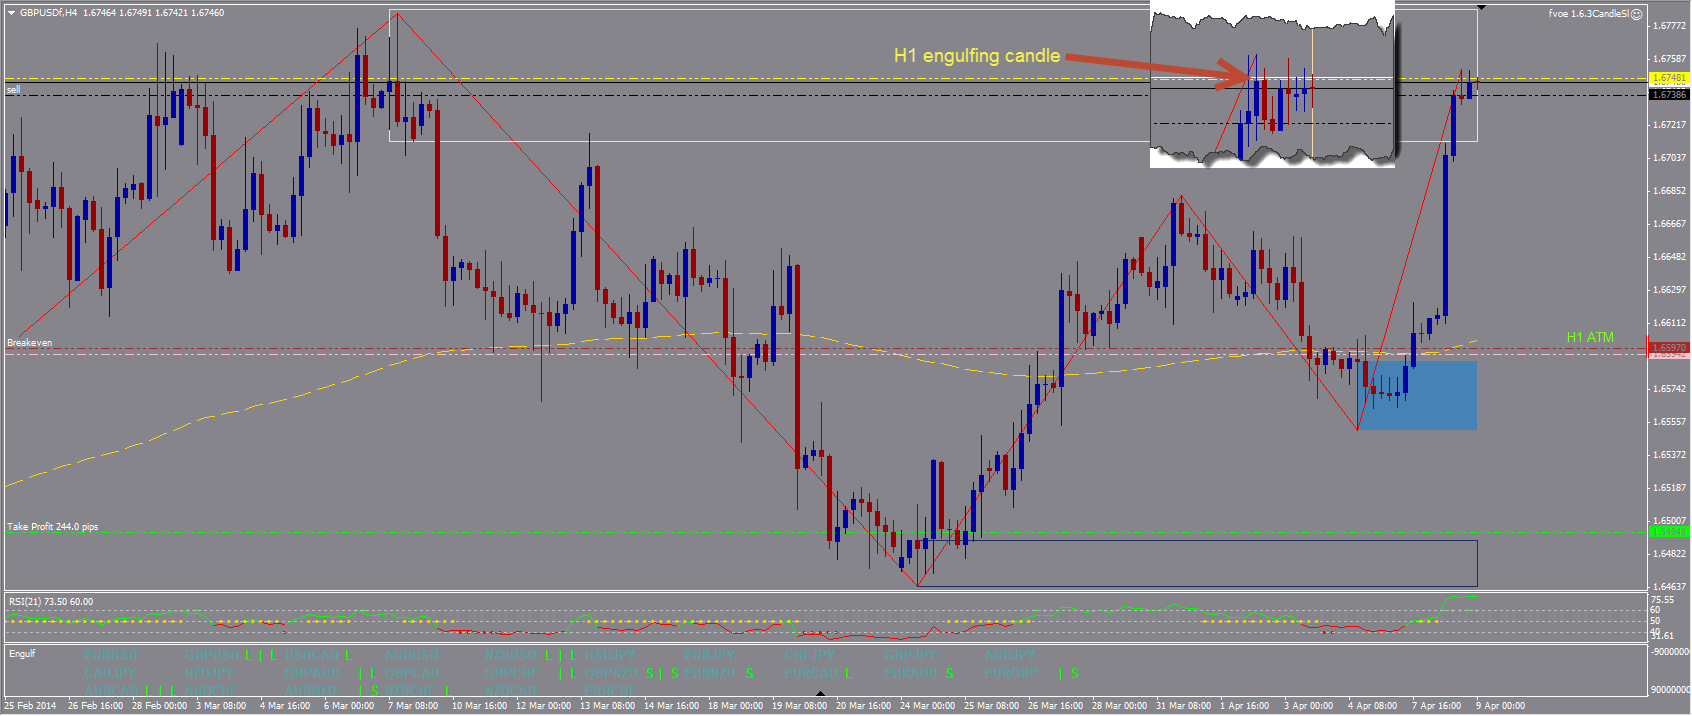
GU 4H @ supply zone, also gartley pattern that harmonic traders probably already in the trade.
H1 showed bearish engulfing candle
1st target around 1.66
2nd target around 1.65Congrats, looks like a very nicely nested area from HTF as well!
(zones- red: MN, Violet: W, Pale: D1)
Chart GBPUSD, D1, 2014.04.08 23:33 UTC, HF Markets Ltd, MetaTrader 4, Demo - MetaTrader Trading Platform Screenshots
and there is some "bread and butter" ABCD opportunity for HP lovers as well.
Chart GBPUSD, H1, 2014.04.08 23:35 UTC, HF Markets Ltd,
MetaTrader 4, Demo - MetaTrader Trading Platform Screenshots
Looks like a very good opportunity for shorting again.
Thanks for sharing this nice case and your views on it!
Question - do you enter in one whole position at or below the lower edge of the supply zone, or do you take partial entries beginning from that and progressing into the zone?
BTW plz do not be shy to correct my zones, I just see some places "suspecious" for how I drew those...
Could you please share what we see in the enlarged area of the engulfing with the waves on top and bottom (Charlie Chaplin style, i.e. black and white waves)?
Also on the bottom of chart the indi signaling engulfing? or what that is...
Manual dwg.. misplaced B point in the process...sorry..indi would not do that.
Tnx for being so attentive and correcting!
Now that I corrected my problem, created an other one: gartley minimum requirement is not filled (AB=CD or CD leg = AB leg of Gartley)
So your question might be still valid?
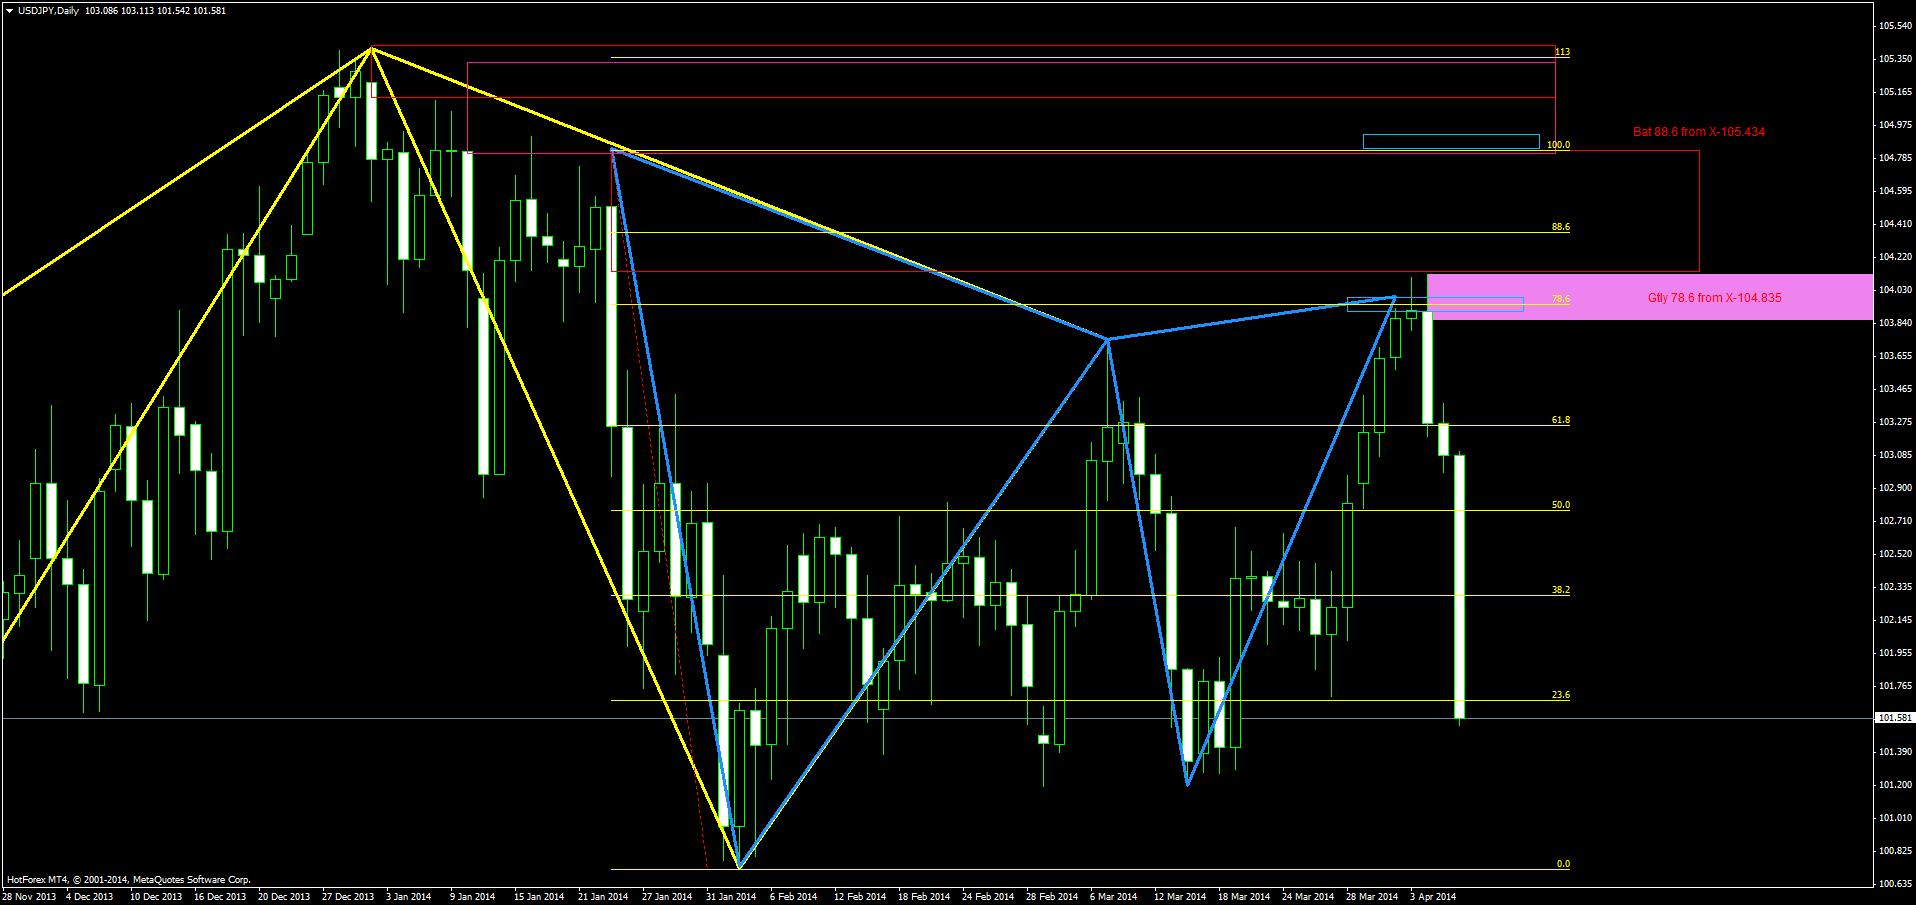
Chart USDJPY, D1, 2014.04.08 18:43 UTC, HF Markets Ltd, MetaTrader 4, Demo - MetaTrader Trading Platform ScreenshotsIs your question valid? I could go to pattern calculator to verify that, or alternatively could draw a lot of fibs over the pattern to verify internal confluences, but interested in your view RyuShin, since I have really seen a lot of gartleys like this working out nicely...so what is your or anybody elses experience with it?
Anyways, I have not drwn the demand levels here...based on those it is time to look for a long soon, I think.
Although we showed you back on TF D1 bear a bat, I'm noting on TF1H a bull bat that could make us earn 35-40 pips upward!
Gbp-$-1.6811
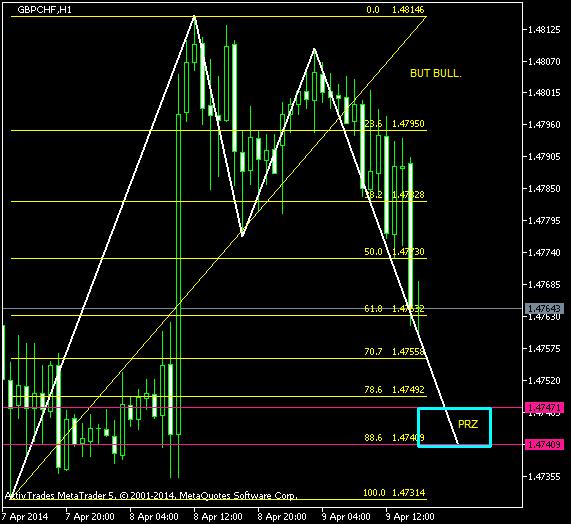
Although we showed you back on TF D1 bear a bat, I'm noting on TF1H a bull bat that could make us earn 35-40 pips upward!Hit with millimetric precision the PRZ, and immediate rebound