Harmonic Analysis - page 268
You are missing trading opportunities:
- Free trading apps
- Over 8,000 signals for copying
- Economic news for exploring financial markets
Registration
Log in
You agree to website policy and terms of use
If you do not have an account, please register
This is what I see, not very clear though, since HTF above M15 are suggesting to wait for longs.
Chart XAUUSD, M15, 2014.04.12 23:37 UTC, HF Markets Ltd, MetaTrader 4, Demo - MetaTrader Trading Platform Screenshots
Just a simple check for D1 current trend and HTF longer term, looks like D1 and below it is supposed to work on the bear side, longer term it is fighting slowly up..
But these are all lagging indicators, these cannot beat our eyes, right?
Chart XAUUSD, D1, 2014.04.13 00:35 UTC, HF Markets Ltd, MetaTrader 4, Demo - MetaTrader Trading Platform Screenshots
Warning:
______________________________
Do not listen or trade based on what I say, even what I see!! Trade only based on what you want to..it is your risk! The glory and blame are both ONLY yours! NEVER PLACE A TRADE WITHOUT AT LEAST A SAFETY STOP LOSS!!!
gold in my idea for a dragon thanks for graph
"deep searching" historical datas vs could it be cypher ?
paulselvan, by fib numbers it is technically I cypher.
I went to lower TF to see it better.
Chart EURUSD, H4, 2014.04.13 13:54 UTC, HF Markets Ltd, MetaTrader 4, Demo - MetaTrader Trading Platform Screenshots
However how you draw it on your pic it a hair short from being a shark, and the way you picked the A point it far off from a cypher and a hair off from being a shark.
Is your C = 113-161.8 XA i.e. potential shark
Is your C = 127.2-141,4 XA i.e. potential cypher
So unless my measurements are not right, it is neither a shark, nor a cypher in my opinion as it is drawn here:
Chart EURUSD, H4, 2014.04.13 14:12 UTC, HF Markets Ltd, MetaTrader 4, Demo - MetaTrader Trading Platform Screenshots
Any question or comment?
Warning:
_______________________
Do not believe me, measure yourself, analyze and act according your best knowledge.
Proverb:
_______________________
give a man a shark and you feed him for a day; teach a man to fish the sharks and you feed him for a lifetime
Not the best scenario, since it wants to go higher, but here it comes:
EurUsd in a monthly and weekly up trend running into the weekly and daily supply zone. Could be a counter trend short opportunity.
Two bearish shark options depending on where I draw the X, also and ABCD coming into a relatively tight place.
The D1 is in correction unless removes the D1 HH, no real TL can be drawn. H4 is in uptrend, so probably a 50% chance of having a retracement or trend turn, another 50% to break the zone and continue the HTF trend.
Right now I see a chance for a short though.
I wonder what other views there are.
Chart EURUSD, H4, 2014.04.10 15:49 UTC, HF Markets Ltd, MetaTrader 4, Demo - MetaTrader Trading Platform Screenshots
P.s.: all hand made (if that counts) and so human error not excluded.On EurUsd I pretty much still have this picture valid, other than now the bigger shark is questioned by being short of 113 by a few pips.
geonai, on higher time frame I am expecting this gartley emerging, but one never knows.
Chart EURUSD, W1, 2014.04.13 15:09 UTC, HF Markets Ltd, MetaTrader 4, Demo - MetaTrader Trading Platform Screenshots
The blue bat is possibly an option too, my concern with that is, where to take the X.
I do not know what others think about it. Any comments?
"deep searching" historical datas vs could it be cypher ?
Paul, if A is on that level, the pattern is not a cypher as lobo mentioned above.
What pattern is the orange one and what pattern is the pink one? The blue one is a gartley I believe.
If the blue graph is true, and this graph is correct.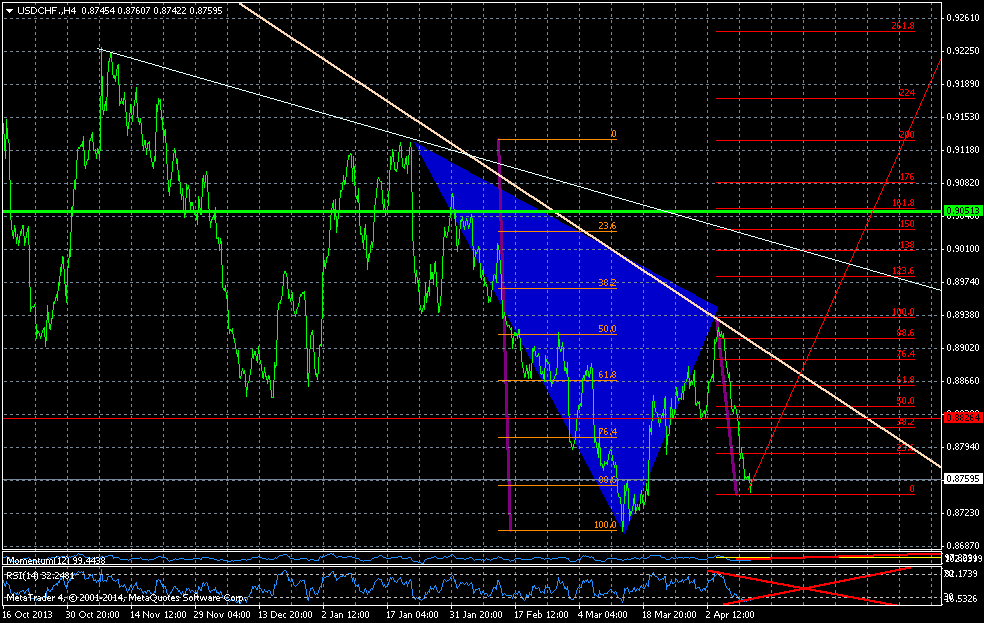 -THANK YOU LORD FOR COMMENTS
If the blue graph is true, and this graph is correct.
There's a bullish cypher on the pair.