Harmonic Analysis - page 313
You are missing trading opportunities:
- Free trading apps
- Over 8,000 signals for copying
- Economic news for exploring financial markets
Registration
Log in
You agree to website policy and terms of use
If you do not have an account, please register
GBPNZD - Potential bearish bat.
The area circled in green would be the PRZ, but with the red line I want to highlight an interesting convergence between 78.6 and 200BC@1.4428 XA@1.4428. This value could be ideal for a reverse. The only question that arises is to me that this is the 6th consecutive week that the price is stationed in that area.
do it -------------------
Poruchik,
Can you help please a little more with a robot or indicator setup to test this Dragon animal?
Here is a currency pair with 4 dragons we looked at with a trader friend of mine:
Chart NZDJPY, D1, 2014.07.21 21:19 UTC, FxPro Financial Services Ltd, MetaTrader 4, Demo - MetaTrader Trading Platform Screenshots
The ones above are from D1-H4-H1 time frames.
Here is one from smaller time frame from today:
Chart AUDUSD, M15, 2014.07.21 21:40 UTC, FxPro Financial Services Ltd, MetaTrader 4, Demo - MetaTrader Trading Platform Screenshots
Problem 1: indicator has no PRZ
Problem 2: last time you helped was opposing direction and I could not tell the robot to go opposit.
Please help testing it out with an indicator and robot working in the right direction.
Thank you and best regards,
Gábor
The area circled in green would be the PRZ, but with the red line I want to highlight an interesting convergence between 78.6 and 200BC@1.4428 XA@1.4428. This value could be ideal for a reverse. The only question that arises is to me that this is the 6th consecutive week that the price is stationed in that area.
Hi Dan50,
Here is my analysis on EURAUD. We have there a 3 Drives which is for me a strong signal + beatiful Fresh demand zone + Bat... I ll wait until my PRZ is reached before buying... It is happening very often that the price goes lower before turning after a consolidation of couple of days that we have now.... If you check it on the Daily chart you can see that we are standing now on a fresh demand zone... If this one is broken we could take our trade... If it rises from here I ll miss the trade but I don't care There are hundred of other trades to take... Just be patient, that's my advice...
Regards
GBPNZD - Potential bearish bat.
Hi Ryu,
Here my analysis on GBPNZD:
The level seems absolutly good... But otherwise that the Bat I yould find any other confirmation, No ABCD, No 3 Drives... The supply level there is fresh and seems strong... Could you please give me other confirmations that you use before taking any trade?
Thank you in advance
regards
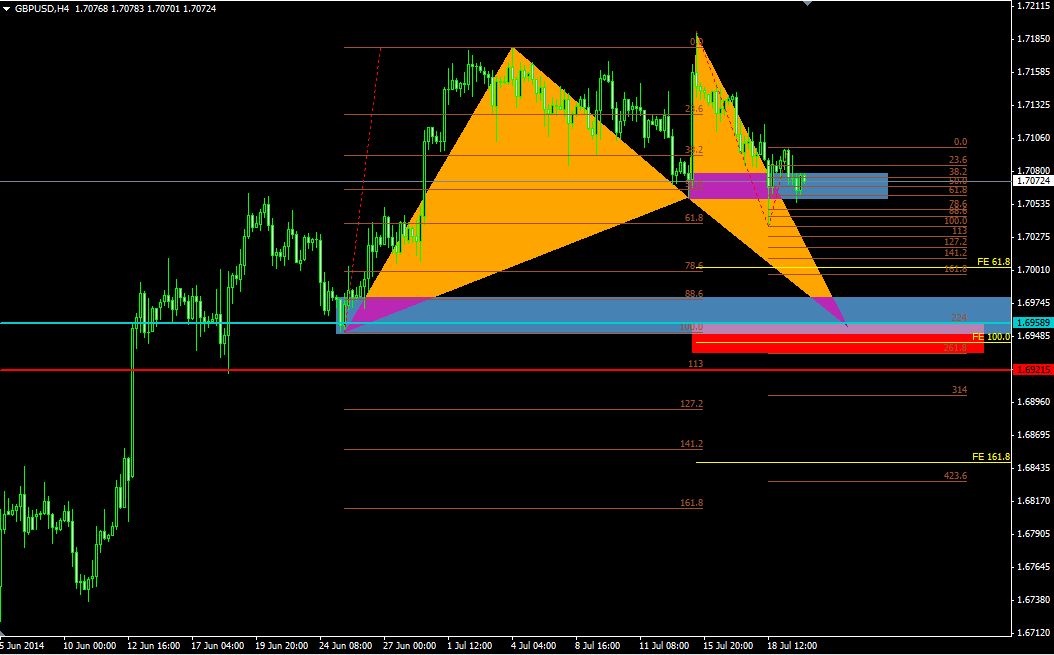
Hi all,
possible bullish bat on GBPUSD... we should have an AB=CD, PRZ btw 2.24 and 2.61 BC projection (Red Area). Beatiful Fresh Demand zone there. This is in my opinion a low risk trade with a good R:R.. Any comments are welcome.
Regards
The area circled in green would be the PRZ, but with the red line I want to highlight an interesting convergence between 78.6 and 200BC@1.4428 XA@1.4428. This value could be ideal for a reverse. The only question that arises is to me that this is the 6th consecutive week that the price is stationed in that area.
A bullish bat pattern complete in the PRZ.
Hi all,
possible bullish bat on GBPUSD... we should have an AB=CD, PRZ btw 2.24 and 2.61 BC projection (Red Area). Beatiful Fresh Demand zone there. This is in my opinion a low risk trade with a good R:R.. Any comments are welcome.
RegardsAbout GBPUSD, I do not see very clear the BAT bullish. I'll show you my CRAB BEAR where they are already short in expectation of profit.
Hi Ryu,
Here my analysis on GBPNZD:
The level seems absolutly good... But otherwise that the Bat I yould find any other confirmation, No ABCD, No 3 Drives... The supply level there is fresh and seems strong... Could you please give me other confirmations that you use before taking any trade?
Thank you in advance
regardsTo be honest I don't have any other confirmations. I'll just take it because ratio wise it is fine. What I concern is the candle in the circle. I mentioned this before in the thread but I'm going to talk about it again. The candle in the circle indicates me that the investors were under pressure within the price range in the doji candle. After the candle, there were more sellers than buyers which could've been more buyers than sellers. With that being said, when price reaches the level, investors might take time to think whether buying or selling. Of course price might just shoot up for some reason.
A bullish bat pattern complete in the PRZ.
The entrance on short EURAUD was my bad bet, despite being aware that it was more in the PRZ.