Harmonic Analysis - page 94
You are missing trading opportunities:
- Free trading apps
- Over 8,000 signals for copying
- Economic news for exploring financial markets
Registration
Log in
You agree to website policy and terms of use
If you do not have an account, please register
This nice looking fellow ended up as a loss
You could've entered short instead when the pair broke the trend line you drew. Trendline break strategy is apart from harmonic trading but I think it's good to know how to trade it so that you can get your losses back.
EURUSD H4 - Potential bearish FC gartley and bullish regular gartley afterwards.
On audusd H4 , bearish trend is broken...a double bottom maked...
RSI in symetrical triangle : nor buyers or sellers take control...
i hesitate : to be long now because double bottom has formed or wait more -200 pips till bull butterfly completed at very low ?..
You could've entered short instead when the pair broke the trend line you drew. Trendline break strategy is apart from harmonic trading but I think it's good to know how to trade it so that you can get your losses back.
Thanks, I do understand this, and definitely see it. Can you tell me any signg I could look before the trade about the failure - after the fact anlysis is OK, just to see what you would have considered and I did not?
On audusd H4 , bearish trend is broken...a double bottom maked...
RSI in symetrical triangle : nor buyers or sellers take control...
i hesitate : to be long now because double bottom has formed or wait more -200 pips till bull butterfly completed at very low ?..
I do not find your butterfly - probably my fault. I do find some higher TF buterrflies on a weekly, but those seem to be be larger and remote - one of those however at fib 127, which can be a candidate to fire bull..
So I do not think I can be a big help, though I have all bearish shapes forming up, plus if there is butterfly, you are looking at the natural S/R level on the B level probably. Also the thick yellow level on my pic, check it out for multipke S/R level in the past, I think it is.
Sorry for not being more helpful!
Now that I am staring at my posted enlarged pic, I see your butterfly (now it is ours lol ) - but still, I do not think I can add anything more than before.
On audusd H4 , bearish trend is broken...a double bottom maked...
RSI in symetrical triangle : nor buyers or sellers take control...
i hesitate : to be long now because double bottom has formed or wait more -200 pips till bull butterfly completed at very low ?..
paulselvan, please educate me. The audusd is a spot price definitely tied to the USD as half of the equation. The USD index is a Sep contract futures tied to a basket of currencies. How do you think it can be used? I`d like to believe it is a leading indicator showing future expectations ahead of the spot price, but really I need some education/explanation in this matter.
Or anybody else can give me a hint, link or guide?
Thanks a lot!
[attach=config]181903[/attach] project m30 with entry point, stop loss and take profit
Hi schemewalkers, any other new project you are about to start? Please share, if you have a good set-up!
Tnx a lot.
On audusd H4 , bearish trend is broken...a double bottom maked... RSI in symetrical triangle : nor buyers or sellers take control... i hesitate : to be long now because double bottom has formed or wait more -200 pips till bull butterfly completed at very low ?..
I found bullish N200. I don't know if it's going to complete but we'll see.
Thanks, I do understand this, and definitely see it. Can you tell me any signg I could look before the trade about the failure - after the fact anlysis is OK, just to see what you would have considered and I did not?
I'll keep it mind. If I have a different mindset, I'll share here. That's what the thread is all about.
paulselvan, please educate me. The audusd is a spot price definitely tied to the USD as half of the equation. The USD index is a Sep contract futures tied to a basket of currencies. How do you think it can be used? I`d like to believe it is a leading indicator showing future expectations ahead of the spot price, but really I need some education/explanation in this matter.
Or anybody else can give me a hint, link or guide?
Thanks a lot!hi lobogabor,
Im also a new bee in trading...im trading without any knowlegde in fondamental datas : pib,ipc,...and i was long away of the market reality when aftermath i read economists explications ...
..For example, i just learn yesterday that if PIB is in growth than stocks are bullish...and if PIB is in degrowth than bonds are bullish !...until today,i traded indices without this basic knowledge ...
...
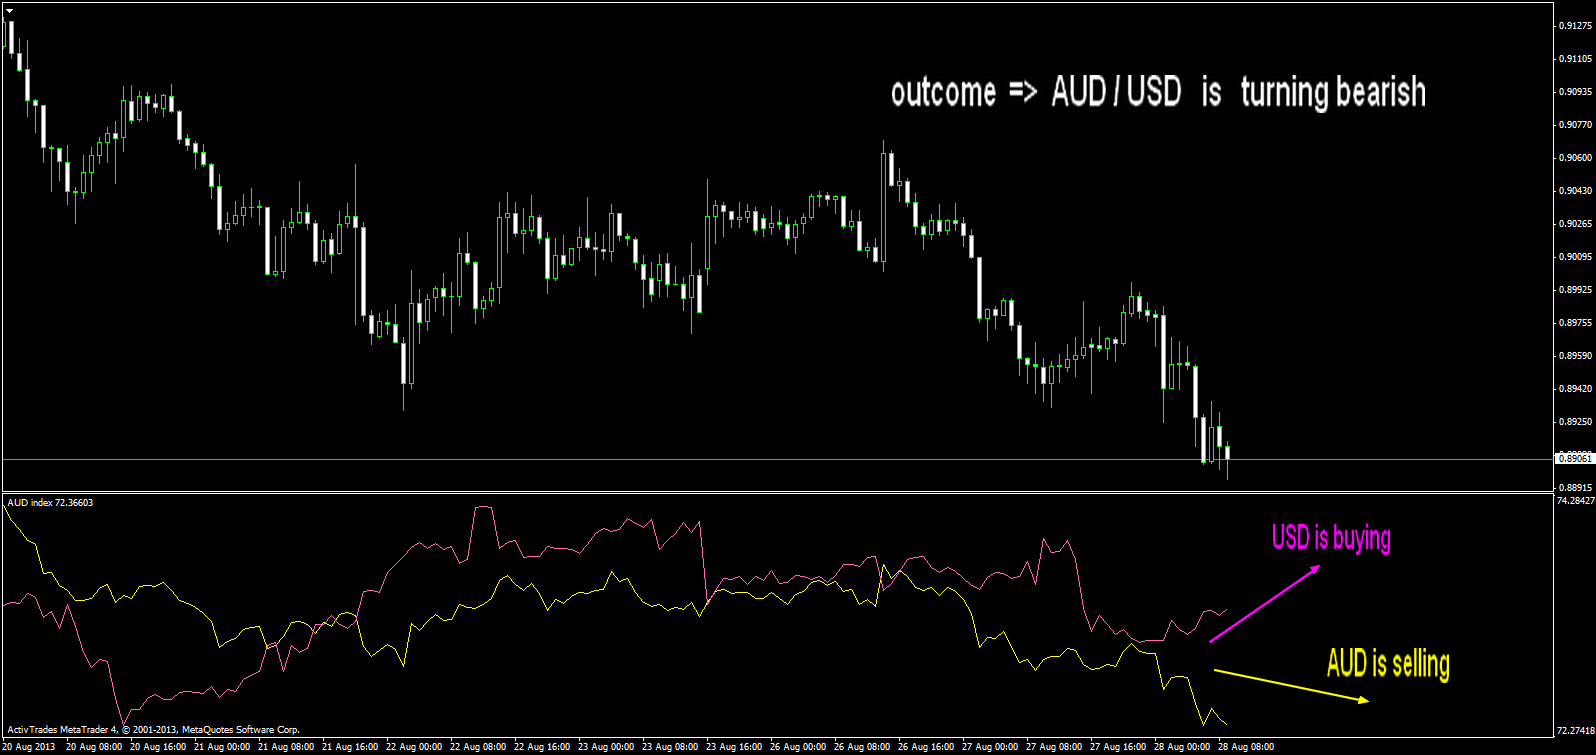
To come back on audusd ,usdindex...i'm using symboIX custom indiactor,that gives me instant information about if aus is selling/buying and usd is selling/buying in 2 separate curves...as you know, the eqaution is simple : eg,if aud is buying and usd is selling then the pair aususd is bullish.....