Harmonic Analysis - page 139
You are missing trading opportunities:
- Free trading apps
- Over 8,000 signals for copying
- Economic news for exploring financial markets
Registration
Log in
You agree to website policy and terms of use
If you do not have an account, please register
CHFJPY 4h - Potential bullish bat.
UsdJpy-D1-potential bull garley or bear butterfly
This potential bullish cypher could be C of the potential bearish butterfly.
EURUSD 1h - Potential bearish crab. After the gartley completion the pair came down to 50 fibo retracement of CD leg of the gartley. We can see there's former-resistance support around that 50 fibo retracement. Demark 9 popped up on 30m chart. With that being said, the pair may go up.
The crab worked out nicely. Now we have a potential bullish cypher.
Almost stopped out but the crab worked out. Hit target 1. I could have taken a bullish bat.
Maybe it is just my wishful thinking, but I do like to pick XA legs where there was a previous HP CD leg too - at least the previous pattern shows there was a real swing before.
Also when I have a combo like this, I usually get more confident about the outcome.
Maybe it is just my wishful thinking, but I do like to pick XA legs where there was a previous HP CD leg too - at least the previous pattern shows there was a real swing before.Also when I have a combo like this, I usually get more confident about the outcome.
Do you mean to take XA leg swing and determine targets? If not, please post a pic and expand on that.
The crab worked out nicely. Now we have a potential bullish cypher.
Potential bearish bat added.
CHFJPY 4h - Potential bullish bat.
Potential bullish ABCD as another option.
Do you mean to take XA leg swing and determine targets? If not, please post a pic and expand on that.
No, I meant like on your pics, the bat XA (pic2 blue) lining up with the previous HPs CD leg (red)
That is my prefered XA, however there might be smaller XA legs coming to a viable, even in many cases profitable HP.
Here is another one, not the best, I was just looking for one example quicly.
The green HP lines up with a previous HPs CD leg, this potential HP I see more potential, than the butterfly from a smaller XA (dark blue XAB line shape).. however in this case they line up relatively nicely.
I hope I could explain better now what I meant.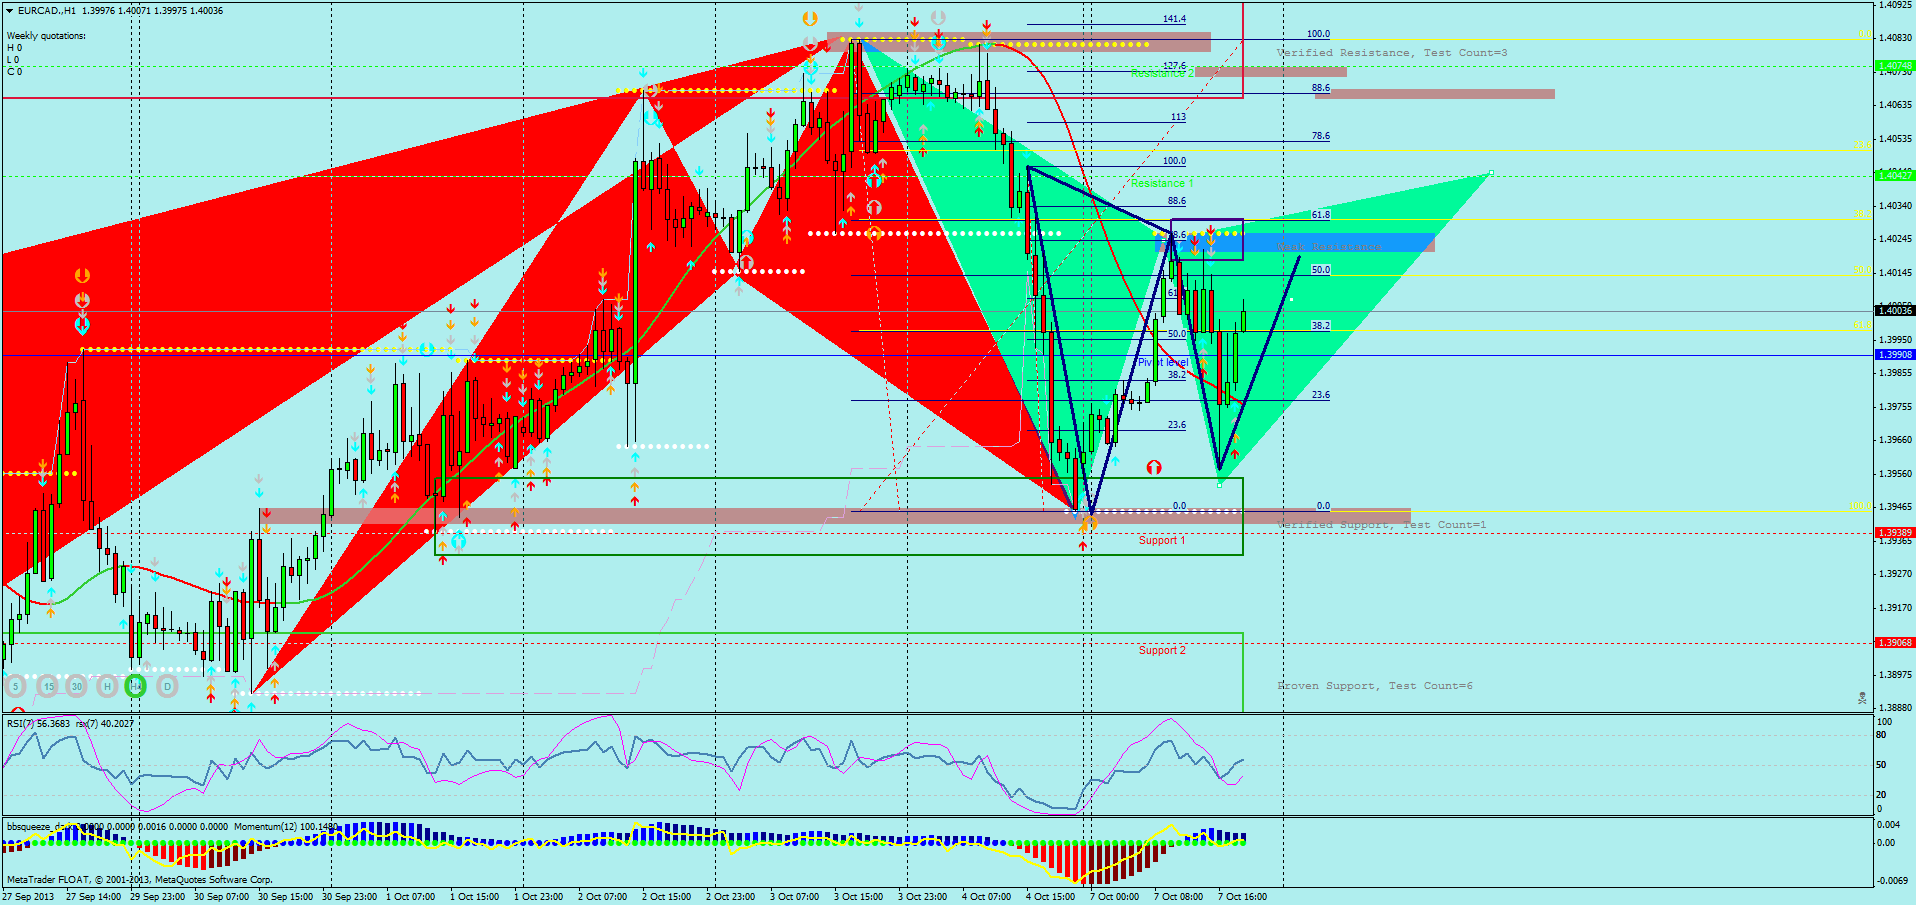
On the other hand I might be completely wrong thinking of this instead of "trade what you see" approach.
No, I meant like on your pics, the bat XA (pic2 blue) lining up with the previous HPs CD leg (red)That is my prefered XA, however there might be smaller XA legs coming to a viable, even in many cases profitable HP.Here is another one, not the best, I was just looking for one example quicly.The green HP lines up with a previous HPs CD leg, this potential HP I see more potential, than the butterfly from a smaller XA (dark blue XAB line shape).. however in this case they line up relatively nicely.I hope I could explain better now what I meant.
You meant "back to back" patterns. If you draw patterns by yourself, it won't look like the pic you post because harmonic patterns have ratios to complete. Anyways, I don't care about back-to-back patterns. I mean when it happen, I'm like "yea harmonics rock!" but I don't see more potential. It's just my opinion. Can you share us why you see more potential?
The bullish bat didn't work out. I ended up selling after Demark 9. Closed and entered long at DR3. Target is DR2. The pair may continue to go down. We now have a potential bullish crab.
Almost stopped out but the crab worked out. Hit target 1. I could have taken a bullish bat/N200.