Harmonic Analysis - page 278
You are missing trading opportunities:
- Free trading apps
- Over 8,000 signals for copying
- Economic news for exploring financial markets
Registration
Log in
You agree to website policy and terms of use
If you do not have an account, please register
How could you know if it's relatively nice even though you have a problem most of the time? You should read the structure. The blue pattern will "repaint" if price keeps falling.
If I thoght it was "really nice" I probably thought of the blue color .
.
We know the repaint don´t we?
Failed gartley becoming a butterfly, failed bat becoming a crab, failed cypher becoming a shark, failed AB=CD becoming an AB= 1.27CD or = 1.618CD?
My decision making has a problem most of the time, I dunno if you remember a similar case...there were some discussions that time as I recall:
That broken XA meant closer to +200 pips for the lucky ones taking the abcd-gartley combo... and yes demand zone(s) there too
Chart EURAUD, H4, 2014.04.22 17:06 UTC, HF Markets Ltd, MetaTrader 4, Demo - MetaTrader Trading Platform Screenshots
Please clarify if you see any solution to this doubt of mine.
We know the repaint don´t we? Failed gartley becoming a butterfly, failed bat becoming a crab, failed cypher becoming a shark, failed AB=CD becoming an AB= 1.27CD or = 1.618CD? My decision making has a problem most of the time, I dunno if you remember a similar case...there were some discussions that time as I recall: That broken XA meant closer to +200 pips for the lucky ones taking the abcd-gartley combo... and yes demand zone(s) there too
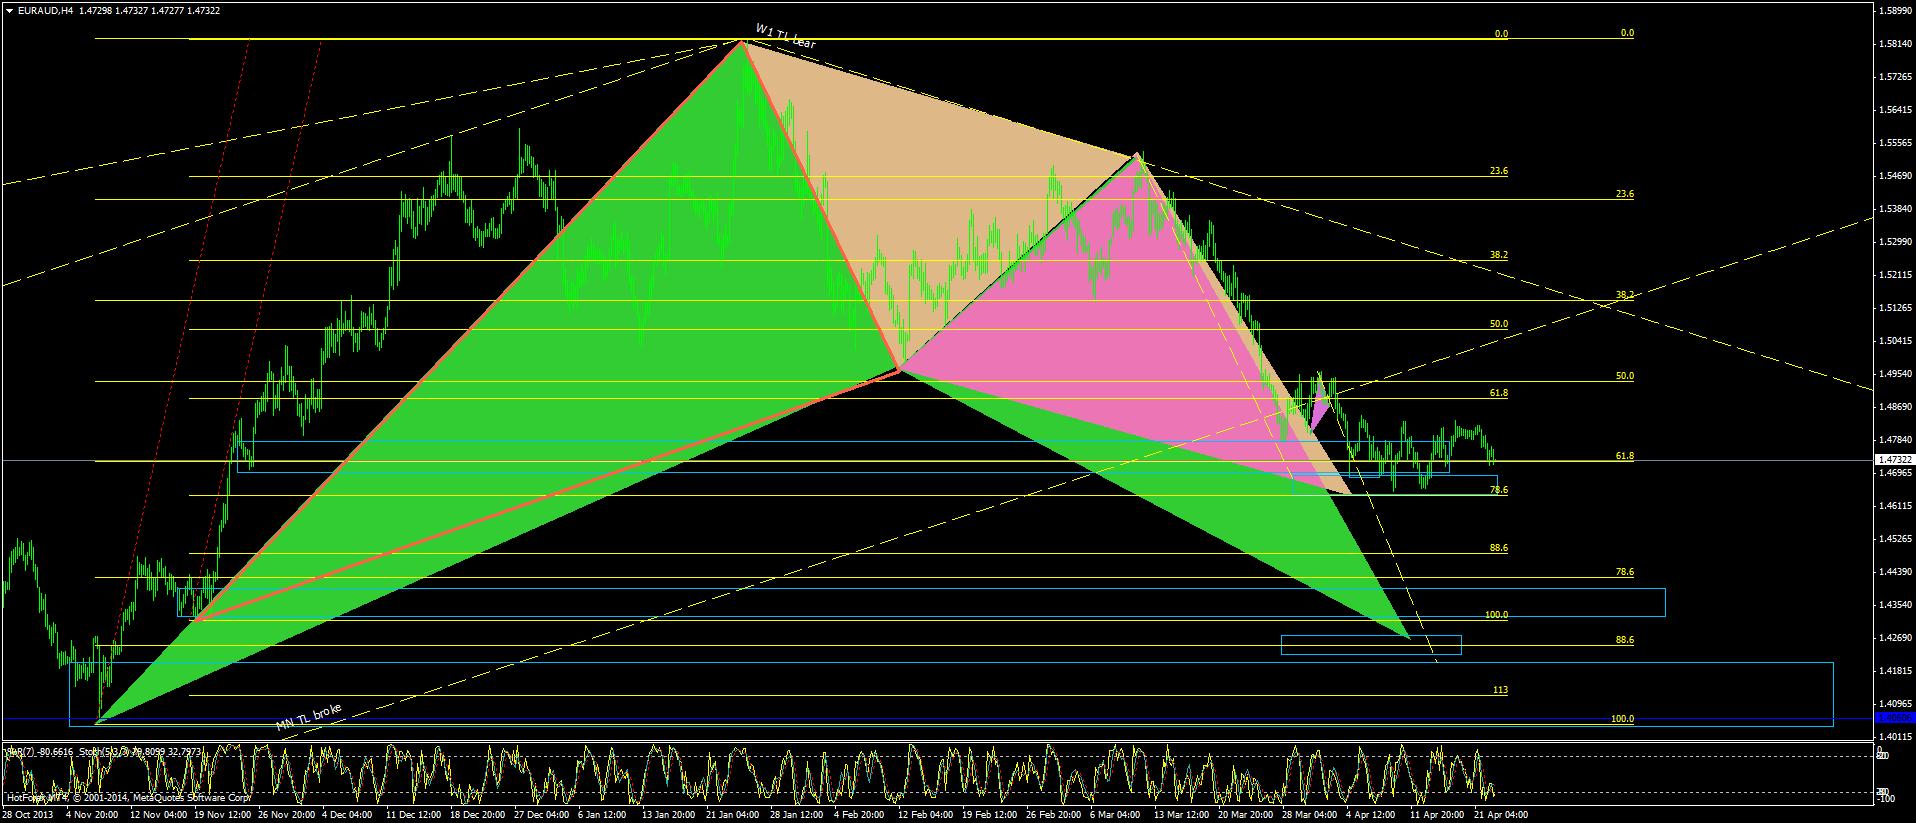
Chart EURAUD, H4, 2014.04.22 17:06 UTC, HF Markets Ltd, MetaTrader 4, Demo - MetaTrader Trading Platform Screenshots Please clarify if you see any solution to this doubt of mine.I was NOT talking about EURAUD. I was talking about the blue pattern on EURGBP.
I was NOT talking about EURAUD. I was talking about the blue pattern on EURGBP.
XA leg segmentation I was asking some guidelines about.
Same situation on this pic with EA as EG ...just for generalization of the matter in question.
-------------------------this is not Garth
------AC not-886-check manually Fibonacci
Has your definition of strong area been proved by yourself by trading? Has it been proved that it's stronger than just one harmonic pattern? This is my opinion, often LTF supply and demand zones meet within HTF supply and demand zones and I don't it doesn't mean it's stronger when LTF and HTF supply and demand zones are met. HTF supply and demand zones are larger, within HTF zone, there may be more than 3 supply and demand zones.
I am testing it, as mentioned, and the reason I stick with testing, because it seems to work...
LTF zones withint HTF big zones its is a matter of calculation, i.e. take each of those with smaller lot size and still keep the SL at lets say below X (if there is HP involved) for all, or to fight each one separately with small risk but expecting appropriate RR...
I think.
You used a lot the D/W/M pivots and fibpivots... what was your experience when thos different TF levels fell in the same area of the HP or something similar?
here is one example...strong levels, it does not mean will not break and then to expect longs, but till then any short is a possible trade with good RR:
Gyazo - f02a4f7a9268e1bd194d48ba45a41b34.png
Could be looked at more TFs but would not fit the screen, this set of TFs is an option.
Should not necessarily trust the indi, but based on the supply level values it is nested from the HTF to LTF right now. Will work? I dont know, but I have seen this kinda nest working.
------AC not-886-check manually Fibonacci
Which one you mean? There are several options.
Please send a graph.
If you meant this one, it is pretty much 88.6:
Chart EURGBP, D1, 2014.04.22 18:19 UTC, HF Markets Ltd, MetaTrader 4, Demo - MetaTrader Trading Platform Screenshots
If you meant something else, please be more specific.
BTW I see a lot of times this relation can be a DT or DB and still works more than fine. I think Poruchik would have a better knowledge about it, with all the patterns, if there is a question, I suggest you ask him.
Tnx
XA leg segmentation I was asking some guidelines about. Same situation on this pic with EA as EG ...just for generalization of the matter in question.
I posted this about two weeks ago.
I posted this about two weeks ago.
Nice pic as usual from you!
What is your conclusion? Trade what you see, or something more? How do you approach these situations?
Nice pic as usual from you! What is your conclusion? Trade what you see, or something more? How do you approach these situations?
I would take both. Btw take a look at NZDUSD 4H. Price bounced at the hammer bar level I pointed out last week.
I would take both. Btw take a look at NZDUSD 4H. Price bounced at the hammer bar level I pointed out last week.
Yes indeed, it is nice.
Can you explain a little about this hammer bar level approach? When I look at that hammer candle (if this is what it is) it looks the same, as my current understanding about H4 demand zone drawn by lets say the level of 50/50 (body/wick) candles.
So what do you mean by hammer bar level?