Harmonic Analysis - page 325
You are missing trading opportunities:
- Free trading apps
- Over 8,000 signals for copying
- Economic news for exploring financial markets
Registration
Log in
You agree to website policy and terms of use
If you do not have an account, please register
but can't find 7 or 8 that you mention. Do you have a link for these versions?
I have not mentioned versions I think... I do not even know what version I do have here...
Dunno...
I have this one, I use this one since long..
I am happy with it, long time I have not even looked into it...
as I see error level is set to 0.05%
that will be/might be different to ur eyes, to ZUPs as well as Kor indis, or anything else...
I did not follow this indi after I got my version I liked... sorry.
Anything you want different, I suggest you search harder.
I have not mentioned versions I think... I do not even know what version I do have here...
Dunno...
I have this one, I use this one since long..
I am happy with it, long time I have not even looked into it...
as I see error level is set to 0.05%
that will be/might be different to ur eyes, to ZUPs as well as Kor indis, or anything else...
I did not follow this indi after I got my version I liked... sorry.
Anything you want different, I suggest you search harder.My bad Lobo. I thought you said version 8, but you were talking about USING ALL 8 CORES. DOH, now I feel dumb. Lol.
Plz do not feel bad! Anything I can help you with, let me know.
Finally closed with 530 pips in profit.
After the gartley, I opened a short position. Closed with 200pips.
For directions to take or pay attention to, I am experimenting with this parabolic sar report script and indis, so far so good.
Gyazo - af0893c12be583386afc8f5f7005d53f.png
This is for today at night... for just screening it is less trouble than going through all pairs, and trust my eyes..
When candidates are selected based on H1 through MN1 TF, then can start the analyzing work for levels, HPs and finalizing main focus items.
Started not long ago, so no real data, other than backtesting. In backtesting I was quite amazed.
For closer look I also set up profiles...similar to the report, but allowing me to have closer look for analyzing levels and HPs as well as trends..
Gyazo - e189bf4bc9d5eb954b1c1858cc9cd065.png
So far I am happy with this approach.
USDCAD Bearish SHS and a Cypher after.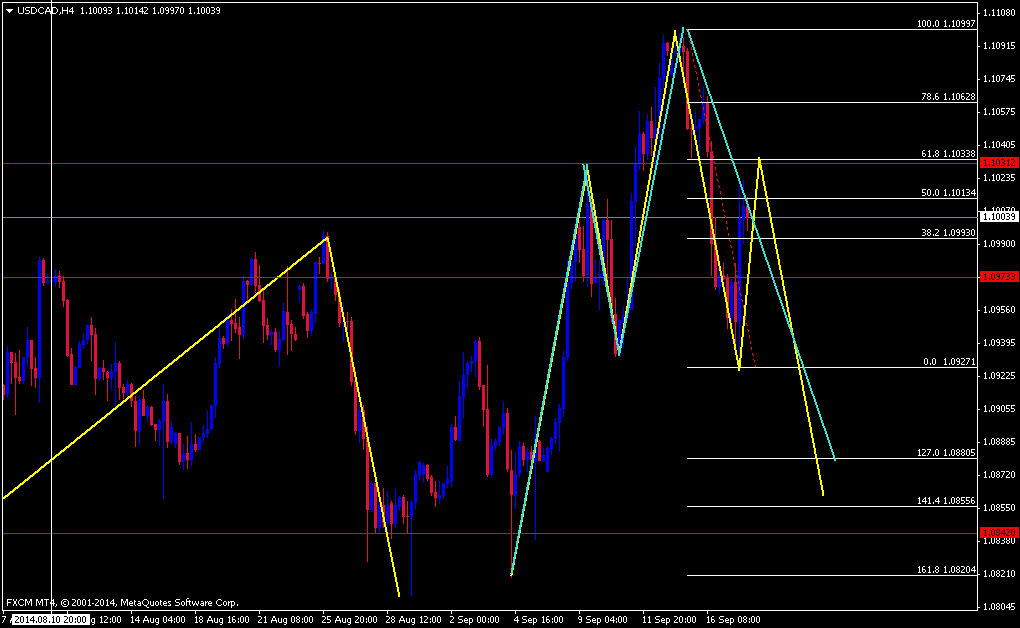
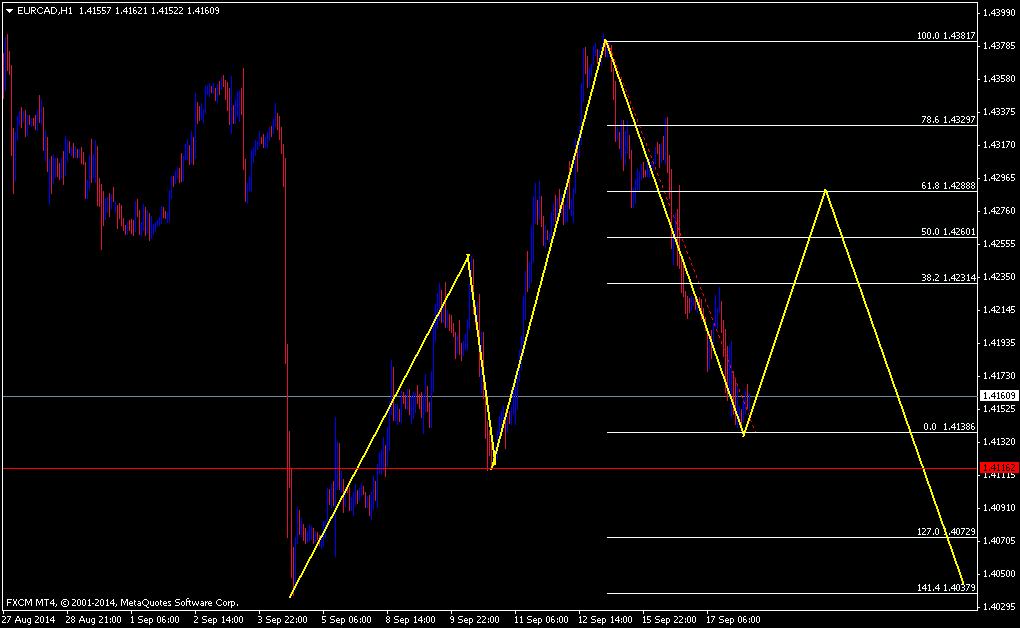
EURCAD posible Bullish SHS.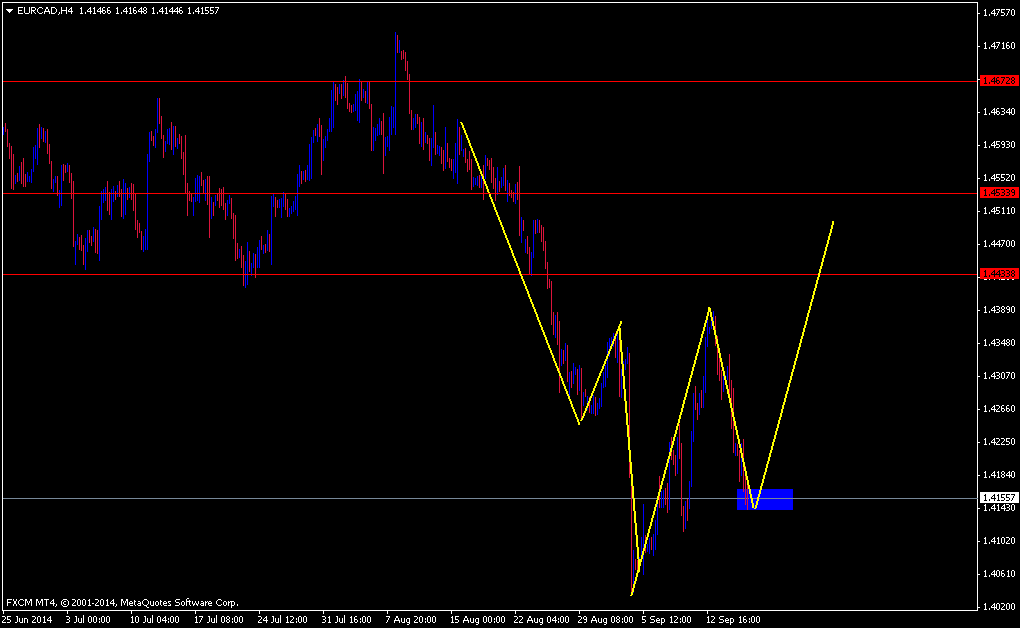
For directions to take or pay attention to, I am experimenting with this parabolic sar report script and indis, so far so good.
Gyazo - af0893c12be583386afc8f5f7005d53f.png
This is for today at night... for just screening it is less trouble than going through all pairs, and trust my eyes..
When candidates are selected based on H1 through MN1 TF, then can start the analyzing work for levels, HPs and finalizing main focus items.
Started not long ago, so no real data, other than backtesting. In backtesting I was quite amazed.
For closer look I also set up profiles...similar to the report, but allowing me to have closer look for analyzing levels and HPs as well as trends..
Gyazo - e189bf4bc9d5eb954b1c1858cc9cd065.png
So far I am happy with this approach.Wow lobo. Looks great! I'm very interested to know which S/R indi you are using on your H4 chart, and which indi has those red dots (the stop loss dots?).
Only if you care to share.
Thanks,
Bubba
which S/R indi you are using on your H4 chart, and which indi has those red dots (the stop loss dots?).
No secrets here, most indis are freely available on the net, very limited if any are for a fee here...
dots are simply Parabolic SAR, there are MTF versions one can apply to just one graph as well
Dunno what you mean on H4 but there are 2 lines showing the Stretch breakout level (Read about Taylor, similar, sell high, buy low or trade breakouts in his Book Method)...but not sure what you are asking about..
So here are the indis:
H1:
Gyazo - 40d053131ba99d6005da3be139941832.png
H4:
Gyazo - 4fa7a81140d1b9656466c6a2d33e57ce.png
Tell me more specifcally if you do not find the one you were asking about...
or mark it up on a dwg..
The rectangles and the triangle looking sup/dem level with next level value in the lower right corner is IISupDem indicator from Insenityindustries..or sthg like that...
Nice move up on the selected one right a day later, right? Too bad it is still in testing phase ...
...
Also it is time to change the color of Gold to red instead of the old fashioned golden yellow lol, until it gets down at least to 1170-80-ish.. crab on a daily at least:)
Gyazo - cc59b4902896004a120bb7402c08e1b8.png
bye
No secrets here, most indis are freely available on the net, very limited if any are for a fee here...
dots are simply Parabolic SAR, there are MTF versions one can apply to just one graph as well
Dunno what you mean on H4 but there are 2 lines showing the Stretch breakout level (Read about Taylor, similar, sell high, buy low or trade breakouts in his Book Method)...but not sure what you are asking about..
So here are the indis:
H1:
Gyazo - 40d053131ba99d6005da3be139941832.png
H4:
Gyazo - 4fa7a81140d1b9656466c6a2d33e57ce.png
Tell me more specifcally if you do not find the one you were asking about...
or mark it up on a dwg..
The rectangles and the triangle looking sup/dem level with next level value in the lower right corner is IISupDem indicator from Insenityindustries..or sthg like that...
Nice move up on the selected one right a day later, right? Too bad it is still in testing phase ...
...
Also it is time to change the color of Gold to red instead of the old fashioned golden yellow lol, until it gets down at least to 1170-80-ish.. crab on a daily at least:)
Gyazo - cc59b4902896004a120bb7402c08e1b8.png
byeThank you so much! Lobo, this is great. I can't wait to get home and look some of these indicators up, and start testing. I really like the way your set up looks.