PullbackShit

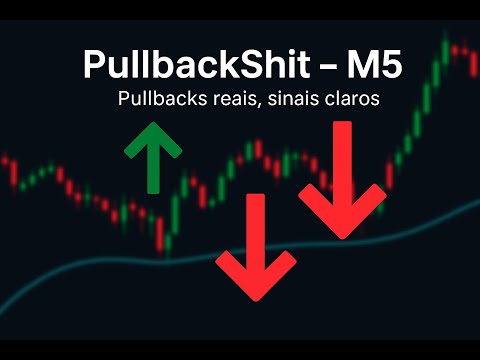
PullbackShit – Signals on M5

The PullbackShit indicator was designed for traders who seek objective entries in pullbacks on the 5-minute timeframe.
Based on the interaction between price and moving average, the indicator plots potential buy and sell points on the chart with clear visual arrows.

🔑 Key features:

  • Validated pullbacks: generates a signal only when the price returns to the moving average and confirms the move.

  • Clear and visual signals: green arrows (buy) and red arrows (sell) directly on the chart.

  • Noise filter: prevents multiple signals in a row, improving reliability.

  • Exclusive for M5: designed and optimized to work only on the 5-minute timeframe.

  • Recommendation: It is not recommended to trade signals against the asset’s trend.

    IMPORTANT NOTICES!

    PullbackShit was developed for the Metatrader 5 platform with an extremely complex, precise, and sensitive analysis code, which is why it only works on the 5-minute chart.

    Usage Instructions:

    • Only on the 5-minute chart.

    • When adding the indicator, do not change the timeframe.

    • Leave the box "Allow modification of signal settings" unchecked.

    • If you want to observe a higher timeframe, open a new chart without the indicator.

    • Changing timeframes may cause reading errors and incorrect signal displays due to the code's complexity, sensitivity, and precision.

    After adding the indicator, it is recommended to restart the platform for market data re-reading.

    During high-impact news events, this indicator does not predict price direction. Just as technical analysis is not recommended during these times, neither is using this indicator to predict sudden high-impact fluctuations. Check an online economic calendar for news release times.

    Trade with the trend for best results. Counter-trend trades are high-risk and may generate false signals. Restarting the platform is crucial for data re-reading.

    Counter-Trend Signals Warning:
    If, after restarting the platform, a signal appears opposite to your current trade, analyze which aligns with the trend—your trade or the indicator’s signal. If your trade follows the trend, you may continue (accepting the stop-loss risk, which is normal within risk management) or close it immediately.

    Demo Account Recommended:
    Test the indicator in a demo account to select suitable assets, as each currency pair or asset has unique characteristics. PullbackShit provides signals but DOES NOT OPEN AUTOMATIC ORDERS—trading decisions are the user’s responsibility. Careful observation of assets and their post-signal behavior is essential.

    Connection Issues:
    If the platform disconnects, restart it fully (do not just log back in) to ensure accurate data re-reading.

    Risk Management:

    • Use stop-loss (SL): Place SL above the arrow for buys, below for sells. Adjust as new signals appear.

    • This is a suggestion to minimize losses and protect profits. Always apply risk management suited to your trading style and account balance.

    Entry Timing:
    You may enter a trade as soon as the signal appears or wait for a pullback—this is a personal decision based on chart analysis. The indicator is not responsible for gains or losses. Day trading is highly volatile; signals may last a full cycle or just moments (e.g., a late-cycle signal may yield brief profit opportunities). For best results, use the indicator on a clean chart.

    Not for Crypto Markets.

    As Uncle Ben from Spider-Man said: “With great power comes great responsibility.” Hence these usage warnings.

    PULLBACKSHIT WAS DEVELOPED FOR METATRADER 5 WITH AN EXTREMELY COMPLEX, PRECISE, AND SENSITIVE ANALYSIS CODE.


Recommended products
Follow The Line MT5
Oliver Gideon Amofa Appiah
4.59 (34)
This indicator obeys the popular maxim that: "THE TREND IS YOUR FRIEND" It paints a GREEN line for BUY and also paints a RED line for SELL. (you can change the colors). It gives alarms and alerts of all kinds. IT DOES NOT REPAINT and can be used for all currency pairs and timeframes. Yes, as easy and simple as that. Even a newbie can use it to make great and reliable trades. NB: For best results, get my other premium indicators for more powerful and reliable signals. Get them here: https://www.m
FREE
Mitimom
Danil Poletavkin
The indicator is based on Robert Miner's methodology described in his book "High probability trading strategies" and displays signals along with momentum of 2 timeframes. A Stochastic oscillator is used as a momentum indicator. The settings speak for themselves period_1 is the current timeframe, 'current' period_2 is indicated - the senior timeframe is 4 or 5 times larger than the current one. For example, if the current one is 5 minutes, then the older one will be 20 minutes The rest of the s
FREE
Donchian Channel DC is the indicator of Donchian Channels, that plots maximum and minimum values of a specific period, besides mean value line. It´s possible to configure simple period for analysis and the indicator will plot all three values. You can trade with this indicator as trend or reversal, according to each strategy. Do not let to test others indicators as soon as others expert advisors.
The indicator identifies when a divergence occurs between price and an indicator or oscillator. It identifies both regular and hidden divergences. Combined with your own rules and techniques, this indicator will allow you to create (or enhance) your own powerful system. For higher probability setups I can recommend you to use my Supply Demand indicator and trade only if the divergence occurs inside a zone. Supply zone for bearish div and demand zone for bullish div. The optimal scenario is if it
FREE
High Low Open Close
Alexandre Borela
4.98 (42)
If you like this project, leave a 5 star review. This indicator draws the open, high, low and closing prices for the specified period and it can be adjusted for a specific timezone. These are important levels looked by many institutional and professional traders and can be useful for you to know the places where they might be more active. The available periods are: Previous Day. Previous Week. Previous Month. Previous Quarter. Previous year. Or: Current Day. Current Week. Current Month. Current
FREE
The Scaled Awesome Oscillator (SAO) represents a refined adaptation of the Awesome Oscillator, aimed at establishing consistent benchmarks for identifying market edges. Unlike the standard Awesome Oscillator, which records the variation in pips across different commodities, the only unchanging reference point is the zero line. This limitation hampers investors and traders from pinpointing specific levels for trend reversals or continuations using the traditional Awesome Indicator, a creation of
FREE
RSI Momentum Shift Detector - Momentum Change Indicator OVERVIEW RSI Momentum Shift Detector is a technical indicator designed to detect significant changes in price momentum using RSI analysis. The indicator identifies momentum shifts that may indicate potential trend changes or continuation patterns. MOMENTUM ANALYSIS Detection Methods - RSI level changes - RSI slope analysis - Momentum acceleration/deceleration - Divergence detection - Overbought/oversold transitions Shift Types Detecte
FREE
Reversal Composite Candles
MetaQuotes Ltd.
3.67 (15)
The idea of the system is to indentify the reversal patterns using the calculation of the composite candle. The reversal patterns is similar to the "Hammer" and "Hanging Man" patterns in Japanese candlestick analysis. But it uses the composite candle instead the single candle and doesn't need the small body of the composite candle to confirm the reversal. Input parameters: Range - maximal number of bars, used in the calculation of the composite candle. Minimum - minimal size of the composite can
FREE
Important Lines
Terence Gronowski
4.87 (23)
This indicator displays Pivot-Lines, preday high and low, preday close and the minimum and maximum of the previous hour. You just have to put this single indicator to the chart to have all these important lines, no need to setup many single indicators. Why certain lines are important Preday high and low : These are watched by traders who trade in a daily chart. Very often, if price climbs over or falls under a preday low/high there is an acceleration in buying/selling. It is a breakout out of a
FREE
General Description This indicator is an enhanced version of the classic Donchian Channel , upgraded with practical trading functions. In addition to the standard three lines (high, low, and middle), the system detects breakouts and displays them visually with arrows on the chart, showing only the line opposite to the current trend direction for a cleaner view. The indicator includes: Visual signals : colored arrows on breakout Automatic notifications : popup, push, and email RSI filter : to val
FREE
LT Donchian Channel
Thiago Duarte
4.83 (6)
Donchian Channel is an indicator created by Richard Donchian. It is formed by taking the highest high and the lowest low of the last specified period in candles. The area between high and low is the channel for the chosen period. Its configuration is simple. It is possible to have the average between the upper and lower lines, plus you have alerts when price hits one side. If you have any questions or find any bugs, please contact me. Enjoy!
FREE
MACD Enhanced
Nikita Berdnikov
5 (2)
Introducing the MACD  Enhanced – an advanced MACD (Moving Average Convergence Divergence) indicator that provides traders with extended capabilities for trend and momentum analysis in financial markets. The indicator uses the difference between the fast and slow exponential moving averages to determine momentum, direction, and strength of the trend, creating clear visual signals for potential entry and exit points. Attention! To achieve the best results, it is recommended to adapt the indicator
FREE
Half ma
Artem Svistunov
The Half ma arrow indicator for the MetaTrader 5 trading terminal is a simple but effective tool that gives a signal about a change in the current trend. The Half ma indicator looks like a solid dynamic line that changes color at the points where the trend changes. At these points, the indicator draws arrows of the corresponding color and direction.The Half ma arrow indicator for the MT5 terminal is not an independent source of input signals. It will be most effective to use it as a trend filte
Magic 7 Indicator
Marek Pawel Szczesny
Overview Magic 7 Indicator is a comprehensive MetaTrader 5 (MQL5) indicator that identifies seven different trading scenarios based on candlestick patterns and technical analysis. The indicator combines traditional price action patterns with modern concepts like Fair Value Gaps (FVG) to provide trading signals with precise entry points and stop loss levels. Features 7 Trading Scenarios : Each scenario identifies specific market conditions and trading opportunities Visual Signals : Clear buy/sell
FREE
The   "Haven Key Levels PDH PDL"   indicator helps traders visualize key levels on the chart. It automatically marks the following levels: DO (Daily Open)   — the daily open level. NYM (New York Midnight)   — the New York midnight level. PDH (Previous Day High)   — the previous day's high. PDL (Previous Day Low)   — the previous day's low. WO (Weekly Open)   — the weekly open level. MO (Monthly Open)   — the monthly open level. PWH (Previous Week High)   — the previous week's high. PWL (Previou
FREE
Order Book, known also as Market Book, market depth, Level 2, - is a dynamically updated table with current volumes of orders to buy and to sell specific financial instument at price levels near Bid and Ask. MetaTrader 5 provides the means for receiving market book from your broker, but in real time only, without access to its history. The indicator OrderBook Cumulative Indicator accumulates market book data online and visualizes them on the chart. In addition, the indicator can show the market
Reversal Candles MT5
Nguyen Thanh Cong
4.83 (6)
Introduction Reversal Candles is a cutting-edge non-repainting   forex indicator designed to predict price reversals with remarkable accuracy through a sophisticated combination of signals. Signal Buy when the last closed candle has a darker color (customizable) and an up arrow is painted below it Sell when the last closed candle has a darker color (customizable) and a down arrow is painted above it
FREE
Multi-timeframe trend indicator, based on the ADX / ADXWilder indicator The indicator shows trend areas using ADX or ADXWilder indicator data from multiple timeframes. The impulse mode of the indicator allows you to catch the beginning of a trend, and several "Screens" with different timeframes allow you to filter out market noise. How the indicator works: if PDI is greater than NDI, then it`s bullish movement; if PDI is less than NDI, then it`s bearish movement; to determine any trend, it is
FREE
PFKBreakOut
Stanislav Korotky
This indicator displays breakouts on Point-And-Figure-like or Kagi-like custom symbol charts, generated by special expert advisers, such as PointFigureKagiCharts . This indicator is applicable only for custom instruments generated in appropriate way (with time-invariant bars which are multiples of a predefined box size). It makes no sense to apply it to other charts. The breakouts in up or down direction are marked by arrows. The breakout price is found at crossing of one of imaginary lines of
FREE
JAC Trend Color Candle
Eduardo Da Costa Custodio Santos
The indicator "JAC Trend Color Candle" for Meta Trader 5, was created to visually facilitate the trend for the trader. It is based on three parameters, which identifies the uptrend, downtrend and non-trending market. The colors are trader-configurable, and the average trader-configurable as well. trend parameters cannot be configured as they are the indicator's differential.
Enhance your trading analysis with the Haiken Ashi MT5 indicator. This powerful tool transforms standard price data into smoother, trend-following candlesticks, making it easier to identify market trends and potential reversal points.    Key Features: Clear Trend Identification: Visually distinguish between uptrends and downtrends with distinct candle colors. Reduced Noise: Filter out price fluctuations, providing a clearer view of underlying market movements. Early Trend Detection: Anticipate
FREE
Free automatic Fibonacci is an indicator that automatically plots a Fibonacci retracement based on the number of bars you select on the BarsToScan setting in the indicator. The Fibonacci is automatically updated in real time as new highest and lowest values appears amongst the selected bars. You can select which level values to be displayed in the indicator settings. You can also select the color of the levels thus enabling the trader to be able to attach the indicator several times with differe
FREE
Support and Ressistance
Raphael Lorenz Baumgartner
Last Day Support & Resistance Platform: MetaTrader 5 Type: Custom Indicator Display: Chart Window (Overlay) Functions: Calculates Support and Resistance zones based on high/low patterns of the previous day. Uses a sliding sampling window ( SampleWindowSize ) to detect recent price ranges. Detects potential support if current price range is significantly below previous highs. Detects potential resistance if price range is significantly above previous lows. Updates four output buffers: LDResistanc
FREE
HMA Color with Alerts MT5
Pavel Zamoshnikov
4.75 (55)
Hull Moving Average (HMA) is well-deservedly popular among traders because of the effective averaging of market noise and a relatively small delay. The current MetaTrader 5 version changes its color when the movement direction changes. Sound and text signals are available. It also supports sending email and push messages. It is possible to trigger a signal on the current incomplete bar, although such a signal may be canceled before completion if conditions are no longer appropriate. One of the p
FREE
Multi-timeframe trend indicator based on the ADX / ADXWilder indicator with Fibonacci levels The indicator shows trend areas using ADX or ADXWilder indicator data from multiple timeframes. The impulse mode of the indicator allows you to catch the beginning of a trend, and several "Screens" with different timeframes allow you to filter out market noise. Fibonacci levels are added to the price chart, which have flexible settings. How the indicator works: if PDI is greater than NDI, then   it`s
FREE
Dual RSI
Paul Conrad Carlson
3 (1)
Indicator alerts for Dual Relative strength index rsi. Large rsi preset at 14 is below 30 small rsi preset at 4 is below 10 for buy bullish signals . Large rsi preset are 14 is above 70 small rsi preset at 4 is above 90 for sell bearish signals . Includes mobile and terminal alerts. draws lines when alerts. This indicator can help identify extremes and then the tops or bottoms of those extremes .
FREE
If you trade with moving averages, this indicator will be your best assistant. Here's what it can do: it shows signals when two moving averages intersect (for example, a fast moving average breaks through a slow moving average from bottom to top - growth is possible). It notifies you in all ways: it beeps in the terminal, sends a notification to your phone and an email to your email — now you definitely won't miss a deal. It can be flexibly adjusted: you can choose exactly how to calculate the m
FREE
Statistical Arbitrage Spread Generator for Cointegration [MT5] What is Pair Trading? Pair trading is a market-neutral strategy that looks to exploit the relative price movement between two correlated assets — instead of betting on the direction of the market. The idea? When two assets that usually move together diverge beyond a statistically significant threshold, one is likely mispriced. You sell the expensive one, buy the cheap one , and profit when they converge again. It’s a statistica
FREE
Trend indicator based on the ADX / ADXWilder indicator The indicator shows trend areas using ADX or ADXWilder indicator data. How the indicator works: if PDI is greater than NDI, then it`s bullish movement; if PDI is less than NDI, then it`s bearish movement; if ADX is less than or equal to the filter value specified in the parameters, then there is no movement state. Input parameters of the indicator: Calculate Timeframe - timeframe for calculation; ADX Type - type of ADX calculation based
FREE
Are you tired of drawing trendlines every time you're analyzing charts? Or perhaps you would like more consistency in your technical analysis. Then this is for you. This indicator will draw trend lines automatically when dropped on a chart. How it works Works similar to standard deviation channel found on mt4 and mt5. It has 2 parameters: 1. Starting Bar 2. Number of bars for calculation The   starting bar   is the bar which drawing of the trend lines will begin, while the   number of bars for c
FREE
Buyers of this product also purchase
New Update of   Smart Trend Trading System MT5 For  2026 Market: If You Buy this Indicator you will Get my Professional Trade Manager + EA  for FREE . First of all Its worth emphasizing here that this Trading System is Non-Repainting   , Non Redrawing and Non Lagging Indicator Which makes it ideal from both manual and robot trading .  [Online course] , [manual] and [download presets] . The Smart Trend Trading System MT5 is a comprehensive trading solution tailored for new and experienced traders
Divergence Bomber
Ihor Otkydach
4.99 (77)
Each buyer of this indicator also receives the following for free: The custom utility "Bomber Utility", which automatically manages every trade, sets Stop Loss and Take Profit levels, and closes trades according to the rules of this strategy Set files for configuring the indicator for various assets Set files for configuring Bomber Utility in the following modes: "Minimum Risk", "Balanced Risk", and "Wait-and-See Strategy" A step-by-step video manual to help you quickly install, configure, and s
Gold Sniper Scalper Pro
Ich Khiem Nguyen
5 (4)
Gold Sniper Scalper Pro - Gold (XAU/USD) Trading System on MetaTrader 5 For the serious trader: Approach Gold trading with a structured, data-driven methodology that combines multiple market analysis factors. This tool is built to support your Gold trading analysis. Limited Price Opportunity This is a chance to own Gold Sniper Scalper Pro before the price increases. The product price will increase by $50 after every 10 subsequent purchases. Final Price: $498 Features That Define Your Analytical
Atomic Analyst MT5
Issam Kassas
4.31 (26)
New Update of   Atomic Analyst MT5 For  2026 Market: If You Buy this Indicator you will Get my Professional   Trade Manager + EA  for   FREE . First of all Its worth emphasizing here that this Trading Indicator is   Non-Repainting   , Non Redrawing and Non Lagging Indicator   Indicator, Which makes it ideal from both manual and robot trading.  User manual: settings, inputs and strategy . The Atomic Analyst  is a PA Price Action Indicator that uses Strength and Momentum of the price to find a bet
FX Power MT5 NG
Daniel Stein
5 (28)
FX Power: Analyze Currency Strength for Smarter Trading Decisions Overview FX Power is your go-to tool for understanding the real strength of currencies and Gold in any market condition. By identifying strong currencies to buy and weak ones to sell, FX Power simplifies trading decisions and uncovers high-probability opportunities. Whether you’re looking to follow trends or anticipate reversals using extreme delta values, this tool adapts seamlessly to your trading style. Don’t just trade—trade
SynaptixQuant Dominance Matrix
Devie Arevalo Montemayor
5 (1)
SynaptixQuant Dominance Matrix: Institutional-Grade Market State Extraction Engineered for traders who require a data-driven view of market behaviour beyond surface-level indicators. The Synaptix Quant (SQ) Dominance Matrix is not a conventional currency strength display. Behind its intentionally streamlined interface runs a sophisticated analytical architecture designed to quantify market conditions with precision. Every output is generated through layered signal processing built to identify d
Grabber System MT5
Ihor Otkydach
4.79 (19)
Let me introduce you to an excellent technical indicator – Grabber, which works as a ready-to-use "All-Inclusive" trading strategy. Within a single code, it integrates powerful tools for technical market analysis, trading signals (arrows), alert functions, and push notifications. Every buyer of this indicator also receives the following for free: Grabber Utility for automatic management of open orders Step-by-step video guide: how to install, configure, and trade with the indicator Custom set fi
Quantum TrendPulse
Bogdan Ion Puscasu
5 (19)
Introducing Quantum TrendPulse , the ultimate trading tool that combines the power of SuperTrend , RSI , and Stochastic into one comprehensive indicator to maximize your trading potential. Designed for traders who seek precision and efficiency, this indicator helps you identify market trends, momentum shifts, and optimal entry and exit points with confidence. Key Features: SuperTrend Integration: Easily follow the prevailing market trend and ride the wave of profitability. RSI Precision: Detect
First of all Its worth emphasizing here that this Trading Tool is Non Repainting , Non Redrawing and Non Lagging Indicator , Which makes it ideal for professional trading . Online course, user manual and demo. The Smart Price Action Concepts Indicator is a very powerful tool for both new and experienced traders . It packs more than 20 useful indicators into one , combining advanced trading ideas like Inner Circle Trader Analysis and Smart Money Concepts Trading Strategies . This indicator focus
Trend indicator AI mt5
Ramil Minniakhmetov
5 (12)
Trend Ai indicator  mt5 is great tool that will enhance a trader’s market analysis by combining trend identification with actionable entry points and reversal alerts.  This indicator empowers users to navigate the complexities of the forex market with confidence and precision Beyond the primary signals, Trend Ai indicator identifies secondary entry points that arise during pullbacks or retracements, enabling traders to capitalize on price corrections within the established trend. Important Advan
FX Volume MT5
Daniel Stein
4.79 (24)
FX Volume: Experience Genuine Market Sentiment from a Broker’s Perspective Quick Overview Looking to elevate your trading approach? FX Volume provides real-time insights into how retail traders and brokers are positioned—long before delayed reports like the COT. Whether you’re aiming for consistent gains or simply want a deeper edge in the markets, FX Volume helps you spot major imbalances, confirm breakouts, and refine your risk management. Get started now and see how genuine volume data can
TPSproTREND PrO MT5
Roman Podpora
4.72 (18)
Buy TREND PRO now and get another advanced trend indicator for free To receive, write in private messages. ИНСТРУКЦИЯ RUS    -  INSTRUCTIONS  ENG    -  VERSION MT4   Main functions: Accurate entry signals WITHOUT REPAINTING! Once a signal appears, it remains valid! This is a significant distinction from repainting indicators that might provide a signal and then alter it, potentially leading to deposit losses. Now, you can enter the market with higher probability and precision. There's also a f
Top indicator for MT5   providing accurate signals to enter a trade without repainting! It can be applied to any financial assets:   forex, cryptocurrencies, metals, stocks, indices .  Watch  the video  (6:22) with an example of processing only one signal that paid off the indicator! MT4 version is here It will provide pretty accurate trading signals and tell you when it's best to open a trade and close it. Most traders improve their trading results during the first trading week with the help of
How many times have you bought a trading indicator with great back-tests, live account performance proof with fantastic numbers and stats all over the place but after using it, you end up blowing your account? You shouldn't trust a signal by itself, you need to know why it appeared in the first place, and that's what RelicusRoad Pro does best! User Manual + Strategies + Training Videos + Private Group with VIP Access + Mobile Version Available A New Way To Look At The Market RelicusRoad is the
TrendLine PRO MT5
Evgenii Aksenov
4.67 (33)
The Trend Line PRO indicator is an independent trading strategy. It shows the trend change, the entry point to the transaction, as well as automatically calculates three levels of Take Profit and Stop Loss protection. Trend Line PRO is perfect for all Meta Trader symbols: currencies, metals, cryptocurrencies, stocks and indices. The indicator is used in trading on real accounts, which confirms the reliability of the strategy. Robots using   Trend Line PRO   and real Signals can be found here: 
Market Structure Patterns
Samuel Manoel De Souza
4.47 (19)
Available for   MT4   and   MT5 . Join the Market Structure Patterns channel to download materials available for study and/or additional informations. Related posts: Market Structure Patterns - Introdução Market Structure Patterns   is an indicator based on   smart money concepts   that displays   SMC/ICT   elements that can take your trading decisions to the next level. Take advantage of the   alerts ,   push notifications   and   email messages   to keep informed from when an element is form
Quantum Trend Sniper
Bogdan Ion Puscasu
4.74 (53)
Introducing   Quantum Trend Sniper Indicator , the groundbreaking MQL5 Indicator that's transforming the way you identify and trade trend reversals! Developed by a team of experienced traders with trading experience of over 13 years,   Quantum Trend Sniper Indicator   is designed to propel your trading journey to new heights with its innovative way of identifying trend reversals with extremely high accuracy. ***Buy Quantum Trend Sniper Indicator and you could get Quantum Breakout Indicator for
Trend Forecaster
Alexey Minkov
5 (7)
The Trend Forecaster indicator utilizes a unique proprietary algorithm to determine entry points for a breakout trading strategy. The indicator identifies price clusters, analyzes price movement near levels, and provides a signal when the price breaks through a level. The Trend Forecaster indicator is suitable for all financial assets, including currencies (Forex), metals, stocks, indices, and cryptocurrencies. You can also adjust the indicator to work on any time frames, although it is recommen
ARIScalping
Temirlan Kdyrkhan
ARIScalp is a powerful trading companion designed to generate high-probability entry signals with dynamic TP/SL/DP levels based on volatility. Built-in performance tracking shows win/loss stats, PP1/PP2 hits, and success rates all updated live. Key Features: Buy/Sell signals with adaptive volatility bands Real-time TP/SL/DP levels based on ATR Built-in MA Filter with optional ATR/StdDev volatility Performance stats panel (Success, Profit/Loss, PP1/PP2) Alerts via popup, sound, push, or email Cus
Best Solution for any Newbie or Expert Trader! This Indicator is a unique, high quality and affordable trading tool because we have incorporated a number of proprietary features and a new formula. With only ONE chart you can read Currency Strength for 28 Forex pairs! Imagine how your trading will improve because you are able to pinpoint the exact trigger point of a new trend or scalping opportunity? User manual:   click here That's the first one, the original! Don't buy a worthless wannabe clone
Was: $249  Now: $99   Market Profile defines a number of day types that can help the trader to determine market behaviour. A key feature is the Value Area, representing the range of price action where 70% of trading took place. Understanding the Value Area can give traders valuable insight into market direction and establish the higher odds trade. It is an excellent addition to any system you may be using. Inspired by Jim Dalton’s book “Mind Over Markets”, this indicator is designed to suit the
Blahtech Supply Demand MT5
Blahtech Limited
4.54 (13)
Was: $299  Now: $99  Supply Demand uses previous price action to identify potential imbalances between buyers and sellers. The key is to identify the better odds zones, not just the untouched ones. Blahtech Supply Demand indicator delivers functionality previously unavailable on any trading platform. This 4-in-1 indicator not only highlights the higher probability zones using a multi-criteria strength engine, but also combines it with multi-timeframe trend analysis, previously confirmed swings a
Shock Pullback
Suleiman Alhawamdah
5 (1)
Shock Pullback v 3.5 + AI/ML forecasts: - Add Integrated Artificial and deep learning have been integrated within the MQL5 environment. - A qualitative addition for integrated future forecasts using deep learning and artificial intelligence (AI/ML) within MQL5, based on the methodology and operation of the core indicator built on the Shock Pullback and its inherent integrated functions. - Suitable for scalping trading  How to Use the Indicator  Shock Pullback: There are 3 images in the com
Volume Profile Pro Signals  Precision volume analysis meets automatic signal generation. What It Does Volume Profile Pro Signals builds a live, data-driven picture of where trading volume truly occurs — exposing market zones where price is accepted or rejected. It highlights POC, VAH, VAL, and identifies HVN/LVN areas with exact accuracy. From that foundation, it generates real-time breakout signals (VAH/VAL) and plots smart SL/TP levels from ATR volatility data. Every component — from profile
MACD Intraday Trend PRO is an Indicator developed through an adaptation made of the original MACD created by Gerald Appel in the 1960s. Through years of trading it was observed that by changing the parameters of the MACD with Fibonacci proportions we achieve a better presentation of the continuity of the trend movements, making that it is possible to more efficiently detect the beginning and end of a price trend. Due to its efficiency in detecting price trends, it is also possible to identify ve
Matrix Arrow Indicator MT5
Juvenille Emperor Limited
5 (17)
Matrix Arrow Indicator MT5  is a unique 10 in 1 trend following   100% non-repainting  multi-timeframe indicator that can be used on all symbols/instruments:   forex,   commodities,   cryptocurrencies,   indices,   stocks .  Matrix Arrow Indicator MT5  will determine the current trend at its early stages, gathering information and data from up to 10 standard indicators, which are: Average Directional Movement Index (ADX) Commodity Channel Index (CCI) Classic Heiken Ashi candles Moving Average
TPSpro RFI Levels MT5
Roman Podpora
4.5 (18)
INSTRUCTIONS RUS   /   INSTRUCTIONS   ENG    -     Version MT4 Main functions: Displays active zones of sellers and buyers! The indicator displays all the correct first impulse levels/zones for purchases and sales. When these levels/zones are activated, where the search for entry points begins, the levels change color and are filled with certain colors. Arrows also appear for a more intuitive perception of the situation. LOGIC AI - Display of zones (circles) for searching entry points when acti
AriX
Temirlan Kdyrkhan
1 (4)
AriX Indicator for MT5 A powerful trend-following and signal-evaluation tool AriX is a custom MT5 indicator that combines Moving Averages and ATR-based risk/reward logic to generate clear buy/sell signals. It visualizes dynamic SL/TP levels, evaluates past trade outcomes, and displays win/loss statistics in a clean on-chart panel. Key features include: Buy/Sell signals based on MA crossovers ATR-based SL/TP1/TP2/TP3 levels with visual lines and labels Signal outcome tracking with real-time stat
Step into the world of Forex trading with confidence, clarity, and precision using Gold Indicator a next-generation tool engineered to take your trading performance to the next level. Whether you’re a seasoned professional or just beginning your journey in the currency markets, Gold Indicator equips you with powerful insights and help you trade smarter, not harder. Built on the proven synergy of three advanced indicators, Gold Indicator focuses exclusively on medium and long-term trends elimina
Ultimate Supply Demand MT5
Ramon Sobrevals Arce
5 (4)
After working during many months, with the help of Neural Networks, we have perfected the ultimate tool you are going to need for identifying key price levels (Supports and Resistances) and Supply and Demand zones. Perfectly suitable to trigger your trades, set up your future actions, decide your Take Profit and Stop Loss levels, and confirm the market direction. Price will always move between those levels, bouncing or breaking; from one zone to another, all the remaining movements are just mark
More from author
Gatilho Swing
Everton Fernando Da Silva Messias
Swing Trigger - Intelligent Swing Trading Solution Swing Trigger revolutionizes H1 timeframe analysis by providing professional-grade visualization tools for discerning traders. This sophisticated MetaTrader 5 indicator identifies high-probability reversal zones through advanced price action interpretation, delivering clear visual cues without chart clutter. The system automatically plots strategic rectangles around significant price ranges while maintaining critical reference levels from previ
Digital Clock Real Time Display
Everton Fernando Da Silva Messias
General Description The Digital Clock is an indicator developed by Everton Messias that displays a real-time digital clock directly on the MetaTrader 5 chart. This indicator is perfect for traders who need to keep track of time during trading sessions without leaving the platform. Main Features: Real-time display (hours:minutes:seconds) Fully customizable (colors, font, size) Flexible positioning anywhere on the chart Automatic update every second Compatible with all timeframes
FREE
ChartExpert Buy vs Sell Power Visualizer
Everton Fernando Da Silva Messias
Buy vs Sell Power Strength Visualizer   Description: The Buy vs Sell Power Strength Visualizer is an exclusive MetaTrader 5 indicator that transforms market strength analysis into an intuitive visual experience. It plots   Buy Power   and   Sell Power   indicators and colors the chart background based on which force is dominant: Green → Buy Power dominant (buying pressure) Red → Sell Power dominant (selling pressure) Black → Balance between forces Perfect for traders who want to quic
BullBea Display
Everton Fernando Da Silva Messias
BullBea Display – Pro Version Discover a professional tool designed for traders who value precision and speed in analysis. BullBea Display instantly shows the real strength of buyers (Bulls) and sellers (Bears) directly on the chart, allowing you to clearly see who controls the market at any given moment—without unnecessary signals. A minimalist design, clear metrics, and full compatibility with MetaTrader — all without changing the appearance of your chart. Now you always know where the stren
Buy vs Sell Power Strength Visualizer   Description: The Buy vs Sell Power Strength Visualizer is an exclusive MetaTrader 5 indicator that transforms market strength analysis into an intuitive visual experience. It plots   Buy Power   and   Sell Power   indicators and colors the chart background based on which force is dominant: Green → Buy Power dominant (buying pressure) Red → Sell Power dominant (selling pressure) Black → Balance between forces Perfect for traders who want to quic
DailyFirstHourLines
Everton Fernando Da Silva Messias
Daily First Hour Lines - Indicator for MetaTrader 5 Description The   Daily First Hour Lines   is an innovative technical indicator for MetaTrader 5 that automatically plots support and resistance levels based on the first 1-hour candle of each trading session. Developed for traders operating in financial markets, this indicator provides crucial visual references to identify potential reversal points and trend continuation. Main Features First H1 Candle Lines : Plots dotted lines at the high and
PriceActionCore
Everton Fernando Da Silva Messias
PriceActionCore (MT5) – Pure Price Action Indicator Version: 1.50 Platform: MetaTrader 5 Remember to enable the description view on the platform! Pure Price Action Profile Clean charts, only candles (no indicators). Horizontal lines: support, resistance, daily close, previous day's high and low. Used by traders who trade pullbacks, breakouts, and reversals. Very efficient for those who trust their eyes more than indicators. Description PriceActionCore is a visual indicator for traders
First Order Block of the Day
Everton Fernando Da Silva Messias
Indicator First Order Block of the Day - Value Area Identification Description The   First Order Block of the Day   indicator is an essential tool for traders who operate based on the concept of order blocks and market profile analysis. This indicator automatically identifies the first order block formed in the first hour of trading each day, an area of extreme importance for strategic decision-making. Main Features Automatic Identification : Automatically draws the rectangle of the day's first
DailyChange
Everton Fernando Da Silva Messias
Daily Change Indicator - Real-Time Market Variation Display Overview Daily Change Indicator is a professional trading tool designed for MetaTrader 5 that provides real-time monitoring of daily price variations directly on your chart. This lightweight yet powerful indicator displays the current day's price change in both absolute points and percentage terms, positioned conveniently next to the Bid price line for immediate market assessment. Key Features Real-Time Daily Variation : Tracks and disp
First Block
Everton Fernando Da Silva Messias
Description The   First Order Block of the Day   indicator is an essential tool for traders who operate based on the concept of order blocks and market profile analysis. This indicator automatically identifies the first order block formed in the first hour of trading each day, an area of extreme importance for strategic decision-making. Main Features Automatic Identification : Automatically draws the rectangle of the day's first order block based on the 1h candle. Reference Lines : Adds the pre
BlocoSwingBR
Everton Fernando Da Silva Messias
BlocoSwingBR - Advanced Graphical Analysis Indicator Introducing BlocoSwingBR, a professional technical indicator for MetaTrader 5 that provides a comprehensive view of market structure through multiple integrated graphical tools. Main Features: •   Dynamic Rectangles:   Automatically draws rectangles representing the range of each candle on the selected timeframe, enabling quick visualization of trading areas. •   Fixed Daily Rectangles:   Creates fixed rectangles based on the daily high and lo
BlockOscilationDay
Everton Fernando Da Silva Messias
BlockOscilationDay - Professional Market Analysis Tool The BlockOscilationDay is a sophisticated technical indicator that provides clear and elegant visualization of market movements. Developed for traders who value simplicity and efficiency, this indicator combines multiple layers of information within a clean and intuitive interface. Its minimalist design philosophy ensures that essential market data is presented without cluttering your chart, enabling faster and more precise trading decisio
BlockLongTimeFlexible
Everton Fernando Da Silva Messias
BlockLongTimeFlexible - Time Blocks Visualizer Master Market Time Analysis BlockLongTimeFlexible is the ultimate tool for traders and analysts who need to visualize and analyze time periods professionally and intuitively. Create customizable visual rectangles that highlight cycles, seasonalities, and temporal patterns directly on your chart. Simple Manual for BlockLongTimeFlexible Indicator What This Indicator Does Creates   colored rectangles   on the chart to mark specific time per
EssentialLines
Everton Fernando Da Silva Messias
EssentialLines Indicator v3.00 – Manual (English) EssentialLines v3.00 is a MetaTrader 5 indicator that automatically draws previous-day levels: High, Low, Open, Close and Mid Range. Each line has individual control for visibility, color, style and width. 1. Installation Copy the file to: MT5/MQL5/Indicators Restart MT5 Add the indicator to the chart 2. Settings Visibility High, Low, Open, Close, Mid Range Enable only the levels you need. Individual Parameters Each line allows adjustment of: •
PriceMovementMapper
Everton Fernando Da Silva Messias
PriceMovementMapper   revolutionizes technical analysis with its unique visual approach to price action. This innovative MT5 indicator creates dynamic blocks that map daily opening/closing ranges with intelligent vertical lines showing price extremes. Unlike conventional tools, it provides crystal-clear visualization of market structure, trend strength, and key support/resistance levels through intuitive color-coded rectangles and connecting lines. Each trading day is represented as a distinct b
Filter:
No reviews
Reply to review