Watch the Market tutorial videos on YouTube
How to buy а trading robot or an indicator
Run your EA on
virtual hosting
virtual hosting
Test аn indicator/trading robot before buying
Want to earn in the Market?
How to present a product for a sell-through
Technical Indicators for MetaTrader 5 - 111
ZeroLag TrendCandle — Real-time Candle Coloring & Alerts System (No Repaint)
ZeroLag TrendCandle is a real-time trend detection tool that applies non-repainting candle coloring based on an advanced Williams Percent Range (WPR) analysis. It highlights trend shifts, momentum changes, and potential reversals through a dynamic color-coded system— allowing traders to instantly understand current market direction with a clean, intuitive chart, as shown in the images. At a glance, you can clearly ide

Let's follow the trend with Goby trailing! According to your filters, you can use the arrows (Bullish [start] and Bearish [start]) as entry signals. After making an entry [position], you can use the Bullish [trailing] as a trailing stop for bullish positions and Bearish [trailing] as a trailing for bearish positions. Through the inputs, you can adjust the indicator for better performance in the assets you operate! Enjoy...
Discover the Power of Fibonacci Extension for Smarter Trading
Unlock the potential of your trading strategy with the Fibonacci Extension tool, a dynamic addition to your technical analysis arsenal. Designed to pinpoint critical market levels, this indicator leverages the time-tested Fibonacci sequence to map out key support and resistance zones. By extending the 23.6%, 38.2%, 50%, 61.8%, and 100% Fibonacci ratios from significant swing highs or lows, it offers clear, actionable insights for tra

TRADE ASSISTANT PRO – Your Ultimate Manual Trading Companion TRADE ASSISTANT PRO is a powerful all-in-one trading utility designed for manual traders who value precision, control, and efficiency. Whether you’re a scalper, day trader, or swing trader, this tool gives you everything you need at your fingertips to make faster, smarter trading decisions. Key Features: Multi-Timeframe & Multi-Symbol Display
Monitor multiple pairs and timeframes from a single chart. Get real-time info across
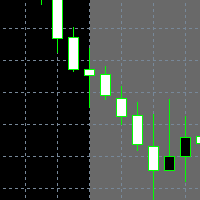
Ein schöner, einfacher KillZone-Indikator. Er bietet die Möglichkeit, die Farben der Zonen, der Rahmen und der Schrift zu ändern. Auch die Zeiten der einzelnen Zonen können angepasst werden
Er gibt auch die Pufferwerte der der Kerzen zurück, um von einem EA aus darauf zuzugreifen
Wenn Sie einige Änderungen oder zusätzliche Puffer benötigen -> senden Sie mir eine Nachricht
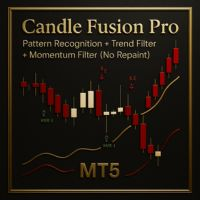
Candle Fusion Pro — Pattern Recognition + Trend Filter + Momentum Filter (No Repaint) Detect powerful candlestick formations and confirm their strength with live trend and momentum analysis. Candle Fusion Pro is the ultimate visual tool for traders who rely on price action precision , trend structure, and multi-layered confirmation .
Core Features
Pattern-Based Entry : Detects over 10+ advanced Japanese patterns , including: Shooting Stars (levels 2, 3, 4) Bullish/Bearish Engulfings Morning/Ev
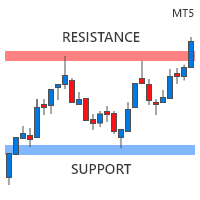
Supports and Resistances is a quick and easy tool for finding support and resistance levels. It was created according to the "run and forget" idea to automate daily routines and speed up the decision-making process. It is a great tool for beginners, as well as for users who have been on the market for a while.
How to run it? To run the indicator, all you have to do is set three parameters: 1. Number of candles to be analyzed by the program;
2. Maximum zone width in pips;
3. Frequency of

ClearView Trend Finder — Can You See How Clear It Is? Have you ever felt like your chart is full of noise? Too many indicators, crossed signals, and lines that only complicate the analysis?
ClearView Trend Finder completely eliminates that visual clutter and lets you focus on the only thing that really matters: the clear trend .
This system transforms the chart into a clean, precise view that never repaints or changes. Each candle is filtered to show only the dominant market direction. These a

Trend Pulse Apex — Pattern Recognition + Trend Filter + Momentum Filter (No Repaint) Trend Pulse Apex pinpoints high-probability candlestick formations and confirms them with live trend and momentum checks. By plotting immutable arrows and clear labels only on closed bars, the indicator delivers precise visual cues without repainting or lag. Core Features
• Pattern Detection: Identifies over ten advanced Japanese trades—including Shooting Stars, Engulfings, Stars, Dojis, Hammers, Piercing Line

Easy! Before opening a trade, the indicator calculates your position size. Just drag one line to your stop level.
A one-line position size calculator based on a percentage of your total account balance. Just drag the SL line below or above your stop level to instantly see the lot size. The information updates automatically as the price changes. Works with Forex, stocks, crypto, and metals.
Enjoy!
How to Use : Attach to the chart Drag the indicator onto your chart. Draw a Stop-Loss Line:
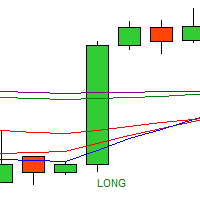
Quad EMA Cross Indicator
- Capture powerful trend changes with precision! - This indicator tracks four EMAs (20, 50, 100, 200) and signals strong LONG/SHORT entries when price crosses all four simultaneously. - Clear visual labels make spotting high-probability trades a breeze. - Perfect for any timeframe or market. - Boost your trading with reliable, filtered signals!

"The Chess Strategy Applied to Forex Trading" Imagine the market as a chessboard. Each technical indicator is a unique and powerful piece, with its own distinct function. This intelligent system combines six key "pieces" that work in harmony to detect high-probability entry signals: Pawn (EMA 50): Your nimble scout, detecting rapid changes in the short-term trend. Rook (EMA 200): A steadfast fortress, confirming the overarching major market trend. Knight (Bollinger Bands): Agile and unpredictab
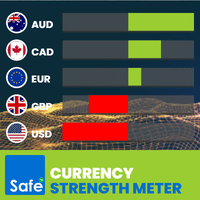
What Is the Currency Strength Meter? The Currency Strength Meter is an advanced yet easy-to-use indicator that measures the relative strength of 8 major currencies by analyzing their real-time performance across 28 currency pairs .
It visually ranks currencies from strongest to weakest, helping you: Spot high-probability trading opportunities
Match strong currencies against weak ones
Trade with confidence and precision
With just a glance at the dashboard, you'll know which currencies to trade –
Flash Candle – Real-Time Candle Coloring & Alerts System (No Repaint) Flash Candle evaluates the Williams Percent Range on the most recently closed bar (bar 1) and assigns a definitive color to that candle. The current bar (bar 0) displays a provisional hue until close, ensuring signals are based exclusively on completed data. Non-Repainting Flash Candle is engineered to eliminate any repaint, backpainting or visual alteration. Signals are confirmed only on bar 1—the live bar (bar 0) uses a temp
Buy 1 get 1 free
how each of these input fields is used and what happens on your chart when you adjust their values: Custom text for comment : How to use : Type any text you want into the "Value" field. Result : The text you type will appear in the top-left corner of the chart window (known as the Chart Comment). You might use this for the indicator's name, version, or your own short notes. Lookback period for regression calculation : How to use : Enter an integer (e.g., 100, 200, 300). Result

DominoSync DoubleSix: An Advanced Indicator for Confident Trading DominoSync DoubleSix is an advanced indicator that helps traders identify more reliable entry signals by analyzing multiple timeframes and filtering out low-volume or unusual range candles. The entry signals are displayed on the indicator's histogram, allowing for a clearer, less intrusive analysis on the price chart. What Makes DominoSync DoubleSix Unique? Multi-Timeframe Analysis Evaluates up to 20 timeframes (from M1 to W1). Ca
ISR Spike Crash 500 - This is one of my best Indicators from the "Spike Detector" series, which predicts a Spike with a high probability in a few minutes or even one minute.
The indicator gives Signal before one Spike appears, which gives you the opportunity to scalp , and it also has additional Signals predicting a long-term trend reversal. The indicator has 5 different ( conditions ) signals in the form of arrows of different colors.
Working: Timeframe - M1 Signals: Non-Repainting !!!

RangeDashboard – Multi-symbol Daily, Weekly, and Monthly Range Overview with Alerts RangeDashboard is a powerful and user-friendly indicator that displays the current range (high-low) of selected currency pairs or instruments over a chosen timeframe (D1, W1, MN1) directly on the chart. It allows you to input a customizable list of symbols, add suffixes if needed, and select the timeframe from which the ranges are calculated. Key Features: Dynamic calculation of ranges for any number of symbols o
ARIMA Forecast Indicator Price Forecasting with ARIMA Model Key Features
Accurate price prediction – Uses ARIMA (AutoRegressive Integrated Moving Average) model to forecast future price movements.
Flexible customization – Adjustable p , d , q parameters for optimal model performance.
Supports all markets – Works with Forex, stocks, commodities (gold, oil), and cryptocurrencies.
Any timeframe – Effective on M1, H1, D1 and higher.
Perfect complement – Pa
Core Concept: SmartSwing Filter is an advanced indicator designed to identify Swing Highs and Swing Lows with higher accuracy than traditional fractal-based methods. Unlike the basic fractal approach—which simply checks whether a candlestick is higher or lower than its neighbors—SmartSwing Filter intelligently filters out weak or insignificant swings that may generate false signals or noise. It does this by incorporating dynamic ATR (Average True Range) filtering that adjusts based on real-ti

Quantum Channel Indicator
Logic
The Quantum Channel calculates upper and lower boundaries based on the highest high and lowest low over a fixed lookback period. It fills the area between these levels as a shaded channel, updating only when a bar closes. This approach ensures that traders see clear price extremes without lagging distortion.
Signals
Buy and sell signals appear as arrows when price touches the lower or upper channel boundary, respectively. A green arrow at the lower line indic

ISR Spike Crash 1000 - This is one of my best Indicators from the "Spike Detector" series, which predicts a Spike with a high probability in a few minutes or even one minute.
The indicator gives Signal before one Spike appears, which gives you the opportunity to scalp , and it also has additional Signals predicting a long-term trend reversal. The indicator has 3 different ( conditions ) signals in the form of arrows of different colors.
Working: Timeframe - M1 Signals: No

QuantumTrend Filter: Your Multi-Factor Trend Confirmation Tool Unlock clearer trend insights with the QuantumTrend Filter! This powerful MetaTrader 5 indicator is meticulously designed to help traders identify and confirm market trends by synthesizing data from a robust suite of proven technical indicators. Stop guessing and start making more informed trading decisions. How It Works The QuantumTrend Filter operates by analyzing multiple streams of market data simultaneously. It integrates signal

"Smart Trend and Smart Oscillator" are two indicators in one.
Smart trend shows the current trend direction. Using the settings, you can make sure that, for example, on the M15 timeframe, the trend direction is shown from the H1 or D1 timeframe, and so on.
The smart oscillator shows overbought and oversold zones. This indicator consists of several oscillators that show the best result. The readings for all indicators are summed up and the average value zone is painted over in the selected col
Pivot SR Indicator - Powerful Technical Analysis Tool
Pivot SR is a professional indicator designed to identify key support and resistance levels in the market with high precision. This indicator offers:
Key Features : - 5 Pivot Point Calculation Methods (Classic, Camarilla, Demark, Fibonacci, Woodie) - Automatic calculation of support and resistance levels - Clean and easy-to-read visuals - Full customization of colors, styles, and appearance
️ Flexible Settings : - Choice of timefram

AutoStructure — Your Key to Precise Market Entry in Forex! AutoStructure is a professional Forex indicator designed for traders who value precision, speed, and full control over the market.
With just one click, you'll be able to:
Automatically draw key support and resistance levels Visualize FVG zones (Fair Value Gaps) to spot profitable reversals Analyze Order Blocks across multiple timeframes Build Fibonacci levels based on real price action Perfectly suited for both scalpers and position t
Clarity Pulse Detector
Clarity Pulse Detector analyzes closed bars and accompanying volume bars to identify genuine trend reversals without relying on future data. The indicator calculates pulse strength based on configurable SSP (Signal Strength Parameter) settings and compares recent highs and lows to detect breakout points.
Once the required conditions are met on a closed bar, the tool plots a clear buy or sell marker on that bar. All computations occur on confirmed bars, ensuring no false
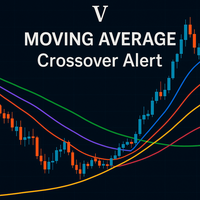
Pro MA 5 – The Professional Moving Average Suite The Most Complete Moving Average System for MetaTrader 5 Pro MA 5 revolutionizes technical analysis by offering a powerful, customizable, and efficient interface to detect trends with surgical precision . What is Pro MA 5? It's an advanced indicator that integrates up to 5 configurable moving averages with intelligent alerts , an interactive panel , and an optimized design for trading on any instrument or timeframe. It's an all-in-one solution
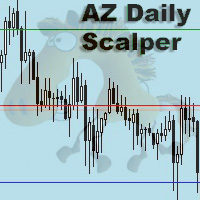
AZ daily scalper
Mini indicator that draws possible correction levels based on the previous day. Then you go to a lower timeframe and look for entry patterns. In the settings, you can select the day on which you want to get these levels (by default, it calculates from the previous day). You can set the colors of the levels, the type of lines, the background color of the candle from which the calculation occurs

Smart Money Pro Indicator - Institutional-Grade Trading Signals Smart Money Pro Indicator - Institutional-Grade Trading Signals Unlock the power of Smart Money Concepts (SMC) with this professional MT4/MT5 indicator, designed to give you high-probability entries like the banks and institutions. Whether you trade forex, stocks, or crypto, this tool reveals key zones, imbalances, and reversals—helping you trade smarter, not harder. Why Choose Smart Money Pro? Smart Money Concepts (SMC) Integration
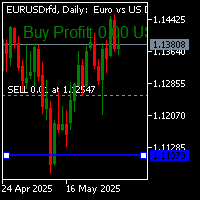
The specified indicator is one of the versions of the indicator displaying profit (loss) on the current symbol. You can easily move the level with the mouse, determining the total profit or loss. The features of this indicator are: 1. that the profit or loss will not be displayed near the line, in the place where the trade is taking place, but in the upper-left corner of the screen, which means that calculating the loss or profit will not interfere with your trading. 2. The indicator will automa

Indicador de Força da Moeda para MetaTrader 5 Este indicador analisa a força relativa das principais moedas forex, fornecendo uma representação visual clara de quais moedas estão ganhando ou perdendo força em comparação com outras. Ele avalia os principais pares de moedas (EUR, USD, GBP, JPY, AUD, NZD, CAD, CHF) e calcula a força usando métodos como RSI ou ROC, dependendo da configuração selecionada. Os resultados são exibidos como linhas separadas para cada moeda, facilitando a identificação de
Pip Blaze Signal
Pip Blaze Signal is a price-action–based indicator engineered to deliver clear buy and sell alerts without repainting or backpainting. It continuously scans closed bars, comparing recent highs and lows to predefined thresholds. When price breaks a calculated level at candle close, the indicator plots a discrete dot, ensuring each historical signal remains fixed once a bar has closed. Traders receive unambiguous entry cues while preserving chart integrity during live sessions an
Swing Trend Line Pro (MT5) – Dynamic Trend, Fractal Detection, & Break-out Notification Tool
Ready to acquire a sharp perspective on your trading? Tone down the Noise.
Swing Trend Line Pro eliminates guess-work via illustrating accurate validated trend lines.
Soft-ware logic Define true and real time fractal-swing trend lines to illustrate the elaborated trend of a symbol. Position simple, crisp, and dynamic trend lines, so you visualize trend structure. Out-line the sl

Enter trades with precise candle timing.
Avoid late entries and missed candle closes.
Designed for traders who need exact execution timing. Candle Timer Pro is a lightweight on-chart tool that displays the remaining time of the current candle, a horizontal progress bar, and real-time spread information. The panel is fully customizable and works with any symbol and timeframe, helping traders maintain timing discipline and execution accuracy. Developed to remain clear and unobtrusive, the indicato

ZonesPro – Advanced Supply Demand / Support Resistance Indicator for MT5 ZonesPro is a smart and powerful indicator designed to automatically detect supply and demand zones (also interpreted as support and resistance) directly on your MT5 chart. It uses Fractals to identify key market turning points and filters out weak or broken zones to keep your chart clean and focused on only the strongest levels.
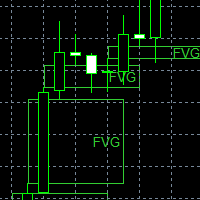
Ein schöner, einfacher farbiger FVG-Indikator. Er bietet die Möglichkeit, die Farben der FVG, der Rahmen und der Schrift zu ändern. Auch die Länge der einzelnen FVG können angepasst werden
Er gibt auch die Pufferwerte der der Kerzen zurück, um von einem EA aus darauf zuzugreifen
Wenn Sie einige Änderungen oder zusätzliche Puffer benötigen -> senden Sie mir eine Nachricht

Vision 2.0— L’outil ultime pour trader en toute confiance Vision est un indicateur complet et intuitif qui combine précision, sécurité et simplicité.
Il a été conçu pour les traders qui veulent :
Identifier rapidement les opportunités les plus claires
Protéger leur capital avec une gestion intégrée du risque
Trader en toute confiance grâce à une interface épurée Ce que Vision vous apporte Signaux clairs et sans ambiguïté Flèches visibles directement sur le graphique Entrées et so

NEWS ON CHART EASY – Instantly See Market News Directly on Your Chart! Take your trading to the next level with NEWS ON CHART EASY – the indicator that brings real-time economic news and events right onto your trading chart. No more switching between websites or missing important announcements. With NEWS ON CHART EASY, you’ll always know what’s moving the market, exactly when and where it matters. Key Features: Live News Display: Instantly see upcoming and past economic news events directly on

L’indicateur Double Moving Average est un outil simple, efficace et personnalisable pour identifier les changements de tendance en un coup d’œil. Il combine deux moyennes mobiles paramétrables (rapide et lente) pour générer des signaux de croisement puissants, souvent utilisés dans des stratégies de suivi de tendance ou de scalping.
Que vous soyez débutant ou trader confirmé, cet indicateur vous aide à :
Détecter les points d’entrée et de sortie optimaux. Suivre les phases de tendance haussiè
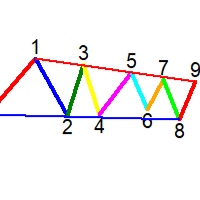
ZigZag 100% Manual PRO
Full control over your technical analysis.
Draw 100% manual zigzags, mark Support/Resistance (SR) zones and Elliott Waves using numbers only. 2-color or 8-color mode
Customizable lines and numbers (color, thickness, size)
Numbers only – no letters
Built-in chart buttons: START: Begin a new trace STOP: Save your current work CLEAR: Delete everything SHOW SR / HIDE SR: Toggle SR lines visibility Clean, accurate and structured analysis for visual traders

Efficient Distance Pro: Navigate Trends with Dynamic, Self-Adjusting Channels Stop guessing with static moving averages that lag in fast markets and fail in choppy conditions. Efficient Distance Pro is an advanced, non-repainting channel indicator designed to give you a clearer view of market dynamics. It adapts to volatility in real-time, creating a dynamic channel around a uniquely calculated baseline to help you identify high-probability entry and exit points with greater confidence. How It W
The "LotSizer Mouse" indicator is your key to accurate and safe Forex trading!
Tired of rough lot calculations? Do you want to trade with strict risk control? Then this indicator is created just for you!
What is it? This is an indicator for the MetaTrader 5, which instantly calculates the working lot for your trade, based on the visual determination of the stop loss through the crosshair. Just click the crosshair function, select an entry point on the chart and drag the crosshair to the stop
Magic Price Action – Advanced Candlestick Pattern Recognition by Mr Green76
Elevate your price action trading with Magic Price Action , an advanced MetaTrader 4 indicator that streamlines candlestick analysis through automated detection, deep customization, and an intuitive on-chart control panel. Stop manually scanning charts—let Magic Price Action do the heavy lifting with precise, real-time identification of key candlestick patterns based on your personal strategy. Key Features Intell

PaintPatternCandle - The Most Advanced Candlestick Pattern Indicator on the Market Detailed Description (300+ Lines) What is PaintPatternCandle? PaintPatternCandle is a revolutionary indicator for MetaTrader 5 that automatically identifies and colors 13 candlestick patterns in real time. Developed by ETHERNAL, it transforms your technical analysis into an intuitive visual process, highlighting buy and sell opportunities with vibrant colors.
Unique Features 13 Recognized Patterns:
E

ISIS Indicator - The Power of Moving Average Crossovers for Accurate Trading ISIS Indicator Overview ISIS is an advanced technical indicator for MetaTrader 5, designed to identify accurate buy (BUY) and sell (SELL) signals based on the crossover of two configurable moving averages. It is designed to be used in conjunction with the OSIRIS robot, but can also be applied manually by traders looking for trend-based strategies.
With a smart combination of a fast moving average (Fast MA) and a sl

Session Time Pro 2.0 — Indicator for MetaTrader 5 General Description Session Time Pro 2.0 is an indicator designed for traders who want to analyze market sessions efficiently. It provides an advanced visualization of trading hours, price ranges, and projections, helping traders identify price behavior patterns throughout the day. With flexible customization options, the indicator highlights specific sessions on the chart using lines, areas, or colored candles. User Manual Main Parameters DrawCa

1. CONSTITUTION Shoot [Point] is momentum indicator composed of one oscillator and three floating levels [upper, middler, lower]. The oscillator crosses the floating levels forming Shoot Points! The inputs can be used to adjust the oscillator, the floating levels and the alert signals. It is designed only for the MT5 platform. 2. OPERATION As entry signal: When combined with a trend filter [preferably the Currency Strength Meter], it provides very good entry points. bullish entry signal: oscill

Automated Anchored Volume Weighted Average Price You set a period, and the indicator will find the highest and lowest price point in the period and derive a AVWAP from there. It also prints out a median line. You can use the generated VWAP lines as a channel, as S/R levels or as a volatility indicator. It's based on tick volume to be compatible with most CFD brokers.
Happy trading!

LSCB Gold: Liquidity Sweep & Consolidation Breakout Indicator The LSCB Gold (Liquidity Sweep & Consolidation Breakout) is a specialized technical indicator designed for scalping on the XAUUSD (Gold) pair. Its core strategy is to identify high-probability trading setups by detecting when liquidity is swept from the market after a period of low-volatility consolidation. It provides clear, non-repainting buy and sell signals directly on your chart, complete with suggested Stop Loss (SL) and Take Pr
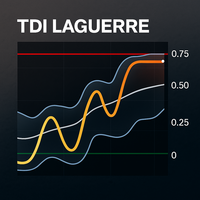
TDI Laguerre The TDI Laguerre is an evolution of the popular Traders Dynamic Index (TDI) indicator. It replaces the classic RSI with a Laguerre filter , offering a smoother, more sensitive, and precise reading of price action. This advanced version combines elements of volatility, moving averages, and visual signal detection with configurable alerts. What Does This Indicator Do? This indicator displays: A smoothed Laguerre line based on the closing price. A short-term EMA signal line overlaid

Un indicatore avanzato che identifica in automatico le zone chiave di supporto e resistenza su tre timeframe diversi , mostrandole con rettangoli colorati direttamente sul grafico. Ogni zona viene estesa in avanti, etichettata e aggiornata dinamicamente con il movimento del prezzo. Caratteristiche principali 3 Timeframe configurabili (es. M15, H1, H4) Zone di resistenza e supporto calcolate automaticamente Colori personalizzabili per ciascun timeframe Etichette automatiche con indicazi

VolaTrend - Smart Volatility Trend Analyzer Transform your trading with instant market condition recognition - know whether to trend trade or range trade at a single glance! What Makes VolaTrend Different? Tired of cluttered charts with multiple indicators? VolaTrend revolutionizes market analysis by combining three powerful volatility indicators into ONE intelligent system that gives you instant market clarity through a single, customizable button. No more guessing. No more chart clutter. Ju
ATR Momentum Dashboard - Professional Currency Volatility Analyzer Transform Your Trading with Real-Time Currency Strength Analysis The ATR Momentum Dashboard is a cutting-edge indicator that provides instant visibility into currency volatility across all major forex pairs. Built for professional traders who demand precision and clarity in their market analysis. Key Features Real-Time Currency Ranking : Automatically ranks all 8 major currencies (USD, EUR, GBP, JPY, AUD, CAD, CHF, NZD) by

Technical indicator that uses Jean Meeus astronomical algorithm to display lunar phases on trading charts. Features a continuous curved line representing the lunar cycle with scientific precision equivalent to professional observatories. Compatible with any symbol and timeframe on MT5, including forex, commodities, indices, and stocks. Includes informative panel showing current lunar phase, illumination percentage, and reference levels for technical analysis. Fully customizable color and style

## Overview
The Advanced Key Levels Predictor EA is a sophisticated Expert Advisor for MetaTrader 5 that combines advanced technical analysis with predictive algorithms to identify key market levels and forecast future price movements. This EA provides comprehensive charting capabilities with clear visual indicators to help traders make informed trading decisions.
## Key Features
### Key Level Detection - **Support & Resistance Levels**: Automatically detects significant support and resis
Title: Hourly Sweep Zone Indicator by Daniel Butogwa Description: "Market makers move in silence. But their footprints scream in price. This indicator exposes them." The Hourly Sweep Zone Indicator by Daniel Butogwa is a sniper-grade institutional trading tool designed to identify and visualize liquidity zones , hourly price extremes , and smart money footprints on the chart — live and historically. It automatically draws hourly high/low sweep zones using clean, minimal rectangles that high

PLEASE REVIEW THE ATTACHED IMAGE CAREFULLY BEFORE READING FURTHER
This indicator is developed based on the theory of NADARAYA-WATSON KERNEL REGRESSION ENVELOPES combined with RSI PRICE MOMENTUM DYNAMICS . It also incorporates concepts of LIQUIDITY ANALYSIS , offering a robust and adaptive tool for serious traders seeking to understand market structure and optimize entry and exit precision. If you purchase this indicator, please contact me via email and attach a screenshot of your payment recei

Live Signal: Click One
Have you ever wondered why most systems are not effective in live trading? My answer is that it's all the fault of the so-called "Smart Money" or the institutional ones,, they constantly create spikes first up then down and vice versa to screw all the retail investors by tearing away their capital, confusing them and making the markets move randomly without any rules. But in all this there is a famous strategy, which in 2009 won the world championship, exploiting and r
Professional Gold Trading Levels Indicator
Features: - Daily & Weekly Pivot Points - Fibonacci Retracement Levels - Round Number Levels - Customizable Colors & Fonts - Auto-Update Daily - Clean & Simple Interface
Perfect for Gold (XAUUSD) traders Reliable Support/Resistance levels Lightweight & Fast Performance Easy to install and use
Compatible with all MT5 accounts. No complex settings required! SimpleGoldLevels v1.0 - User Manual Professional Support & Resistance Levels

CDS Fractal Blade Session - AIO A precision-engineered, all-in-one custom dynamic system designed to identify and exploit high-probability breakouts during key market trading sessions. The CDS Fractal Blade Session is moves beyond simple session boxes, integrating a sophisticated multi-layered approach to define the most critical price levels with surgical accuracy. This premium indicator serves as the core engine for the CDS Asian Fakeout EA and other automated systems developed b
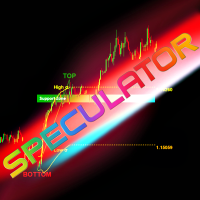
SPECULATOR is a manual trading system and indicator that helps you identify key support zones and market direction.
Master the market with a simple strategy and hidden wisdom! This is a manual indicator and contains features that may not supported by the MetaTrader current testing environment .
You choose any top and bottom on the chart, and the indicator draws: A support zone for your trend. For a bullish trend, a green zone appears; for a bearish trend, a red one. The support zone's sensitivit

The Kecia Market Manager is an advanced MT5 indicator that transforms multi-asset correlation analysis into actionable trading intelligence. By employing 6 sophisticated statistical frameworks and professional-grade visualizations, this tool reveals hidden market relationships, pair trading opportunities, and portfolio hedging strategies across unlimited currency pairs in real-time. Key Features: Multi-Metric Analysis Engine : Pearson correlation coefficient with rolling windows Cointegration te
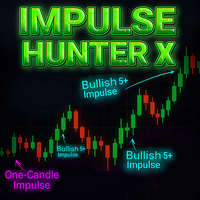
Impulse Hunter X Indicator – Professional Market Movement Radar Impulse Hunter X is a professional trading tool designed to help traders detect new, strong market impulses. It identifies and alerts you to powerful price movements, ensuring you never miss a trading opportunity. Every impulse type has been meticulously tested and refined for accuracy. Before using, make sure to configure the input parameters, especially the candle body size for stronger impulses! Key Features Detects stron

Indicator Title: Supply and Demand Zones Short Description: This indicator for MetaTrader 5 automatically identifies and draws supply and demand zones on the price chart, providing key visual information for trading decisions. Based on the analysis of price action and candle structure, the indicator highlights areas where the price is likely to react. Detailed Description: The Supply and Demand Zones indicator analyzes price history to identify specific candlestick patterns that suggest the pres
HiLo Matrix Indicator by Daniel Butogwa — Version 1.00 Precision Session Zones & Hourly Sweep Levels for the True Forex Scalper Overview HiLo Matrix is a powerful MT5 indicator designed to map key intraday market structure levels across major Forex sessions: Asian (Tokyo), London, and New York . This tool visually highlights session price ranges with clean, customizable colored boxes and lines to give you the sniper’s edge on timing, liquidity hunts, and breakout setups. It also includes critic
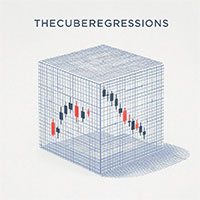
Product Name: The Cube Regressions - The Oracle of Future Trends
Predict the Market with Surgical Precision - Advanced Regression Technology
The indicator that projects price movements 5 minutes ahead
Full Description:
Unlock the power of predictive analysis with ANHURIX PRO, a revolutionary indicator based on:
Military Linear Regression - Algorithm developed for special forces in the financial market Precision Scatter Analysis - Identify turning points based on historical data Re

Radar DI – Indicador de Taxa de Juros para Mini Índice e Mini Dólar com Exportação CSV e Integração IA Radar DI é um indicador especializado que transforma as variações da taxa de juros DI (Depósitos Interfinanceiros) em sinais operacionais estratégicos para os ativos mini índice (WIN) e mini dólar (WDO) . NOVA FUNCIONALIDADE: Exportação CSV + Integração com IA Agora o Radar DI permite exportar todos os dados em formato CSV , incluindo: Variações dos DIs Variação do Mini Índice (WIN)
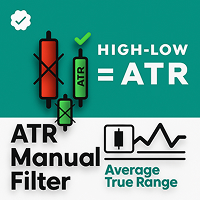
ATR MANUAL FILTER Manual ATR Filter – Precise Volatility Control Without Distortions What is it? ATR MANUAL FILTER is a tool designed for traders who value accuracy.
Instead of using automatic ATR calculations on all bars, you manually select only the candles that truly reflect the market's behavior. This allows you to exclude news spikes, extreme candles, and noise that distort volatility. The indicator helps you understand how much potential movement is left and whether the current move is al

The CDC Trend Matrix is a next-generation indicator that seamlessly combines trend detection with momentum insights, helping you spot optimal entry and exit zones at a glance. Its intuitive “zone” coloring immediately signals Bullish, Bearish, or Sideways market phases, while on-chart alerts keep you informed without cluttering your screen. Highlights Color-coded bars for instant trend zone recognition Clear BUY/SELL labels for precise action points Fully customizable settings to match your ri
The MetaTrader Market is the best place to sell trading robots and technical indicators.
You only need to develop an application for the MetaTrader platform with an attractive design and a good description. We will explain you how to publish your product on the Market to offer it to millions of MetaTrader users.
You are missing trading opportunities:
- Free trading apps
- Over 8,000 signals for copying
- Economic news for exploring financial markets
Registration
Log in
If you do not have an account, please register
Allow the use of cookies to log in to the MQL5.com website.
Please enable the necessary setting in your browser, otherwise you will not be able to log in.