Watch the Market tutorial videos on YouTube
How to buy а trading robot or an indicator
Run your EA on
virtual hosting
virtual hosting
Test аn indicator/trading robot before buying
Want to earn in the Market?
How to present a product for a sell-through
Technical Indicators for MetaTrader 5 - 113
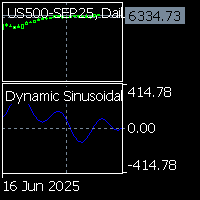
Dynamic Sinusoidal Cycles Projection by TradingCrossover Dynamic Sinusoidal Cycles Projection è un indicatore per MetaTrader 5 che visualizza cicli di mercato in una finestra separata, sviluppato da TradingCrossover. Basato su cinque periodi ciclici (10, 32, 64, 128 e 256 barre), offre un’analisi meccanica dei movimenti di mercato con proiezioni sinusoidali. Caratteristiche principali : Cinque periodi ciclici : Analizza il mercato con cicli di diversa lunghezza, attivabili singolarmente. Proiez

Overview This indicator automatically plots and labels major price levels from different timeframes and trading sessions—specifically, it draws horizontal lines for the high and low of the: Asia session London session Previous day Weekly and monthly periods It features strong visual and functional customization—each level group can be toggled on or off, colored or styled differently, and, uniquely, each type of level can trigger real-time price alerts when price approaches or crosses these k

The ** SmoothedTrender Indicator** is a custom MetaTrader 5 (MT5) indicator designed to display smoothed Renko bars on a chart, helping traders identify trends with reduced market noise. It transforms traditional price data into Renko bars, which are based on a user-defined price movement (brick size) rather than time, making it easier to spot significant trend changes. The indicator applies a smoothing mechanism to the price data, enhancing clarity by filtering out minor fluctuations.
### Key

指标功能说明 使用周期:M5 适用品种:所有流动性好的金融产品,推荐:黄金,BTC,指数,股票,外汇直盘货币对
此指标是价格行为学最好的辅助工具,一共包含三个主要功能 1,每个交易时段K线序列标记,对于不同的交易瓶中,你可以自由选择需要标记的时段 2,每个交易时段开盘后第一根k线的最高价和最低价范围标记 3,每个交易时段开盘后的前6根K线形成的价格区间标记以及开盘区间被突破后可能去到的目标位
指标设置说明 1,时区偏移设置:这个部分设置非常重要,加载指标时要根据自己的服务器时区设置偏移,以适应交易品种的开盘时间准确对准
BrokerTimeZoneOffset = 0; // Broker's timezone offset from UTC (hours) EnableAsia = true; // Enable Asia session marking AsiaStartTime = "01:00"; // Asia session start (HH:MM) MaxAsiaBars = 60;

AI Core Trading Master Pro - Complete Technical Analysis Suite Transform your trading with the most comprehensive technical analysis indicator for MT5, featuring 10 proven indicators, AI predictions, and a professional real-time dashboard. Core Features 10 High-Performance Technical Indicators: RSI (71.6-87.1% win rate) with divergence analysis Bollinger Bands (74.3-81.3% win rate) with squeeze detection MACD (60-75% win rate) with histogram analysis Stochastic (65-78% win rate) with overbought

Unlock Market Insights: Dynamic Trend Analysis with Statistical Precision for MT5 Are you seeking a deeper understanding of market movements? Many traditional tools may not fully capture the complex, non-linear dynamics often seen in financial markets. This can sometimes lead to uncertainty in identifying subtle trend shifts. Introducing Adaptive PolyBands Optimizer – an advanced MQL5 indicator designed to enhance your market analysis. Unlike some conventional tools, Adaptive PolyBands Optimizer

ElohimTrade Ultimate Confluence Pro — The Most Powerful Multi-Timeframe Confluence Indicator in Existence Unlock the true potential of your trading with ElohimTrade Ultimate Confluence Pro — the pinnacle of technical analysis tools, meticulously engineered for traders who demand precision, reliability, and unmatched insight. This cutting-edge indicator masterfully fuses the power of multiple leading indicators — EMA, RSI, MACD, Bollinger Bands, Stochastic, and ADX — across three critical timefra

How ATR Bot Works Tracks Market Trends with Precision: ATR Bot leverages the Average True Range (ATR) to calculate a dynamic Trailing Stop, continuously adapting to market volatility. This ensures you always have a clear view of key support and resistance levels, helping you stay ahead of price movements. Delivers Clear Trading Signals: The indicator generates vivid green arrows for optimal buy opportunities and striking red arrows for sell signals, triggered when the price crosses the ATR Trail

The Alpha: Your Ultimate Trend-Tracking Powerhouse Dive into the markets with The Alpha , a dynamic MetaTrader 5 indicator that supercharges your trading with its core SuperTrend component. Built on the robust Average True Range (ATR), The Alpha delivers crystal-clear, color-coded signals to help traders of all levels conquer trends with precision and flair. How The Alpha’s Works : ATR-Powered Precision : The Alpha uses the ATR (default period: 20) and a multiplier (default: 1.5) to calculate a

https://www.mql5.com/en/users/gedeegi/seller
GEN Smart Pulse Levels for MetaTrader 5 GEN Smart Pulse Levels is a visual indicator designed to help traders identify short-term momentum shifts and directional bias. It plots dynamic “Pulse Levels” derived from Hull Moving Average (HMA) momentum transitions. These levels act as adaptive reference points that assist in reading market structure, spotting potential reversals, and validating breakouts or false breaks. The indicator includes on-chart s

Adaptive Grid Elite Pro Indicator - Professional Trading Signal Indicator Transform Your Trading with Intelligent Divergence Detection and Grid Strategy Guidance Real Trading Results Live Trading Performance https://www.mql5.com/en/signals/2322688 AGE Pro MT5 EA https://www.mql5.com/en/market/product/144042 Adaptive Grid Elite Pro Indicator is a sophisticated technical analysis indicator that combines advanced divergence detection with intelligent grid trading guidance. This indicator provides
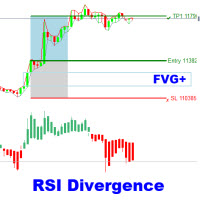
The RSI Divergence + FVG Signal indicator combines Relative Strength Index (RSI) Divergence with Fair Value Gap (FVG) detection to generate high-probability buy and sell signals based on both momentum shifts and institutional imbalance zones. Core Features: RSI Divergence Detection :
Identifies both regular and hidden bullish/bearish divergences between price and RSI. Divergences indicate potential trend reversals or continuation. FVG Zone Recognition :
Detects Fair Value Gaps (imbalances caused

Overview
SmartComboSignalDashboard is a multi-strategy signal scanner and visual dashboard for MetaTrader 5. It combines six technical indicator combinations to detect Buy/Sell opportunities and visualize them on the chart. It includes:
Signal table with real-time updates
Push notifications (with time-frame-based throttling)
Visual on-chart entry levels (Buy/Sell stops)
Interactive buttons per strategy for toggling entry levels
Setup & Installation
Open MetaEdito
Multi-Timeframe Bollinger Bands Indicator Enhance your trading analysis with our Multi-Timeframe Bollinger Bands indicator for MQL5! This powerful tool allows you to visualize Bollinger Bands across five different timeframes simultaneously, all using the same period setting . Gain a clearer understanding of market volatility and potential trend reversals at a glance. Simplify your multi-timeframe analysis and make more informed trading decisions.
Forex Signal Indicator — Automate Smart Pending Orders with Precision Are you tired of missing high-probability trades or struggling to manage your entries in fast-moving markets?
The Forex Signal Indicator is designed to make trading easier and smarter — even for beginners. Key Features Auto Placement of Buy Stops and Sell Stops
Automatically places pending orders at optimized zones based on market structure. Built-In Stop Loss Calculation
Calculates SL levels intelligently — no more guessing

PRICE WILL BE INCREASED TO £4999 SOON!
Knight Rider FX is a precision-engineered trading indicator that delivers highly accurate, non-repainting signals without flooding your chart. It filters out noise and selectively highlights only the highest probability trade setups. On higher timeframes, it anticipates major market reversals, while on intraday charts it pinpoints mini reversals with tactical clarity. By focusing on quality over quantity, Knight Rider FX equips traders with disciplined ent
The Seasonal Decomposition Indicator for MQL5 is a powerful tool designed to help traders identify and analyze underlying trends and seasonal patterns within financial time series data. By decomposing price movements into their core components, this indicator provides a clearer picture of market dynamics, allowing for more informed trading decisions. Key Features: Trend Line: Clearly visualizes the long-term direction of the market, smoothing out short-term fluctuations. Seasonal Line: Highlight

The Range Filtered AlgoAlpha is a technical analysis tool designed to help identify potential trading opportunities by analyzing market volatility. This Metatrader adaptation of AlgoAlpha's original TradingView indicator combines several analytical methods to provide visual market assessments.
Technical Features Utilizes Kalman filtering for price smoothing Incorporates ATR-based bands for volatility measurement Includes Supertrend elements for trend analysis Provides visual signals through col

Killer Combo System is a multi-strategy indicator designed to highlight potential reversal and continuation setups by combining several technical modules in one tool.
It provides flexible configuration, allowing users to enable or disable different confirmation filters according to their own trading approach. Available Modules RSI and CCI Divergence Detection MACD Crossovers Candlestick Pattern Recognition Multi-Timeframe Filtering Moving Average and Bollinger Band Trend Filters Signal Labels an

Indicator Description: Market Session Overlay The Market Session Overlay indicator for MT5 visually highlights the key global trading sessions — Asian, European, and American — directly on your chart.
It allows traders to clearly identify the time ranges of each session and their respective highs, lows, and opening levels, improving session-based analysis and strategy execution. Features: Draws colored rectangles for each session (Asian, European, American) on the chart.
Configurable se

Hello traders!
I'm here to introduce you to a new project called (Scalpeer Deriv)
which is based on trend hunting on M5 / M15 / M30 / H1 and H4 time frames!!!
for DERIV pairs (SYNTHETIC INDICES)
Volatility 75, Boom 1000, Crash 1000, Crash 500, Boom 500, Crash 300, and Boom 300
with Volume 5 and Time 500 parameters
providing buy and sell signals to hunt a good trend!!!
Highly recommended!
The first 5 copies will cost $149 / Final price $299!!

Title: Adaptive Flow Ratchet - The Intelligent Trailing Stop Tired of being stopped out on a minor pullback only to watch the price explode in your analyzed direction? Have you ever given back most of the profits from a great trade because your stop was too wide when the trend lost steam? The Adaptive Flow Ratchet by Dan Ferre is designed to solve exactly these problems. This is more than a trailing stop; it's a trade management system that adapts in real-time to the true strength of the market.

INDICATOR: GEN Support and Resistance Pro Developer: gedeegi General Description GEN Support and Resistance Pro is a technical indicator for MetaTrader that automatically identifies support and resistance (S&R) levels using price pivot logic. It supports multi-timeframe analysis and includes a trend momentum detection system that helps traders understand current market bias with additional visual and alert tools. Main Features Automatic S&R Detection: Identifies key support and resistance levels
RSI with Built-in Moving Average This indicator combines the power of the Relative Strength Index (RSI) with its own integrated moving average, providing a clearer and more dynamic view of market momentum. Unlike the standard RSI, which can be prone to false signals, this enhanced version helps traders confirm trends and identify potential reversals with greater confidence. Key Features: Integrated Moving Average: The indicator plots a customizable moving average directly on the RSI line. This a

Moving Average Slope with Signal This innovative indicator goes beyond a simple moving average by providing a dynamic and powerful analysis of its slope. It calculates and displays not only the slope of a moving average but also a moving average of that slope, creating a highly effective signal for trend changes and momentum shifts. This dual-layer analysis helps traders filter out noise and identify true trend strength and potential reversals with greater precision. Key Features: Dual-Layer Ana

Axis Reversionn: Multi-Asset Strength & Reversal Matrix Pinpoint market extremes and anticipate potential reversions with Axis Reversionn . This advanced dashboard for MetaTrader 5 provides an institutional-grade view of the market, allowing you to see which assets are over-extended and ripe for a reversion to their mean. Instead of following the crowd, identify where the crowd has pushed too far. Axis Reversionn gives you the data-driven edge to trade against market extremes with confidence. Ke

https://www.mql5.com/en/users/gedeegi/seller
FIBO NOVA is an indicator based on EMA + ATR/StdDev , forming Fibonacci volatility bands (0.618 – 2.618) to detect trend direction (uptrend/downtrend) , Entry signals , Take Profit (Rejection) , and Bounce (trend continuation) . It comes with pop-up alerts & push notifications , and a clean visual display with trend-colored zones. Quick Usage Guide Identify Trend Only Lower Bands active (green) → uptrend, focus on buy setups. Only Upper Bands active

RSIBandsTREND is a custom trend-focused indicator that enhances the classic RSI approach by visualizing dynamic upper and lower bands based on RSI calculations.
It plots three clean bands (upper, lower, and midline) directly on the chart, helping traders identify overbought and oversold zones with precision. Features: Three-band system: upper, lower, and center RSI lines EMA-smoothed RSI band calculation Clear trend zone visualization on chart Works on all timeframes (M1 to Monthly) Fully opt
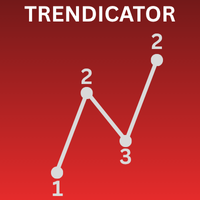
Functions Analyzes the current market trend Displays a numbering system based on trend structure (see below) Colors the chart background depending on trend direction Displays the ZigZag indicator Display Fibonacci Retracement with custom defined levels at the lates corrective trend movement Display Fibonacci Expansions with custom defined levels at the latest progressive trend movement Buffers for all relevant Trend parameters so EAs can access the trend information
Background Information The

Moving Average with Multi-Timeframe and Customizable Settings The Moving Average is a fundamental tool for any trader. Our advanced Moving Average indicator goes beyond the standard, offering you unparalleled flexibility and control. This indicator allows you to display a moving average from any timeframe on your current chart, providing a unique perspective and helping you to spot trends you might otherwise miss. Key Features: Multi-Timeframe Functionality: View a moving average from any timefr
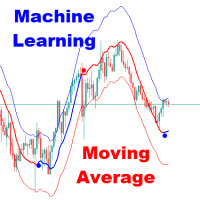
The Adaptive Gaussian Moving Average or also known as Machine Learning Moving Average (MLMA) is an advanced technical indicator that computes a dynamic moving average using a Gaussian Process Regression (GPR) model. Unlike traditional moving averages that rely on simple arithmetic or exponential smoothing, MLMA applies a data-driven, non-linear weighting function derived from the Gaussian process, allowing it to adaptively smooth the price while incorporating short-term forecasting capabilitie
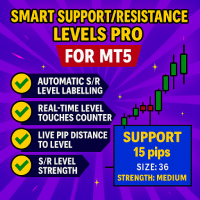
Enhanced Support/Resistance Level Information Indicator for MetaTrader 5 Meet the Enhanced Support/Resistance Level Information Indicator , your ultimate chart companion for visualizing important S/R information in real-time. This MT5 tool automatically labels your horizontal lines with critical S/R metrics— support/resistance classification, touch count, real-time pip distance, level strength, and historical age —all at a glance tucked neatly beneath each level. Built by traders, for traders

The algorithm scans the price history on a specified timeframe to identify relevant Order Blocks. Key features of EA_OB_v10.0: Intelligent analysis of Order Blocks across multiple timeframes Trend filtering using a secondary timeframe Graphical display of OB zones on the chart for better readability Flexible configuration for entry, Stop Loss, Take Profit, trailing stop, risk management, etc. Built-in protection against excessive losses (daily or cumulative) Optimized examples provided for XAUUS

Elevate your trading strategy with the Schaff Trend Cycle Alert MT5 , a powerful oscillator blending MACD and Stochastic elements to deliver smoothed, reliable trend signals with minimal lag. Developed by Doug Schaff in the late 1990s and popularized on platforms like TradingView and MQL5, this indicator has become a go-to for traders since the 2010s for its ability to identify cycle tops and bottoms earlier than traditional oscillators. Non-repainting and customizable, it excels in spotting ove

TrendView Ultimate — A Complete Trading System for Trend Clarity, Profit Insight, and Strategic Entries
TrendView Ultimate is a professional trading system designed to help traders identify trend direction, high-quality entries, and potential exits with clarity, confidence, and measurable performance. More than just a trend indicator, it offers non-repainting signals, dynamic visual feedback, and a powerful statistics panel with real-time analytics, allowing traders to test, adapt, and valida
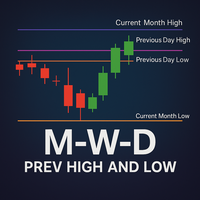
Unlock instant clarity in your charts! This indicator automatically draws the key levels where price has reacted or broken recently, giving you objective support and resistance zones without manual lines. Just attach it to your chart and watch the previous highs and lows appear for each timeframe. What does each line mean? Previous Month High
‣ Highest price recorded in the previous monthly period. Previous Month Low
‣ Lowest price recorded in the previous monthly period. Previous Week High
‣

Last frontier. Spartan is a premium "AI powered indicator" designed to identify the direction of price movements and potential reversal and exhaustion points. This tool is particularly beneficial for individuals seeking a clearer price movement. It can function as an enhancement to existing trading systems, operate independently, or assist in scalping strategies.
Price $499 for the first 5 customers, then it will reach $1999
Suggested time frame M1
1. Open BUY trades on arrow signal. Open SE
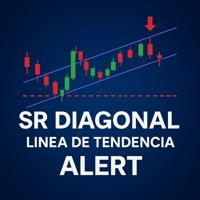
Trendlines to the Next Level! This indicator automates the drawing of diagonal trendlines based on configurable pivots and shows visual alerts on the chart when price interacts with them. Forget manual drawing: whenever price touches or breaks the projection, you will see a clear notification right on the candle. Key Features Flexible Pivot: adjust the bar count ( PivotBars ), though the default value is recommended to preserve signal integrity. Visual Alerts: on‑screen messages only, no sound.

Murphy Order Block is a highly optimized and visually clean indicator for identifying key institutional zones based on pure market structure logic. It is designed for traders who follow Smart Money Concepts (SMC), ICT-style OB trading, and structure-based break & retest strategies.
This indicator dynamically detects and draws: - **1 valid Bullish Order Block (Buy Zone)** - **1 valid Bearish Order Block (Sell Zone)**
### Key Features:
**Market Structure-Based Logic** - Uses swing high
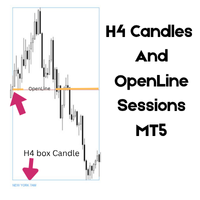
H4 Candles And OpenLine Sessions MT5 is a professional indicator for MetaTrader 5 that visualizes your trading sessions and key 4-hour candle ranges with clear, customizable boxes and stylish opening price lines. Highlight Asia , London , and New York market sessions plus up to 6 custom H4 candle ranges — each with fully adjustable colors, line styles, thickness, opacity, and labels. The powerful OpenLine feature marks the exact opening price for each session or H4 range, helping you instantly s

Historical Pivot Zones - Fibonacci Indicator MT5 Automatically draws Fibonacci retracement and projection zones based on historical price pivots. This MT5 indicator intelligently selects pivot points from different timeframes (weekly, monthly, or 6-month ranges) and creates visual Fibonacci zones around key levels. Features include: Smart Mode Selection - Auto-adjusts based on your chart timeframe
Clean Visual Zones - Highlighted areas instead of just lines
Essential Fib Levels - 9 retrace
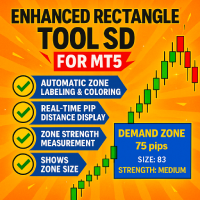
The Smart Supply and Demand Rectangle Tool Indicator is your ultimate MT5 companion for instantly visualizing key supply and demand data—right where you need it: on your zones, in real time.
This tool automatically overlays rich, actionable data ontop of your zones, such as zone classification, pip distance, strength, and zone size—cleanly positioned inside each zone. No more clutter, no more guessing—just clear, dynamic insights to support your decisions.
Built for Traders. Powered by Precis

Easily draw Entry, Take Profit, and Stop Loss levels on your chart to analyse and follow trading signals. Key Features Easily input Entry, TP1, TP2, TP3 and SL values Optional vertical line to mark the exact time of the signal Custom labels and colours for each line Visually assess the accuracy and risk/reward of any signal Works with all symbols and all timeframes No repainting, no lag, just clear and stable lines Use Cases Visualise signals from Telegram, WhatsApp, or other channels A

INDICATOR: GEN Vertex Trading System Developer: gedeegi General Description GEN Vertex Trading System is a comprehensive trading system designed for MetaTrader 5 (MT5). This indicator combines two powerful market analysis methodologies into a single tool: a dynamic trend module ( TurboTrend ) and a market structure analysis module ( Market Structure ). Its purpose is to provide clear trend signals, identify key levels based on Smart Money Concepts (SMC), and present them in an intuitive visualiz

Buy vs Sell Power Strength Visualizer Description:
The Buy vs Sell Power Strength Visualizer is an exclusive MetaTrader 5 indicator that transforms market strength analysis into an intuitive visual experience. It plots Buy Power and Sell Power indicators and colors the chart background based on which force is dominant: Green → Buy Power dominant (buying pressure)
Red → Sell Power dominant (selling pressure)
Black → Balance between forces Perfect for traders who want to quic
Hunter Spike
This indicator consists of two regression channels calibrated with the current movement of the synthetic index algorithm, for any Deriv or Weltrade broker.
Each channel has a signal, a target that alerts us when the price touches them, indicating buys on booms or gains and sells on crashes or pains.
-configuration for booms or gains: Channel zone 1 (30) Channel zone 2 (0)
-configuration for crashes or pains: Channel zone 1 (100) Channel zone 2 (70)
Zones freely configurable by

ENGLISH VERSION PRICE VARIATION LINE – TAKE CONTROL OF THE MARKET!
Turn the opening price into your strategic weapon
Clearly see how many points or % the market moved
Auto horizontal lines at the levels YOU define
Mark entry, exit, target zones and explosive regions
Clean, sharp, and professional layout
Simple, powerful, and essential for any serious trader

Bears vs Bulls Market Sentiment Indicator
DESCRIPTION: The Bears vs Bulls Market Sentiment Indicator is a powerful tool for analyzing market sentiment and identifying potential trading opportunities. This indicator combines multiple technical analysis methods to provide a clear visual representation of whether bulls or bears are dominating the market.
KEY FEATURES: • Dual Histogram Display: Shows both bullish and bearish strength simultaneously • Multi-Indicator Analysis: Combines RSI, Moving

The Color Change MA is a versatile custom indicator designed for MetaTrader 4, providing clear visual signals on trend direction and momentum. It features a Moving Average (MA) line that intelligently changes color based on the MA's position relative to the current candle's open and close prices, with an optional but powerful RSI (Relative Strength Index) filter for enhanced confirmation. Key Features: Dynamic Color-Changing MA: Green: Indicates a bullish bias. By default, this occurs when t

Master the Market with the Previous Line Indicator! Automated Support and Resistance! Are you tired of manually drawing support and resistance lines every single day? The Previous Line indicator is the ultimate tool for traders who value precision and efficiency. This powerful MetaTrader 5 indicator automatically identifies and draws the most significant horizontal support and resistance levels from previous price periods, letting you focus on your strategy. Key Features: Automatic S/R Levels

Adaptive SR Zones – Breakout Edition Adaptive SR Zones is a next-generation MetaTrader 5 indicator that automatically maps support and resistance zones and tracks breakout activity in real time. Designed for traders who rely on market structure and zone confluence, it combines multi-timeframe analysis , breakout confirmation logic , and customizable alerts into one powerful tool. No repainting. Core Features Dynamic Support & Resistance Mapping Detects zones from swing highs/lows and reaction po
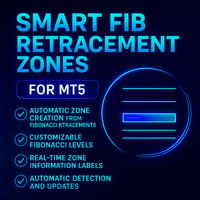
The Smart Fib Retracement Zones For MT5 Indicator is your ultimate MT5 companion for instantly visualizing key Fibonacci retracement data—right where you need it: on your zones, in real time. This tool automatically overlays actionable data on top of your Fibonacci retracement zones, such as level classification, pip distance, retracement percentage, and zone strength—cleanly positioned inside each zone. Whether you're scalping intraday or analyzing key Fibonacci levels on the daily chart, thi

This simple yet powerful indicator identifies the Asian session, its levels, the London session, the NY trap, and the timing shadows where the algorithm tends to manipulate and move. Fully customizable colors and times.
Not sure when to enter a trade?
Wait for price to grab liquidity... and strike with precision.
This indicator brings together all key elements of the daily cycle into a single visual tool. Identify zones where price is likely to seek liquidity before making its true move
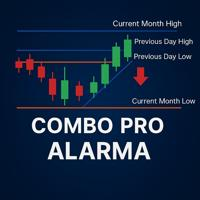
Includes:
2 indicators + 2 Level 1 PDF books + 3+ hours of video course + 1 risk‑management template + 1 month VIP signals channel access This combo is part of our 3‑Level Book Set , designed to guide you step by step from the fundamentals to advanced trading. Perfect for anyone who wants to start strong with professional tools from day one. Explore all paths. Choose your journey. Build your strategy. What’s included in this Combo? 1. Indicators (single .ex5 file) MonthlyWeeklyDaily Previous Hi

Introducing Trend Pulse Insights: Your Intelligent Guide to Market Volatility
Developed for traders seeking precision and clarity, Trend Pulse Insights offers an in-depth view of market dynamics, helping you identify opportunities and manage risks with confidence.
How Trend Pulse Insights Works
Our indicator uses algorithms to calculate volatility levels based on two recognized methods:
ATR (Average True Range): For measuring average volatility over a period.
Standard Deviation: To

SMC Larry Williams Structure is an indicator for analyzing price chart structures that builds and connects the most important swing points using the method of the famous trader Larry Williams from his bestseller “Long-Term Secrets of Short-Term Trading”, creating a solid foundation for adapting the market structure and analyzing the areas of interest of large participants using the Smart Money concept. The swing construction is based on simple and clear logic — identifying key local extremes whe

Triple Momentum - 3-in-1 Trend Indicator with Push Alerts Dominate the trend with Triple Momentum , the ultimate all-in-one indicator for MetaTrader 5. This powerful tool combines three renowned trend-following systems— FollowLine, SuperTrend, and PMax —into a single, clean, and highly effective visual display. Stop cluttering your charts and gain a clear, confident edge in any market by leveraging the power of triple confirmation for your entry, exit, and trade management strategies. Overview &
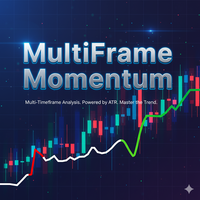
MultiFrame Momentum Indicator The MultiFrame Momentum is an advanced indicator that simultaneously analyzes multiple market timeframes to identify moments of directional convergence . Its unique design seeks momentum coincidences across different timeframes, generating clear visual signals via a line that changes between green (bullish) , red (bearish) , and gray (neutral) . Essential Configuration and Testing The indicator's effectiveness is entirely dependent on the customized timeframe config
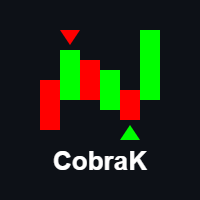
软件名称: CobraK 软件简介: CobraK是一款专为交易者设计的裸K指标,基于裸K线价格行为分析,能够精准识别多种经典K线形态,包括锤子、吞没、平底、早晨之星、黄昏之星和底部孕线等。当这些关键形态出现时,软件会在K线上自动标识出向上或向下的箭头符号,直观地提示交易机会,帮助交易者快速做出决策,把握市场节奏,提升交易效率和成功率。 核心功能: 精准识别形态:通过先进的算法,对K线形态进行实时分析,确保形态识别的准确性和及时性。 直观标记提示:在K线上以箭头符号清晰标识形态方向,向上箭头代表潜在的买入机会,向下箭头代表潜在的卖出机会。 多形态支持:涵盖多种经典且实用的K线形态,满足不同交易策略的需求。 简洁易用:界面简洁,操作直观,无需复杂设置,新手也能快速上手。 实时更新:与市场数据同步更新,确保交易者能够第一时间获取关键信息。 适用人群: 初入交易市场的新人,帮助快速掌握K线形态分析技巧。 有一定经验的交易者,作为交易决策的辅助工具,提升交易效率。 专业交易团队,用于快速筛选潜在交易机会,优化交易策略。 软件优势: 高效识别:快速捕捉关键形态,节省分析时间。 精准提示:通过箭
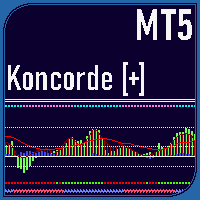
The Koncorde Plus Indicator is a sophisticated and versatile technical analysis tool for MetaTrader 5 (MT5), meticulously converted and enhanced from the acclaimed Koncorde [+] indicator on TradingView. Optimized for Forex volume analysis while preserving the original algorithm for all volume-based markets, it integrates six core components—four trend-based (RSI, MFI, Bollinger Bands, Stochastic) and two volume-based (Positive Volume Index (PVI) and Negative Volume Index (NVI))—to deliver a comp

This indicator is deliberately constructed to avoid repainting. Once a candle has closed, the output it produces remains fixed and unchanged. This behavior ensures accuracy during backtesting and provides reliability in real-time strategy execution.
Unlike traditional methods such as linear or polynomial regression, kernel-based methods don't assume any specific form or distribution for the data. Instead, they rely on a kernel function —a mathematical tool that assigns influence to each nearb
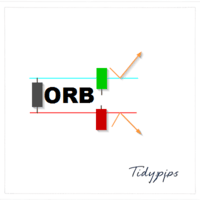
The Market Open ORB Indicator is a powerful and customizable tool designed for traders seeking to capitalize on the Opening Range Breakout (ORB) strategy. This indicator identifies the high, low, and midline of a user-defined time window after the market opens, providing clear visual cues for potential buy or sell opportunities when the price breaks out of these levels. Tailored for MetaTrader 5, it offers unmatched flexibility and precision for forex, stocks, and other markets. Key Features Cus

Smart HORIZON — Volume + SMC Indicator Smart HORIZON is a TradingView indicator that combines volume profile levels with Smart Money Concepts (SMC) components to provide structured chart analysis.
It highlights market structure elements and key reference zones, making it easier to monitor price interaction with institutional-style levels. Core Features Volume Profile Levels Weekly & Monthly VAH (green dashed line) and VAL (red dashed line). Untested levels can be extended until touched. Optiona

Fractal Pivot Lines — Indicator Overview Fractal Pivot Lines is a custom trend-structure indicator for MetaTrader 5 .
It automatically connects key fractal highs and lows with dynamic lines so you can see how price is respecting local structure, building channels, and preparing for potential reversals. Instead of staring at dozens of candles and guessing where the real pivots are, the indicator turns fractals into clear support/resistance paths and trend channels . What the Indicator Does

Are you struggling with unreliable signals that flood your charts and cost you money? Want a powerful, easy-to-use indicator that combines three of the most trusted technical tools into one clear, no-repaint signal generator? This is it! Why Choose This Indicator? Triple Confirmation Strategy
Combines EMA crossover, RSI momentum, and MACD histogram for reliable, high-probability signals. Reduce false entries and increase confidence! No Repainting
Signals only on closed bars, so what you

The Jurik Moving Average (JMA) is a sophisticated, adaptive moving average designed to reduce lag while maintaining smoothness. Unlike traditional moving averages (e.g., SMA, EMA), JMA adjusts dynamically to market volatility, making it more responsive to price changes. It’s particularly useful in trading for identifying trends and generating signals with less noise. Input Parameters : inpJmaPeriod (default: 14): The period for calculating the JMA and ATR. inpJmaPhase (default: 0): Controls the

Generates Buy/Sell Signals : Buy Signal : An upward arrow ( DRAW_ARROW ) appears when the JMA changes from a downtrend (red) to an uptrend (green). Sell Signal : A downward arrow ( DRAW_ARROW ) appears when the JMA changes from an uptrend (green) to a downtrend (red). Arrows are placed below (buy) or above (sell) the candle for visibility. Trend Following : Green Line : Indicates an uptrend. Consider holding or entering long positions. Crimson Line : Indicates a downtrend. Consider holding or en
Trader Dynamic Index Added Signal – A Context-Centric Scientific Approach to Market Oscillation Analysis 1. Introduction In modern technical analysis, traditional oscillators often deliver isolated signals , detached from the broader market context , resulting in a high rate of false or weak signals.
The Trader Dynamic Index Added Signal (TDI-AS) was developed to solve this issue by redefining oscillator-based signal generation , placing context awareness as the primary condition before any sign

INTRODUCTION :
This Indicator is made to detect a spike presence whether some conditions are completed. It works preferably with Crash and Boom index. This system contains multiple levels and Four zones such as SPIKE ZONE, CONFIRMATION ZONE, UP REJECTION ZONE, DOWN REJECTION ZONE. Two zones play most important to confirm a spike probability prescence such SPIKE ZONE (Red Levels) and CONFIRMATION ZONE (Red Level). INDICATOR FEATURE : - Dash dot Line in Red : -DI Signal (Up curve) - Solid Line i

Enhance your trading precision with the WaveTrend Oscillator Indicator MT5, a momentum-based tool adapted from LazyBear's iconic 2014 TradingView script, renowned for its accuracy in spotting market reversals and momentum shifts. Widely celebrated in the trading community for over a decade, this oscillator combines elements similar to RSI and MACD to detect overbought/oversold conditions, making it a staple for traders in forex, cryptocurrencies, stocks, and commodities. Its popularity stems fro
The MetaTrader Market offers a convenient and secure venue to buy applications for the MetaTrader platform. Download free demo versions of Expert Advisors and indicators right from your terminal for testing in the Strategy Tester.
Test applications in different modes to monitor the performance and make a payment for the product you want using the MQL5.community Payment System.
You are missing trading opportunities:
- Free trading apps
- Over 8,000 signals for copying
- Economic news for exploring financial markets
Registration
Log in
If you do not have an account, please register
Allow the use of cookies to log in to the MQL5.com website.
Please enable the necessary setting in your browser, otherwise you will not be able to log in.