Watch the Market tutorial videos on YouTube
How to buy а trading robot or an indicator
Run your EA on
virtual hosting
virtual hosting
Test аn indicator/trading robot before buying
Want to earn in the Market?
How to present a product for a sell-through
Technical Indicators for MetaTrader 5 - 120

Unlock the potential of market momentum with the Visual Momentum Surge Indicator, a powerful tool designed to identify prime trading opportunities with clarity and precision. This indicator is engineered to streamline your trading decisions by providing clear buy and sell signals directly on your chart, allowing you to capitalize on shifts in market dynamics. For just $30, you can integrate this professional-grade analytical tool into your trading arsenal. The Logic Behind the Visual Momentum Su

Aurora Fibonacci — Illuminating the Golden Path of Market Structure Aurora Fibonacci is a next‑generation MetaTrader indicator that transforms the timeless elegance of Fibonacci mathematics into a powerful, real‑time trading compass. By mapping natural ratios and price symmetries with exceptional clarity, it helps traders navigate complex market terrain and identify high‑probability trade zones before they emerge. Key Features & Benefits
Golden Ratio Precision – Harnesses the proven accuracy

Unleash the power of market momentum with the Dynamic Wave Oscillator, a sophisticated trading tool designed to identify and capitalize on trend dynamics. For just $30, this fully automated Expert Advisor integrates a unique oscillator with a complete trading solution to enhance your market analysis and execution. The Logic: Decoding Market Waves The Dynamic Wave Oscillator is engineered to provide a clear and insightful view of market momentum. Its logic is grounded in a meticulous analysis of

FiboNavigator — Adaptive Golden Ratio Intelligence Aurora Fibonacci Advanced is not just another retracement tool — it’s a smart market analysis engine built on the unshakable foundations of Fibonacci mathematics , enhanced with proprietary algorithms that evaluate special market conditions in real time. What sets it apart Context‑Aware Analysis – Goes beyond static levels by factoring in volatility shifts, session timing, and trend strength before signalling critical Fibonacci zones. Dy

Unlock market turning points with the Visual Impulse Indicator, a professional tool designed for MetaTrader 5. For a one-time price of $30, this indicator provides clear, non-repainting signals to help you identify potential market reversals with precision. It is designed to keep your main chart clean by operating in a separate window. The Logic Behind the Visual Impulse Indicator The core of the Visual Impulse Indicator is its unique ability to measure the underlying momentum or "impulse" of pr

FiboAdapter — Intelligent Fibonacci Precision for Modern Markets FiboAdapter redefines Fibonacci‑based technical analysis with next‑generation adaptability and data‑driven intelligence . Engineered for traders who demand more than static retracement lines, it transforms raw price action into actionable, market‑aware Fibonacci levels that evolve with every tick. Core Advantages Dynamic Volatility Calibration — Anchors Fibonacci grids using adaptive swing windows, fine‑tuned by real‑time ATR
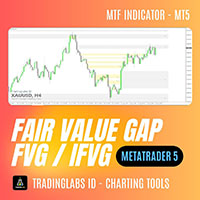
Fair Value Gap (FVG) & Inversion Fair Value Gap (iFVG) – TradingLabs ID In the ICT (Inner Circle Trader) concept, a Fair Value Gap (FVG), also known as Imbalance, occurs when price moves too quickly, leaving behind a gap without sufficient order balance. These areas are highly valuable for professional traders as they often signal potential retracement or entry zones with high probability. The FVG & iFVG Indicator is designed to automatically detect Fresh, Mitigated, and Inversion Fair Value Gap

LuxFibo Matrix Where Golden Geometry Meets Market Mastery LuxFibo Matrix is a cutting‑edge Fibonacci‑driven market intelligence system designed for traders who demand precision, elegance, and an edge. Built on the timeless golden ratio and enhanced with proprietary adaptive algorithms, LuxFibo Matrix goes beyond standard retracements — mapping complex Fibonacci price structures into a seamless matrix of opportunities. Its core technology fuses advanced volatility filters, multi‑timeframe patt

Prism Phi — Multi‑Dimensional Fibonacci Market Mapping Prism Phi takes the timeless Fibonacci method and refracts it through a modern, multi‑layered analytical “prism,” revealing angles of the market structure invisible to standard tools. Anchored in the golden ratio (Φ) and enhanced with adaptive algorithms, Prism Phi plots retracements, extensions, and confluence zones with a level of clarity and depth that transforms how traders interpret price action. What Makes It Exceptional Spectral Fibo

Golden Vector — Precision Market Geometry for the Modern Trader Golden Vector is a cutting‑edge trading indicator that fuses advanced Fibonacci analytics with high‑level mathematical modeling to reveal the hidden vectors driving market movement. Engineered for traders who demand more than basic retracement lines, it transforms raw price data into a geometrically structured roadmap for strategic entries and exits. Core Advantages Next‑Gen Fibonacci Engine — Goes beyond standard ratios, dynamical
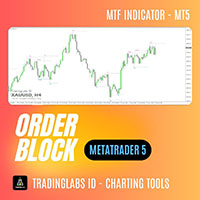
Order Block + Fair Value Gap (FVG) Indicator Multi-Timeframe Order Block + FVG Tool In the ICT (Inner Circle Trader) concept, Order Blocks (OB) + Fair Value Gaps (FVG) are among the most critical areas used by professional traders to read market structure, identify supply & demand zones, and spot high-probability entry points. The Order Block + FVG Indicator automatically detects and displays both Order Block zones and Fair Value Gaps directly on your MT4 charts. With multi-timeframe support, yo
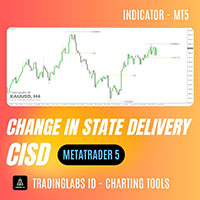
CISD (Change In State Delivery) Indicator TradingLabs ID – ICT Concept Tool The Change In State Delivery (CISD) Indicator is designed based on the ICT (Inner Circle Trader) concept, where price transitions from one delivery state to another often signal high-probability trade opportunities. This tool automatically detects and marks CISD levels on your MT4 charts, helping traders identify potential breakout and retest zones with great accuracy. It is especially useful for traders applying Smart
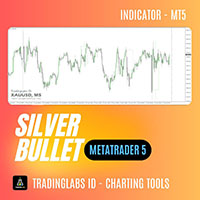
ICT Silver Bullet – Time Window Indicator The ICT Silver Bullet indicator automatically marks the ICT Silver Bullet time windows on your chart, helping you stay focused on the highest-probability setups defined by the ICT methodology. This tool is especially powerful when combined with a Fair Value Gap (FVG) indicator – simply wait for an FVG setup to form inside the Silver Bullet window, and you’ll have a precise time-based confirmation for your entries. Key Features: Automatic Silver Bullet Wi
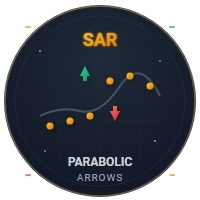
Parabolic SAR Buy Sell Premium Overview The Parabolic SAR with Arrows is a custom technical indicator developed for MetaTrader 5 that combines the power of the classic Parabolic SAR with clear visual buy and sell signals. This indicator is designed for traders looking to quickly and visually identify trend reversals.
️ Key Features Visual Elements SAR Line: Dotted yellow points that follow the price Buy Arrows: Green arrows (↑) that appear when the price breaks above the SAR Sell Arr
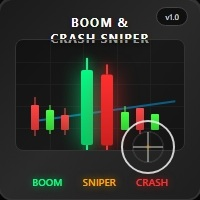
Boom and Crash Sniper - Technical Description General Information Name: Boom and Crash Multi Sniper Version: 1.00 Developed by: FrozenSkillz (2025) Type: Main Chart Indicator Specialty: Spike Detection in Boom and Crash Indices What does the indicator do? This indicator is specifically designed to detect spikes (sudden price movements) in Deriv's Boom and Crash synthetic indices. It combines multiple technical analysis tools to identify trading opportunities in these highly volatile markets.
V

FiboNinja — Precision Strikes with the Golden Ratio FiboNinja is a next‑generation trading indicator that blends the stealth and precision of a ninja with the timeless power of Fibonacci mathematics . Built for traders who demand accuracy, speed, and adaptability, it identifies high‑probability price zones where the market is most likely to react — and does it with surgical clarity. Key Advantages Stealth‑Level Entry Points — Pinpoints Fibonacci retracements and extensions before they’re ob

Visual Momentum Wave Analyzer: Decode Market Momentum with Unrivaled Clarity Tired of lagging indicators and ambiguous signals? The Visual Momentum Wave Analyzer is an advanced, next-generation oscillator designed to give you a crystal-clear view of market momentum, trend strength, and potential reversals. Built upon proven principles but enhanced with a sophisticated visual engine, this tool helps you make faster, more confident trading decisions. For only $30, you can add this professional-gra

Visual PriceDynamics Indicator: See The Market's Future Potential Unlock a new perspective on the markets with the Visual PriceDynamics Indicator for MetaTrader 5. Have you ever looked back at a chart and wished you could have seen the full potential of a move before it happened? The Visual PriceDynamics Indicator is a powerful and innovative tool designed to help you study the market's historical dynamics by analyzing future price action to reveal the underlying momentum of major moves. Instea
Visual Multi-Frame Volatility Gauge: See Inside the Market's Moves Unlock a deeper understanding of market dynamics with the Visual Multi-Frame Volatility Gauge. Standard indicators show you what happened, but this powerful tool shows you how it happened. It answers the critical question every trader asks: Is this a strong, directional trend or a volatile, uncertain battle? By visualizing the internal structure of each price bar, you gain a unique edge in confirming trends, spotting exhaustion,

Visual Momentum Flow Indicator: Decode the Market's True Intent Are you tired of indicators that only work in trending markets, leaving you confused during consolidations? Do you struggle to distinguish between a genuine momentum breakout and a false move within a ranging market? The Visual Momentum Flow Indicator is your solution. This meticulously engineered tool is designed not just to follow trends, but to interpret the very character of the market, giving you a distinct edge by clearly ide

Momentum Wave Analyzer Unlock the True Force of the Market with Momentum Wave Analyzer Are you looking for an indicator that goes beyond simple buy and sell signals? Do you want to not only identify the trend but also measure its underlying strength and conviction? The Momentum Wave Analyzer is a sophisticated yet intuitive tool designed to give you a clear, visual representation of market momentum, helping you catch powerful moves and avoid weak signals. For just $30, you can equip your tradin

Fractal Momentum Analyzer: Decode the Market's Hidden Structure Unlock a new dimension of market analysis with the Fractal Momentum Analyzer. While traditional indicators measure price and volume, this powerful tool goes deeper, quantifying the underlying complexity and geometric structure of market movements. For just $30, you can gain a unique edge by understanding the very nature of price action before a major move occurs. This is not just another oscillator. The Fractal Momentum Analyzer is

Visual Tempo Candle Flow: Master the Market's True Rhythm Are standard timeframes like M1 or M5 too slow for your trading style? Do you feel you are missing the crucial micro-movements and the real-time momentum that drive price? The Visual Tempo Candle Flow indicator is the definitive tool designed to give you an unprecedented edge by visualizing price action in a way you have never seen before. This powerful indicator operates in its own separate window, generating a clean, intuitive candlest

Master Market Trends with the Quantum Flux Oscillator Unlock a new level of trading precision with the Quantum Flux Oscillator, a professional-grade indicator for MetaTrader 5 designed to identify and capitalize on market momentum. Stop guessing the direction of the trend and start making informed decisions based on a clear, powerful, and mathematically sound tool. For just $30, you can add this indispensable oscillator to your trading arsenal. The Logic Behind the Oscillator The Quantum Flux O

Dynamic Momentum Surge: Precision Reversal Signals Unlock the power of pure price action and capture key market turning points with the Dynamic Momentum Surge indicator for MetaTrader 5. Are you tired of lagging indicators that signal entries long after the move has started? The Dynamic Momentum Surge is engineered to solve this problem by identifying high-probability reversal opportunities with exceptional precision. It is a sophisticated tool designed for both forex and binary options traders
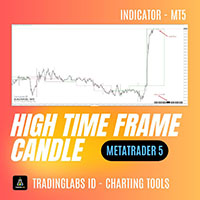
HTF Candle Plus Timer Upgrade your trading experience with HTF Candle Plus Timer, a smart indicator that displays higher timeframe candles directly on your current chart. It allows you to stay aligned with the bigger market picture while focusing on your preferred trading timeframe. Key Features: Higher Timeframe Candles
Plot custom higher timeframe (HTF) candles such as H1, H4, D1, W1, or MN directly on lower timeframe charts for a clearer market overview. Current Candle Timer
A live countdown

Introduction The Order Block Support & Resistance Zones SMC Indicator is a powerful trading tool designed to detect order blocks effectively.
This indicator displays both support and resistance order blocks , calculated based on zigzag levels .
We have three zigzag levels , each calculated based on the previous one.
In the Basic version , you get access to Level 1 and Level 2 blocks only. Order blocks represent key price levels where the market is likely to

Whether you’re sc alping intraday swings or timing precision entries in trending markets , Paragon Accelerator Prime acts as your real‑time market radar — scanning, filtering, and highlighting opportunities with the discipline and clarity of an institutional trading desk.
Key Advantages: Ultra‑fast pattern detection for early market entries. False‑signal filtration using multi‑layer trend and volatility checks. Optimized for small & medium timeframes without sacrificing accuracy. Professional‑

It allows traders to better understand the balance between buying and selling pressure, providing clear visual signals for potential reversals and breakouts . Key Features: Cumulative Delta Volume : separates buying and selling pressure in real time. Median Buy & Sell Volume lines : highlight equilibrium zones in order flow. Volume Velocity Factor : adjusts delta strength based on sudden volume changes. Smart MFI Alerts : automatic buy/sell arrows appear when Money Flow Index (MFI) reaches ov

V-FORCE PRO - THE ADVANCED VOLUME INDICATOR FOR METATRADER 5 Discover the Power of Real Volume with V-Force Pro – The Revolution in Market Analysis! Stop Trading in the Dark! Visualize the strength of Big Players in real-time. The Problem Every Trader Faces: Have you ever wondered why some market moves fail even when every technical indicator points in the same direction? The answer lies in REAL VOLUME —the most critical piece of the puzzle that most traders ignore! Introducing V-Force Pro 5.3 -

Dynamic CMF Calculation: Customize the period for the Chaikin Money Flow (CMF) to fine-tune your analysis and maximize signal precision. Intuitive Color-Coded Alerts: Instantly interpret market conditions with clear visual cues: Green Alert: Indicates the Overbought zone – signaling a potential selling opportunity. Red Alert: Indicates the Oversold zone – suggesting a potential buying opportunity. Gray Alert: Represents the Neutral zone – a signal to wait for a confirmed trend or reversal. Autom
The Donchian Time Sync Analyzer brings powerful multi-timeframe dimension to classic Donchian channel analysis, allowing traders to simultaneously monitor trend strength and potential reversal signals across five different chart periods. This advanced indicator calculates the highest highs and lowest lows across your selected timeframes, generating clear visual signals that help identify convergence of trend direction across multiple time horizons. By providing coordinated analysis from minute t

Visual Temporal Frame Fusion: See the Market Through a Wider Lens Unlock a new dimension of market clarity. Stop guessing the broader market direction and start seeing it directly on your trading chart. The Visual Temporal Frame Fusion indicator is a powerful, professional-grade tool designed to solve one of the most common challenges traders face: multi-timeframe analysis. Instead of constantly switching between charts and losing focus, this indicator elegantly overlays the price structure of

Visual Neural Trend Analyzer Unlock the market’s true direction with the Visual Neural Trend Analyzer, a sophisticated indicator designed to identify high-probability trading signals with exceptional clarity. For just $30, gain a powerful edge by filtering out market noise and focusing only on significant trend movements. This is not just another arrow indicator. The Visual Neural Trend Analyzer employs an intelligent, multi-layered confirmation system to ensure the signals it generates are both

Unlock True Market Momentum with the Visual Volume Momentum Flow Indicator Are you tired of standard volume indicators that only tell you half the story? The Visual Volume Momentum Flow Indicator is a professional-grade tool designed to give you a decisive edge by dissecting market volume with unparalleled precision. Move beyond simple volume bars and see the real buying and selling pressure behind every price movement. The Logic: A Deeper Look into Volume This indicator is built on a sophistic

Adaptive Momentum Wave: Unlock the Market's True Rhythm Tired of lagging indicators that get you into trades too late and whipsaw you in choppy markets? The Adaptive Momentum Wave is a next-generation trend analysis tool meticulously engineered to solve this exact problem. It dynamically adjusts to market volatility, providing you with a clearer, more responsive, and less noisy view of the underlying trend. Stop guessing and start trading with an indicator that thinks like the market moves. The

Visual Dynamic Trend Analyzer: Your Ultimate Trend Trading Companion Unlock the power of clear, confident trend trading with the Visual Dynamic Trend Analyzer. This meticulously crafted indicator for MetaTrader is designed to eliminate market noise and provide you with precise, easy-to-follow buy and sell signals, transforming your chart into a clear map of market direction. For just $30, gain an indispensable edge in any market condition. The Logic Behind the Edge The Visual Dynamic Trend Anal

Of course. Here is an attractive and detailed description for the "Visual Pulse Dynamics Flow" indicator, designed for a sales page. Visual Pulse Dynamics Flow: Master Market Momentum Unlock a new level of market insight with the Visual Pulse Dynamics Flow indicator. Designed for the discerning trader who demands precision and responsiveness, this tool moves beyond traditional oscillators to provide a clearer, faster signal of market momentum and potential trend reversals. For just $30, gain an

Visual Trend Flux Analyzer: Your Ultimate Guide to Market Momentum Unlock a clearer, more intuitive way to view market trends and momentum with the Visual Trend Flux Analyzer. This powerful indicator for MetaTrader 5 is designed to cut through market noise and provide you with a clean, visual representation of trend strength and potential reversals. Stop guessing the market's direction and start making informed decisions based on a sophisticated, multi-layered analysis. For just $30, you can eq
Unlock Market Trends and Eliminate Noise with the Visual Dynamic Range Analyzer Are you tired of struggling with choppy markets and false signals? Do you find it difficult to identify the true trend direction amidst constant market noise? The Visual Dynamic Range Analyzer is the definitive tool designed to bring clarity and confidence to your trading, transforming complex market dynamics into simple, actionable visual signals. For just $30, this powerful indicator for MetaTrader 5 will become a
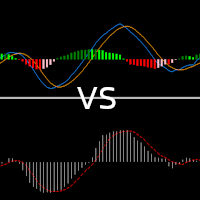
Optimized version of colored MACD indicator
MACD (Moving Average Convergence/Divergence) is a popular trading indicator used in technical analysis of securities prices. It is designed to identify strength, direction, momentum, and trend duration.
Default values: 12,26,9 MA Type: Exponential
Values i use:
8,21,5
MA Type: simple
Feel free to use what is work for you.
Trading interpretation:
MACD is positive when the histogram value is increasing, then upside momentum is increasing.
MACD i
Advanced BuySell Signals ATR Enhanced - Professional Trading Indicator Revolutionary Multi-Strategy Signal System with Real-Time Performance Analytics Transform your trading experience with this cutting-edge indicator that combines multiple proven technical analysis methods with advanced ATR-based risk management. Specially optimized for EURUSD H1 timeframe, this indicator delivers precise entry and exit signals with comprehensive performance tracking.
Key Features & Advantages Mult
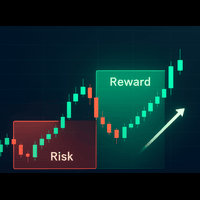
Smart Risk Manager – Risk/Reward Ratio & Position Sizing Tool for MT5 Overview (Short Description) A professional risk management indicator that helps traders calculate lot size, risk percentage, and reward ratio in real time. Perfect for Forex, Indices, Gold, and Synthetic Indices traders who want precise control over their capital. Full Description Trading without proper risk management is like driving without brakes.
The Smart Risk Manager for MT5 gives you full control over your position siz
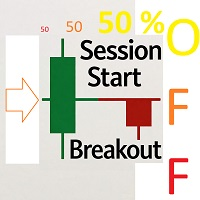
Session Start Breakout - The Session Start Hunter Full Description The art of a trader is to find the "starting point." Many of the main, powerful market movements take shape right after the initial excitement at the beginning of key trading sessions (Asia, London, and New York) subsides. The Session Start Breakout indicator is an advanced analytical tool designed precisely to help you identify these critical moments and potential opportunities. This tool is a powerful analytical ass

発売記念特別価格:たったの 30 ドル!
通常価格 39 ドル → 今なら 30 ドルでご購入いただけます(期間限定) 。
Gold Scalper Signal Pro — プロフェッショナルなゴールドシグナルインジケーター Gold Scalper Signal Proは、金(XAUUSD)スキャルピング専用に設計されたプロ仕様の高精度インジケーター です 。
リアルタイムの買い/売りシグナルを提供することで、 市場ノイズを最小限に抑えながらトレンドの始まりを捉え 、安定的で自信に満ちた取引判断をサポートします。 主な機能(無料版と比較して)
ゴールドに最適化されたロジック - 一般的なマルチ通貨インジケーターをはるかに超える精度
強化された早期トレンドキャプチャ - スキャルピングに特化したアルゴリズム
明確 な矢印シグナル - 直感的で初心者に優しい
リアルタイムアラート - サウンド/ポップアップ/プッシュ通知をサポート
短期取引のサポート - 推奨時間枠:M1(スキャルピング重視)、M5(より穏やかな短期デイトレード
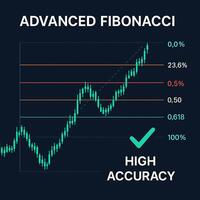
Fibonacci Advanced Indicator – Precision Meets Intelligence The Fibonacci Advanced Indicator is a cutting-edge technical analysis tool designed for traders who demand more than conventional retracement levels. Built on the foundational principles of Fibonacci mathematics, this indicator transcends tradition by integrating dynamic market behavior , multi-timeframe analysis , and adaptive algorithms to deliver high-probability trading zones with surgical accuracy.
1. Multiple Fibonacci Levels

The Next Evolution in Fibonacci Intelligence FiboChampion isn’t just another Fibonacci tool—it’s a paradigm shift in how traders interpret price action. Engineered for precision and adaptability, this advanced indicator fuses quantum-inspired logic , machine-learned pattern recognition , and non-linear Fibonacci geometry to uncover market turning points with uncanny accuracy. What Sets FiboChampion Apart: Non-Linear Fibonacci Mapping : Goes beyond static retracements by adapting to fractal m

Fibonacci Xcel – The Fibonacci Indicator That Thinks Ahead. It fuses advanced Fibonacci analytics , real‑time sentiment tracking , and a proprietary Market Quantum State Engine to give traders a crystal‑clear view of what’s happening now — and what’s likely to happen next. Core Capabilities Dynamic Fibonacci Mapping – Automatically adapts retracements, extensions, and projections to evolving price structures. Sentiment Fusion Layer – Integrates live market sentiment data to validate or ch

Market state detector: Super Trend, Transition, Chaos, Consolidation, Breakout (from consolidation squeeze)
Plots a color-coded histogram in a separate window where value = state code and color = state category.
State codes (ENUM_MARKET_STATE): 0 MARKET_QUANTUM_SUPER_TREND 1 MARKET_QUANTUM_TRANSITION 2 MARKET_QUANTUM_CHAOS 3 MARKET_QUANTUM_CONSOLIDATION 4 MARKET_QUANTUM_BREAKOUT
Instant Clarity "Read the market’s mood in seconds." "From chaos to trend — spot the

Professional TMA Version 1.0 - Advanced Technical Analysis
OVERVIEW The Professional TMA Centered is an advanced technical indicator based on the Triangular Moving Average (TMA) that provides multidimensional market analysis through accurate signals, dynamic bands, and automatic reversal point detection.
What is a TMA (Triangular Moving Average)? The TMA is a doubly smoothed moving average that significantly reduces market noise while remaining sensitive to trend changes. Unlike traditiona
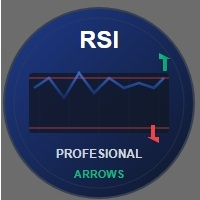
RSI Arrows Professional v1.00 Advanced Technical Indicator for MetaTrader 5
Overview RSI Arrows Professional is a sophisticated technical indicator that combines the power of the traditional RSI (Relative Strength Index) with an intelligent directional signal system. Designed specifically for traders looking to identify optimal entry and exit points in the market, this indicator implements conservative trading strategies based on momentum analysis.
Key Features Conservative Signal Strategy

Visual DynamicWave Oscillator: Master Market Reversals with Precision Unlock a new level of trading clarity with the Visual DynamicWave Oscillator, an advanced technical indicator meticulously engineered to identify high-probability market turning points. While many oscillators falter in volatile conditions, the DynamicWave Oscillator thrives by intelligently adapting to the market's ever-changing rhythm. This is not just another overbought and oversold indicator; it is a sophisticated tool des

So Easy Indicator: Your Simple Path to Clearer Market Signals Unlock a clearer view of the market with the So Easy Indicator, a powerful yet intuitive tool designed to simplify your trading decisions. For just $30, you can add this robust indicator to your MetaTrader platform and start identifying potential market turning points with greater confidence. Forget chart clutter and confusing signals; the So Easy Indicator focuses on the core dynamics of market volatility and momentum to provide cle

Unlock the Market's Rhythm with Visual Dynamic Volatility Bands Are you tired of navigating the unpredictable swings of the market with outdated tools? Do you struggle to find clear, reliable entry and exit points in today's volatile trading environment? It's time to stop guessing and start trading with confidence. Introducing the Visual Dynamic Volatility Bands , a sophisticated, next-generation indicator engineered to give you a distinct edge. For just $30, this powerful tool moves beyond sim

Dynamic Volatility Corridor: Your Ultimate Breakout and Trend Companion Unlock the power of market volatility with the Dynamic Volatility Corridor, a sophisticated indicator designed to identify high-probability breakout opportunities with exceptional clarity. For just $30, this tool provides a powerful and intuitive way to visualize price action and capture significant market moves. The Core Logic: How It Works The Dynamic Volatility Corridor is not just another channel indicator. Its strength

Visual Trend Direction and Force Indicator (TDF) Unlock the True Force of the Market and Trade with Unprecedented Clarity Are you tired of trend indicators that lag, produce false signals in choppy markets, and fail to distinguish between a weak trend and a powerful, profitable move? The Visual Trend Direction and Force (TDF) Indicator is the definitive solution, engineered to provide a crystal-clear and immediate view of both the trend's direction and, more importantly, its underlying strength

Dynamic Flux Oscillator Pro Unlock the Market's True Momentum and Trade with Unprecedented Clarity Are you tired of lagging indicators that generate signals long after the optimal entry point has passed? The Dynamic Flux Oscillator Pro is a professional-grade trading tool meticulously engineered to solve this problem. It moves beyond traditional oscillators by analyzing the raw, underlying momentum of the market—what we call "market flux"—to provide you with timely, high-probability trading sig

Visual Dynamic Channel Breakout Unlock the Power of Market Volatility with Precision Breakout Signals Are you tired of noisy indicators and missed opportunities? The Visual Dynamic Channel Breakout indicator is a professional-grade tool designed to help you identify and capitalize on market trends with confidence. By intelligently adapting to real-time volatility, this indicator provides clear, actionable signals that cut through market noise, allowing you to focus on what matters: making profi

Dynamic Momentum Oscillator System: Trade with the Trend, Adapt to Volatility Are you tired of oscillators that give false signals in choppy markets and lag behind strong trends? The Dynamic Momentum Oscillator System is a professionally engineered trading tool designed to overcome these exact challenges. It's not just another indicator; it is a complete trading system that provides clear, actionable signals by intelligently adapting to ever-changing market conditions. The Logic: A Deeper Look
Description in English Currency Strength Money PRO — The Ultimate Currency Strength Indicator The Currency Strength Money PRO was designed for traders who need clarity and accuracy when analyzing Forex and Metals markets. ️ Modern LiveCharts-style display — colored bars instantly show which currencies are strong and which are weak.
️ Fully customizable — select currencies, timeframes, weights, and colors to fit your strategy.
️ Smart alerts — get notifications when a true imbalance between

The LBArrow-2 indicator is a sophisticated tool designed for MetaTrader 5 (MT5), delivering precise arrow-based signals derived from a linear breakout strategy. This versatile indicator empowers traders to customize their experience by selecting their preferred signal style—choose between visually appealing blocks or traditional arrows—ensuring seamless integration into your trading workflow. Additionally, you can adjust the starting period from which signals are displayed and fine-tune the line

An effective tool for traders, the Equilibrium Gauge indicator is designed to identify significant price shocks and subsequent market reactions. It automatically detects large, impactful candles and projects three key zones—Shock, Absorption, and Tension—to forecast potential areas of market reversal or continuation. When the price enters the critical "Tension Zone" and specific conditions are met, the indicator will generate a clear BUY or SELL arrow, providing a straightforward signal for pote

Dynamic Momentum Wave: Trade with Adaptive Intelligence Unlock the market's true momentum and leave lagging, noisy indicators behind. For just $30, gain an intelligent edge. Are you tired of momentum indicators that give signals too late, or get you caught in false breakouts during choppy markets? The Dynamic Momentum Wave is a professional-grade trading tool engineered to solve this problem. It moves beyond outdated, fixed-period calculations and uses a sophisticated engine that adapts in real

Visual Momentum Wave Sync: Master Market Momentum with Unmatched Clarity Unlock the market's rhythm and trade with confidence for just $30! Are you tired of noisy indicators that clutter your charts and provide conflicting signals? Do you struggle to accurately gauge market momentum and identify high-probability entry and exit points? The Visual Momentum Wave Sync indicator is the definitive tool designed to solve these problems, offering a crystal-clear view of market dynamics for traders who

Visual Dynamic Envelope Crossover: Precision Signals for Modern Traders Unlock a new level of clarity in your trading with the Visual Dynamic Envelope Crossover indicator. Designed for traders who demand precision and simplicity, this powerful tool eliminates guesswork by identifying high-probability entry points with clear, non-repainting buy and sell arrows directly on your chart. For just $30, you get a sophisticated yet easy-to-use indicator that can become the cornerstone of your trading s
Features List 1:
FVG->iFVG Order Block High Transaction Line (Personal strategy) Premium Discount 50% and 61% Previous day high low Previous week high low Candle end countdown Feature List 2 : (Implemented based on feedback from community groups) trend identification Hide FVG, Order Block, Large Transaction line below 50% equilibrium. Hide all/Individual texts/features FUTURE Feature List (Will be implemented only if at least 5 people request for it.)
Asia, London, NY lq zones (Implemented) Def

Visual Portfolio Analyzer: Trade Your Portfolio, Not Just a Pair Unlock a new dimension of market analysis with the Visual Portfolio Analyzer, the ultimate tool for traders who think in terms of a complete portfolio. Stop making isolated decisions on single currency pairs and start trading with a holistic view of your combined positions. This indicator is meticulously designed to filter out market noise and provide clear, high-probability signals based on the collective momentum of your chosen

Visual Momentum Wave Cross Indicator: Trade with Clarity and Confidence Are you tired of indicators that lag behind the price, giving you late signals and causing you to miss the best part of a move? The Visual Momentum Wave Cross Indicator is engineered to solve this problem by providing timely, high-quality signals that align with the true market trend. This is not just another moving average crossover tool. At its core is a sophisticated multi-wave system designed to identify high-probability
Momentum Surge Tracker: Unleash the Power of Smart Momentum Unlock a new edge in your trading with the Momentum Surge Tracker, a sophisticated indicator designed to identify and capitalize on market momentum with unparalleled precision. For just $30, you can equip your trading arsenal with a powerful tool that intelligently adapts to market volatility, providing clear, actionable signals to help you stay ahead of the curve. The Logic Behind the Momentum Surge Tracker At its core, the Momentum S
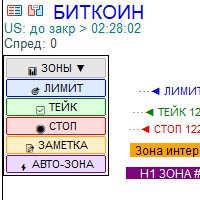
Удобная панель для разметки графика в MT5 Рисует зоны и авто-зоны с привязкой к таймфрейму Это компактная панелька, которая всегда под рукой на графике. В один клик она разворачивается, чтобы вы могли моментально наносить важные уровни, и так же легко сворачивается, чтобы не мешать обзору. ЛИМИТ — для отметки точек входа. ТЕЙК — для целей по взятию прибыли. СТОП — для уровней остановки убытков. ЗОНЫ — рисует прямоугольные области (например, важный ценовой диапазон или зону кон
The MetaTrader Market offers a convenient and secure venue to buy applications for the MetaTrader platform. Download free demo versions of Expert Advisors and indicators right from your terminal for testing in the Strategy Tester.
Test applications in different modes to monitor the performance and make a payment for the product you want using the MQL5.community Payment System.
You are missing trading opportunities:
- Free trading apps
- Over 8,000 signals for copying
- Economic news for exploring financial markets
Registration
Log in
If you do not have an account, please register
Allow the use of cookies to log in to the MQL5.com website.
Please enable the necessary setting in your browser, otherwise you will not be able to log in.