Watch the Market tutorial videos on YouTube
How to buy а trading robot or an indicator
Run your EA on
virtual hosting
virtual hosting
Test аn indicator/trading robot before buying
Want to earn in the Market?
How to present a product for a sell-through
Technical Indicators for MetaTrader 5 - 31

Indicator Name: Auto Trend Line Description: Automatically draws trend lines with optimized and enhanced trend direction detection. Main Features: 1. Automatic Trend Line Drawing: Two main lines are plotted: Support Line – color: Magenta Resistance Line – color: Cyan Lines are calculated based on: Two extremums (highs/lows) or an extremum and a delta (custom offset) 2. Trend Direction Detection: The indicator determines the current trend as: TREND_UP (Uptrend value = 1) TREND_DOWN (Downtrend val
Overview QuantumEdge Oscillator is a professional-grade trading indicator that combines advanced momentum analysis with sophisticated trend detection algorithms. This 30-day trial version provides full access to all features, allowing you to thoroughly test its capabilities in live market conditions before making a purchase decision. Key Features Dual-Signal System : Combines RSI moving average with smoothed ATR-based volatility bands Multi-Timeframe Analysis : Built-in support for higher timefr
FREE
The Zero Lag Least Squares Moving Average (ZLSMA) is an advanced moving average indicator designed to provide fast and smooth trend analysis while eliminating lag. It is based on the Least Squares Moving Average (LSMA) but incorporates a zero-lag calculation, making it highly responsive to price changes. This indicator helps traders identify trend direction with minimal delay, making it ideal for both short-term and long-term trading strategies.
Key Features: • Zero-Lag Calculation – Red
FREE

Volatility 75 Boom Crash VIX Pro V2 Volatility 75 Boom Crash VIX Pro V2 is a high-performance trading indicator specifically engineered for Synthetic Indices (Deriv) and Forex . This tool focuses on identifying institutional liquidity zones and generating high-accuracy, non-repainting signals based on Price Action and Fibonacci levels. Key Advantages: No Repainting: Once a signal arrow appears and the candle closes, it will never move or disappear. Institutional Liquidity Zones: Automatically ca

Welcome to HiperCube VIX Discount code for 25% off at Darwinex Zero: DWZ2328770MGM This indicator provide you a real info of market of volume of sp500 / us500 Definition HiperCube VIX known as the CBOE Volatility Index, is a widely recognized measure of market fear or stress . It signals the level of uncertainty and volatility in the stock market, using the S&P 500 index as a proxy for the broad market. The VIX Index is calculated based on the prices of options contracts on the S&P 500 inde
FREE
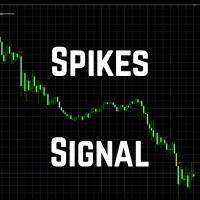
Spike Signal v1.2 — MT5 indicator that detects explosive Boom/Crash spikes and generates real-time scalp signals. TF:
Works on all timeframes (best on M1–M15). Pair:
Designed for synthetic Boom/Crash indices (Deriv), also adaptable to volatile assets. Settings: SpikeSensitivity / MinSize – spike detection sensitivity and minimum size EMA (8/21) – entry crossover signals RSI (14) – trend confirmation filter TP/SL Points – take profit and stop loss levels Trailing Exit / Alerts – dynamic exit lo

TrendScanner ALMA — A Lightweight Trend Watcher That Works Silently TrendScanner ALMA quietly monitors the trend status of your selected symbols and timeframes, scanning at regular intervals to detect subtle shifts and notify you—without cluttering your chart. Features ALMA-Based Trend Detection Built on the Arnaud Legoux Moving Average (ALMA), this scanner delivers smooth, responsive trend signals while filtering out market noise. Silent Monitoring of Trend Changes Detects not only uptren
FREE
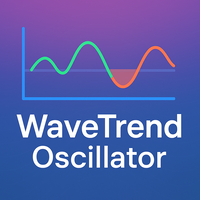
The WaveTrend Oscillator indicator is an enhanced version of the classic WaveTrend Oscillator, a momentum indicator. It is designed to identify overbought/oversold conditions and provide potential trend reversal signals. The core difference in this version is the application of a data "normalization" algorithm. This ensures the indicator's oscillation lines remain balanced around the zero line, causing the indicator window to always stay naturally centered. This is especially useful when trading
FREE

Displays a USD DXY chart in a seperate window below the main chart. YOUR BROKER MUST HAVE THESE SYMBOLS FOR THE INDICATOR TO WORK Based on EUR/USD, USD/JPY, GBP/USD, USD/CAD, USD/CHF and USD/SEK All these pairs must be added to Market Watch for the indicator to work correctly As this is calculated using a formula based on the 6 pairs it will only work when the market is open.
YOUR BROKER MUST HAVE THESE SYMBOLS FOR THE INDICATOR TO WORK
Displays a USD DXY chart in a seperate window below the m
FREE

Indicator IRush uses a modified version of a popular indicator RSI (Relative Strength Index) to look for entries on a daily chart or lower. The indicator has been set up and tested with the major symbols: AUDUSD, EURUSD, GBPUSD, USDCAD, USDCHF, and USDJPY. An automated trading with this indicator is implemented in the expert advisor Intraday Rush . This expert advisor can open, trail and close its trades. Check it out, it may be exactly what you are looking for!
A Correct Reading of IRush
The c
FREE

This indicator is very useful in observing the direction of the market. It allows users to enter multiple MA lines with specific display method. In addition, it is also possible to change the candle color same to color of the background of chart, so that we only focus on the MA lines. When a signal appears, represented by a red or green dot, we can consider opening a sell (red dot) or buy (green dot) order. Note: it need to set stoploss at the highest value of MA lines (with sell order) or lowe
FREE

This Indicator represents the standard Heikin Ashi Candle converter from normal candles. They are applied on a different chart, so you can identify easily both prices. You can also change candles to your favourite colours. If you want to, you can use this indicator into an iCostum, so you can apply other indicators over this on, because there are excellent indicators combined with this type of candles
FREE

Market Sessionsync** is a cutting-edge trading session indicator designed to enhance your trading experience by visually breaking down the market's daily rhythm. With a compact window overlaid on your chart, this indicator provides a split-second understanding of the current trading session through: Basic setup: Set Difference between your local time and your broker time , set DST(Daylight Saving Time) ON or OFF , set timescale sync you want to use (Local, Broker, CET) - A vertical time marker
FREE

RSI Divergence Lite (Free) - MT5 Indicator ------------------------------------------------- This is the Lite (free) version of RSI Divergence.
- Detects basic Bullish and Bearish divergence between price and RSI - Works only on M15 timeframe - No divergence lines, no alerts - Fixed internal settings (RSI 14, pivot sensitivity, thresholds) - For educational and testing purposes
For the full PRO version (multi-timeframe, alerts, divergence lines, advanced UI), please upgrade to RSI Divergence
FREE

Индикатор для синхронизации и позиционировании графиков на одном и более терминалах одновременно. Выполняет ряд часто необходимых при анализе графиков функций: 1. Синхронизация графиков локально - в пределах одного терминала при прокрутке, изменении масштаба, переключении периодов графиков, все графики делают это одновременно. 2. Синхронизация графиков глобально - тоже самое, но на двух и более терминалах, как МТ5, так и МТ4. 3. Позиционирование графика на заданном месте при переключении периодо
FREE
️ IMPORTANT: EVALUATION VERSION - LIMITED SYMBOL SUPPORT This indicator is currently available for EVALUATION PURPOSES ONLY and supports only: EURUSD Volatility 50 (1s) Index The indicator will not function on any other trading symbols. Richchild Quarters Theory Indicator EVALUATION Professional Market Structure Analysis Tool Overview This is a professional trading indicator designed to analyze market structure using dynamic range calculations and quarter-based price analysis. The indicator
FREE

Resistance and Support is an easy to use indicator to apply horizontal lines of resistance and support. There are two windows for adding levels. When you press the button, a line appears on the price chart. It is possible to move this line with the mouse, thereby changing the indicator readings. In the indicator menu there is a choice of possible alerts - no alert, alert on touching the level and an alert for closing the candle after the level.
FREE

This indicator shows current major support and resistance, if one exists. And as a support or resistance is broken it shows the new current, if any. To identify support and resistance points it uses the high and low points identified on the current chart. Allows too you to inform the maximum number of bars used to consider a support or resistance point still valid.
FREE

The indicator IQuantum shows trading signals for 10 symbols in the daily chart: AUDCAD, AUDUSD, EURUSD, GBPCAD, GBPCHF, GBPUSD, NZDUSD, USDCAD, USDCHF, and USDJPY.
Signals of the indicator are produced by 2 neural models which were trained independently from one another. The inputs for the neural models are normalised prices of the symbols, as well as prices of Gold, Silver and markers of the current day.
Each neural model was trained in 2 ways. The Ultimate mode is an overfitted neural model
FREE
If you love this indicator, please leave a positive rating and comment, it will be a source of motivation to help me create more products <3 Key Takeaways StochRSI is an oscillator that measures the RSI level relative to its high-low range over a period of time. It is more sensitive than the traditional RSI and can highlight overbought or oversold conditions in the market. StochRSI is typically used to generate more frequent and timely trading signals compared with the traditional RSI. StochRSI
FREE
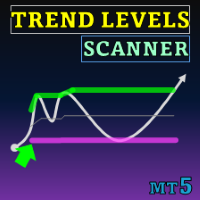
Special offer : ALL TOOLS , just $35 each! New tools will be $30 for the first week or the first 3 purchases ! Trading Tools Channel on MQL5 : Join my MQL5 channel to update the latest news from me The Trend Levels indicator is meticulously crafted to pinpoint critical trend levels—High, Mid, and Low—during market movements. With real-time calculations based on the highest, lowest, and mid-level values over a customizable lookback period, this tool provides traders with a structure

Quantopro Plus: Skyrocket Your Trading Success Unleash the power of precision with Quantopro , the ultimate trading indicator for MetaTrader 5 that transforms market chaos into profitable opportunities. Engineered with a cutting-edge proprietary formula, Quantopro delivers crystal-clear buy and sell signals, empowering traders of all levels to dominate the markets with confidence. Why Choose Quantopro? Dynamic Signal Painting : Instantly spot high-probability trades with vivid, real-time signals
FREE

Gatotkaca Support Resistance Trendline Indicator is a simple indicator that detects support, resistance and trendlines. It will helps you find breakout momentum based on lines calculated by this indicator. This is conceptually based on fractals, but with customizable periods. Compatible for any timeframes. You can customize how this indicator work by setting up the period input.
FREE
Linear Regression Channel (LRC) Indicator – Overview The Linear Regression Channel (LRC) indicator is a professional tool designed to display dynamic price channels around a regression trendline. It automatically adapts to market conditions, helping traders visualize price movement with clarity. Main Features : Regression-based central line with upper/lower channel boundaries. Fully customizable colors, styles, and levels. Optional labels and forward extensions for better chart visualizati
FREE

STRAT Price Action Scanner – See the setup, size the risk, place the trade. Important
To place trades directly from the Trade Assistant panel, you must also install the STRAT Price Action Trade Manager EA (check the comment section) on the same terminal. The indicator sends the trade instructions; the EA is the component that actually places and manages the orders. Installation Instruction (please read) Guide to the STRAT Trading Strategy Why STRAT? Most price action trading is
FREE

The Moving Average Slope (MAS) subtracts the moving average level n-periods ago from the current moving average level. This way, the trend of the moving average can be drawn on the moving average line.
Features Observe uptrends and downtrends at a glance. The indicator is non-repainting. Returns buffer values for the trend of the moving average to be used as part of an EA. (see below)
Inputs Moving Average Period : The period of the moving average (MA). Slope Period : Number of periods between
FREE

TrendScan is a visual scanner that detects bullish, bearish, or neutral trends across multiple symbols and timeframes. It analyzes market structure, EMA alignment, and price range to display clean, reliable signals. Ideal for traders seeking clarity and speed in their analysis.
Compatible with up to 25 symbols. Support for 8 timeframes. Advanced trend filters. Compact and customizable visual interface.

Non standard attitude to the standard moving average indicator. The essence of the indicator is to determine the strength and speed of the price direction by determining the tilt angle of the moving average. A point is taken on the fifteenth MA candle and a point on the last closed MA candle, a straight line is drawn between them, it is movable and on a hemisphere shows an angle of inclination from 90 degrees to -90. above 30 degrees is the buying area, below -30 degrees is the selling area. abo

SuperTrend Pro – Advanced Trend Detection Indicator (MT5) SuperTrend Pro is a modern, optimized trend-following indicator for MetaTrader 5 , designed to deliver clear trend direction, precise market structure, and a premium visual trading experience . It is based on an enhanced ATR-powered SuperTrend algorithm , combined with smart visuals, chart styling, and a real-time information panel. -Key Features - Advanced SuperTrend Logic Uses ATR (Average True Range) with adjustable Period and Multipli
FREE

Volume Profile Order Blocks - A smarter way to visualize liquidity, volume, and key levels. Volume Profile Order Blocks is a cutting-edge indicator that enhances traditional order block strategies by embedding a detailed volume profile directly within each zone. This provides traders with a clear, data-driven view of where institutional interest may lie — not just in price, but in volume distribution. MT4 Version - https://www.mql5.com/en/market/product/146267/ Join To Learn Market Depth - h

Hidden Edge – High-Low PreUS High-Low PreUS is a clean and lightweight indicator that marks key reference levels before the US session begins.
It draws a session box from 00:01 to 09:00 CET, identifying the high and low of the Asian session, and includes additional reference elements to support structured intraday trading decisions. Features Draws a rectangular range from 00:01 to 09:00 CET Marks the high and low of the session clearly Plots a horizontal yellow line as a suggested stop level bas
FREE

Вилка Нео v5, разрабатывалась для торговой системы "Оракул", но постепенно дополнялась, например - углами Ганна и другими опциями... Можно создавать графические объекты с заданным цветом, стилем и толщиной, такие как: прямоугольники с заливкой и без, отрезки трендлиний и нестандартный инструмент - "вилка Нео" в виде трезубца, так же есть возможность интерактивно настраивать цветовую палитру прямо с графика, настраивать видимость объектов для разных ТФ, толщину и стили...
Панель переключается кл
FREE

The Volume Spread Analysis indicator is based on the original Volume Spread Analysis method. It was designed for quick and easy recognition of VSA patterns. Even though this indicator looks very simple, it is the most sophisticated tool we've ever made. It is a really powerful analytical tool that generates very reliable trading signals. Because it is very user-friendly and understandable, it is suitable for every type of trader, regardless of his experience.
What is VSA? VSA - Volume Spread A

If you are (or were) a fan of the RSI indicator will love Tushar Chande's Dynamic Momentum Index indicator, that simply put is a dynamic variable lenght RSI, so it is more powerful. The DMI indicator internally uses a variable number of bars in its calculations, taking into consideration the volatility levels of the current market you are analyzing. This way, the DMI indicator will use more bars as volatility decreases and less bars when volatility increases, giving you a more powerfull analysis
FREE

When trading price action or using price action triggers such as Pbars, Inside Bars, Shaved Bars, etc. it is important to always wait for the bar/candle to close more than anything else.It is often the case (whether it’s the 4H, hourly, etc) that price action will be dominant in one direction for the majority of the candle only to reverse strongly at the end of the candle. Institutional traders know retail traders are less disciplined than they are. They know a good trading candle pattern coul
FREE
The Kalires Channel Indicator is a technical indicator used to evaluate trend direction and potential trading opportunities. This is a hybrid indicator that combines Kauffman Adaptive Moving Average (KAMA), linear regression and smoothing. The Kalires Channel Indicator consists of two lines: one central and two outer bands. The central line is a smoothed KAMA modified according to the direction of the trend. The outer bars represent two linear regression lines drawn above and below the center l
FREE
Easy Scalper Every Candle
MT5 Indicator is a technical analysis tool designed for gold (XAUUSD) and major forex pairs. It generates buy and sell signals on each candle using multiple filters, volume dynamics, and market structure logic. The indicator is developed for scalpers and intraday traders who require structured, rule-based signals without unnecessary complexity. Key Features 1. Candle-Based Logic Generates buy and sell signals on every candle. Uses multi-condition filters to reduce noise

This indicator that I am sharing publicly is an adaptation for MetaTrader 5 (MT5), and I want to make it absolutely clear that it is not my original work . The original code was published on the TradingView platform and can be freely accessed at the following official link:
TradingView – Original Indicator The reason for making it public on MetaTrader 5 is that I want more people to have free access to it, just as its original author shares it on TradingView. This publication is not intended
FREE

This is an OLD indicator which was rather efficient to be paired with MA Cross, Bollinger Bands, Dochian Channel and many other strategies and this provides you with market change of BEAR and BULL trends. Since there isn't much listed in MT5 Market, I would like to share my very own indicator for your usage. Please feel free to comment or criticize for better and improvement of the indicator listed.
FREE

MACD Histogram tracks the difference between the MACD line and the Signal line (which is the exponential moving average of the first line). For better visibility, when plotting the lines and the histogram in the same window, we scale up the histogram by a factor of 2. Furthermore, we use two separate plots for the histogram, which allows us to color-code the bars for upticks and downticks. The MACD Combo overlays MACD lines on MACD Histogram. Putting both plots in the same window enables you to

To review our products, please click the link: LINK This Classic Pivot Point Indicator accurately calculates and displays 7 essential pivot levels , including the Pivot Point , 3 Support levels (S1–S3) , and 3 Resistance levels (R1–R3) based on the standard classic pivot formula . Designed for Forex, indices, commodities, and crypto trading , it supports multi-currency and multi-timeframe analysis in a clean, professional dashboard interface . With the built-in interactive dashboard , traders c

The TrendOscillator Indicator is an upgraded version of the traditional Stochastic Oscillator. It comprises two lines: %K and %D. The %K line represents the current market position. In contrast, the %D line is a moving average of the %K line used to generate signals and identify potential entry or exit points. The good thing is the indicator works on all timeframes like the traditional Stochastic. However, to avoid any false signals, applying the indicator on longer timeframes is better
FREE

Great utility tool where you can monitor in real time the Laverage of your account and the spread of the symbol This will know how to accurately identify the data, to be able to know, for example, if you have a Prop Firm account, to know the correct Laverage and if the spread is manipulated, etc. to make a precise lotage
Combination of leverage and spread indicator. Tools for automating checking the leverage and spread on your trading account. Working in All broker forex stock. Useful to monit
FREE

Keltner Channels Enhanced - Professional Indicator with Alerts
Full Description:
Keltner Channels Enhanced is a professional-grade technical indicator that brings the classic Keltner Channels to a new level with advanced features and complete customization.
KEY FEATURES
Advanced Calculation Exponential Moving Average (EMA) based middle line. Average True Range (ATR) for dynamic channel width. Customizable price type (Close, Open, High, Low, Median, Typical, Weighted). Horizontal shift o
FREE

The MT5 platform indicator has standard settings and requires no modifications when connected to the chart. Modifying the indicator involves adding two functions: Marking the area when the indicator lines are in the correct sequence (green line above or below red and blue lines, and red above or below blue). This creates a confirmed cross marked by the closing price to avoid false signals during the Alligator lines' entanglement periods. Drawing horizontal rays from market structure break levels

Enhance your trading analysis with the Hull Suite MT5, a complete set of Hull Moving Average tools designed for smooth, low-lag trend visualization and enhanced precision. Developed from Alan Hull’s Hull Moving Average (HMA) concept introduced in 2005, this indicator integrates multiple Hull variations into a single flexible system, giving traders the ability to fine-tune responsiveness and visual style for clearer trend identification across forex, indices, commodities (like XAUUSD), and crypt

An efficient, on-chart button panel that lets you switch symbols instantly. Features auto-sync with Market Watch, custom grids, and a highly customizable UI.
Stop wasting screen space with the bulky standard Market Watch window. On Chart Watchlist places a sleek, customizable dashboard directly on your chart, allowing you to scan markets and switch symbols with a single click. Designed for manual traders, scalpers, and anyone who needs to navigate multiple pairs quickly, this tool keeps yo
FREE

A simple volume indicator according to the color of the candle!
- Custom background!
- Supports Volume by Ticks or Real Volume.
The original Metatrader Volume indicator does not show the colors of the bar according to the color of the Candle, it only changes color when the volume of a candle is greater than the previous one, this sometimes creates confusion for beginners and does not know the real reason for the color change.
Free indicator, support may take a while to respond!
FREE
Spike Detector Pro - Advanced Fast Movement Detection System Introducing Spike Detector Pro, a professional tool developed for traders seeking opportunities in fast price movements. This exclusive indicator combines sophisticated technical analysis with multiple confirmation layers to identify high-probability setups. Main Features: Specialized algorithm for detecting price spikes in advance Multi-layer filtering system (momentum, volume, volatility, and price action) Optimized configuration for

The indicator is designed for displaying the following price levels on the chart: Previous day's high and low. Previous week's high and low. Previous month's high and low. Each of the level types is customizable. In the indicator settings, you set line style, line color, enable or disable separate levels.
Configurations ----Day------------------------------------------------- DayLevels - enable/disable previous day's levels. WidthDayLines - line width of daily levels. ColorDayLines - line
FREE

Apex WilliamsR MT5 Looking for sharper entries? This indicator provides the foundation for visual price action. However, specialized markets require specialized tools. If you trade Gold or Indices, check out Gold Master Indicator or Nasdaq Master Indicator , specifically optimized for those assets' unique volatility. Don't just trade; trade with the right edge.
Apex Williams %R MT5 is a professional technical indicator that enhances the traditional Williams %R oscillator with advanced momentum
FREE

ATR Bands with Take-Profit Zones for MT5 Optimize your risk management and trading strategy with the ATR Bands indicator for MT5 – a powerful tool designed to help you navigate market volatility, identify key price levels, and set realistic stop-loss and take-profit targets. Key Features: ATR-Based Bands : The core of this indicator relies on the Average True Range (ATR) to calculate dynamic upper and lower bands that adapt to market volatility. The bands provide a clear indication of potential
FREE

Introducing our latest innovation in MetaTrader 5 indicators, designed to dramatically improve your trading workflow with high functionality and ease-of-use. It features a robust collection of features designed to help you streamline chart analysis and make the most of your trading decisions. Here's a quick rundown of its incredible features: Fast Drawing of Objects : Save precious time with the quick draw feature. With just a click of a button, you can create various trading objects on your ch
FREE

Limited Time Offer! Just $59 — valid until the end of this month! Trinity-X : The Next Generation of Trend Intelligence Imagine having a professional market analyst sitting beside you 24/7 — one who never gets tired, never misses a signal, and speaks your language.
That’s exactly what Trinity-X delivers. This AI-optimized, rule-based trend intelligence system is built on years of trading expertise, powered by a proprietary Rule-Based AI Optimization Engine .
It doesn’t just react to price movem

Do you find it difficult to track and manage your open positions across multiple different symbols in MetaTrader 5? Do you need a quick and comprehensive overview of your current market exposure and the performance of each symbol individually? The "Dynamic Exposure Table" indicator is your ideal tool! This indicator displays a clear and detailed table in a separate window below the chart, summarizing all your open positions and intelligently grouping them by symbol, giving you a complete view of
FREE

Trend Fuzzy Analyzer Purpose and Concept
The Trend Fuzzy Analyzer indicator assesses the strength and direction of the current market trend. It is based on the principle of Fuzzy Logic , which transforms quantitative readings from several standard technical indicators into a qualitative assessment of trend strength. Unlike binary signals, the indicator outputs a final value as a confidence level (from 0 to 100%). Core Working Principle The indicator simultaneously analyzes input data from f
FREE

MaRSI Scalper & Trader The combination of moving averages and RSI This setting is flexible so it can be set with regards to user test uses 1. For scalping 2. For long time trading
features 1. Sends push notifications 2. Sends alerts on computers 3. Draws Arrows 4. Draws respective indicators (this feature will be edited in the future)
Have feedback https://t.me/Tz_Trade_Logics or just call +255766988200 (telegram/whatsApp) Head to discussion page to leave your comments Improvement are on the
FREE

If you like this project, leave a 5 star review. As institutionals trade large volumes, it is not uncommon for them to try to
defend their position at specific percentage levels. These levels will serve as a natural support and resistance which you can use
either to enter a trade or be aware of possible dangers against your position. This oscillator will show you the percentage variation for the: Day. Week. Month. Quarter. Year. In a subwindow where you trace your supports and resistances.
FREE

This indicator automatically draws horizontal lines at 00s, 20s, 50s and 80s levels. If you trade ICT concepts and are an ICT Student, then you know that these levels are used as institutional support/resistance levels and/or fibonacci retracement anchor points. Features
Draws horizontal lines at 00, 20, 50 and 80 levels above and below current market price . Choose the amount of levels to show on chart Customizable line colors Recommended for forex currency pairs. Saves time looking for thes
FREE

Positions panel
This is a panel for counting current icon holdings. Convenient traders at any time to view the position and profit and loss situation. Perfect for traders who like to hold multiple orders at the same time. Main functions: Position statistics Total profit Average price calculation TP price calculation ST price calculation Positions valume
FREE
https://www.mql5.com/en/users/gedeegi/seller
GEN FXTrendZones GEN FXTrendZones is a technical analysis indicator designed to identify key price zones using Fibonacci retracement and extension levels, while also detecting market structure changes such as Break of Structure (BoS) and Change of Character (CHoCH). The indicator helps traders visualize critical swing areas and potential trend continuation or reversal zones. It includes a visual info panel and optional price alert system.
FREE
MrGoldTrend is a sophisticated trend-following indicator designed exclusively for XAUUSD (Gold) traders on the MQL5 platform. With clear, easy-to-interpret visual signals, this indicator helps you quickly identify the prevailing trend and make informed trading decisions on the H1 timeframe. MrGoldTrend’s gold lines indicate an uptrend, while blue lines signify a downtrend, providing immediate visual clarity for trend direction. Key Features: Clear Trend Visualization : Gold lines for uptrends, b
FREE
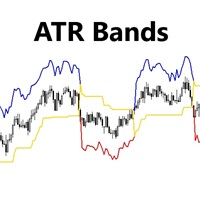
Indicator Shows ATR bands and Trailing Stop Line. Use it in your trend following strategy to improve your stop loss trailing and Trend. Adjust ATR Period and ATR Factor for your Symbol. This indicator has 3 outputs: 0- Upper Channel Data 1- Lower Channel Data 2- Main Line Data Please call me if you need more input parameters or modified version of this indicator.
FREE
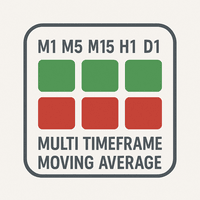
The "MultiTF Moving Average Panel" indicator is more of a helping tool than an indicator, it serves to help know the trend direction for the current currency pair of all timeframes in one place. It is best used with other indicators and signals, to help filter the signals according the trend based on multiple timeframes.
Indicator inputs : - Moving Average period : Default is set to 34. - Moving Average method : The method of calculation of the Moving Average. Default is set to Exponent
FREE

Tyr Bands Indicator (IC MARKETS GOLD). Just drag and drop. This indicators gets you entry points for the market. it is for gold, but you can configure for any other currency. Tyr Band works with BB and 3 different deviations, plus the Stochastic confirmation. So when the price closes below/above the BB Reversal Band (Red) and the Stochcastic is in the confirmation zone, then the arrow (buy/sell) appears. This arrow indicates that we can entry to the market up/down on the next opening. Since it i
FREE

MACD Scanner provides the multi symbols and multi-timeframes of MACD signals. It is useful for trader to find the trading idea quickly and easily. User-friendly, visually clean, colorful, and readable. Dynamic dashboard display that can be adjusted thru the external input settings. Total Timeframes and Total symbols as well as the desired total rows/panel, so it can maximize the efficiency of using the chart space. The Highlight Stars on the certain matrix boxes line based on the selected Scan M

This indicator is based on Mr. Mark Fisher's ACD strategy, based on the book "The Logical Trader."
- OR lines - A lines - C lines - Daily pivot range - N days pivot range - Customizable trading session - Drawing OR with the desired time Drawing levels A and C based on daily ATR or constant number - Possibility to display daily and last day pivots in color zone - Displaying the status of daily PMAs (layer 4) in the corner of the chart - Show the order of daily pivot placement with multi-day piv
FREE
Alpha Edge Pro – The Manual Trader’s Edge - If you prefer trading manually without stress, this indicator is for you. Get your copy now. Tired of missing the big moves or holding on to losing trades too long? Alpha Edge Pro is your new secret weapon. This high-performance, plug-and-play MT5 indicator gives you crystal-clear BUY and SELL signals — so you can trade with confidence, precision, and speed. If you prefer manual trading profitably , this indicator is made for you. Alpha Edge Pro does
FREE
All-In-One Supertrend Indicator for MT5 A comprehensive multi-source trend-following system that combines 20 different data sources with customizable Supertrend calculations to deliver robust trend analysis and trading signals. ======================================================================================== Key Features Multi-Source Architecture 20 diverse data sources working in perfect harmony Fully customizable parameters for each individual source Non-repainting signals with lightnin

The HighsAndLowsPro indicator for MetaTrader 5 marks local highs and lows in the chart. It distinguishes between weak and strong highs and lows. The line thicknesses and colours can be individually adjusted. In the default setting, the weak highs and lows are displayed thinner, the strong ones thicker. Weak highs and lows have 3 candles in front of and behind them whose highs are lower and lows are higher. The strong highs and lows have 5 candles each.
FREE
The MetaTrader Market offers a convenient and secure venue to buy applications for the MetaTrader platform. Download free demo versions of Expert Advisors and indicators right from your terminal for testing in the Strategy Tester.
Test applications in different modes to monitor the performance and make a payment for the product you want using the MQL5.community Payment System.
You are missing trading opportunities:
- Free trading apps
- Over 8,000 signals for copying
- Economic news for exploring financial markets
Registration
Log in
If you do not have an account, please register
Allow the use of cookies to log in to the MQL5.com website.
Please enable the necessary setting in your browser, otherwise you will not be able to log in.