Watch the Market tutorial videos on YouTube
How to buy а trading robot or an indicator
Run your EA on
virtual hosting
virtual hosting
Test аn indicator/trading robot before buying
Want to earn in the Market?
How to present a product for a sell-through
Technical Indicators for MetaTrader 5 - 104

Advanced Trading Chaos The main purpose of the indicator is to help the trader detect the signals described by Bill Williams in his books to make a quick and correct trading decision.
1)Bullish/Bearish Reversal Bar(BDB) 2) Divergent Bar(DB) 3) Second Sage Signal — the third consecutive Awesome Oscillator bar 4) Working fractals (Fractals that worked above/below the red forehead 5) Three bar coloring modes
5.1) Coloring of bars according to the AO indicator (Including the squatting bar)
5.2
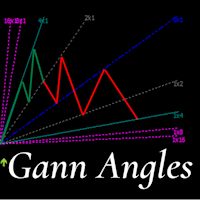
This indicator is, without a doubt, the best variation of the Gann Angles among others. It allows traders using Gann methods to automatically calculate the Gann angles for the traded instrument. The scale is automatically calculated when the indicator is attached to the chart. When switching timeframes, the indicator recalculates the scale for the current timeframe. Additionally, you can enter your own scales for the Gann angles. You can enter your own scales either for both vectors or for each

Visual EMA CrossPro - Your Ultimate Trading Companion! Are you ready to enhance your trading strategy with a powerful yet easy-to-use tool? Introducing the Visual EMA CrossPro, an intelligent indicator designed to help traders identify precise market entry and exit points based on EMA crossovers. For just $65, you get access to a reliable solution to simplify your trading journey. How It Works:
The Visual EMA CrossPro leverages two key EMAs (Exponential Moving Averages) to identify trends and p

The Visual EMA MultiFlex Indicator is designed to enhance your decision-making by combining the power of three Exponential Moving Averages (EMAs). Whether you're a beginner or an experienced trader, this tool helps identify precise market entries and exits. How It Works:
The Visual EMA MultiFlex Indicator leverages Short, Medium, and Long EMAs to analyze market momentum and confirm trend direction: Short EMA – Captures quick market shifts. Medium EMA – Smooths out short-term fluctuations. Long

The Visual EMA PriceSync Indicator is a cutting-edge trading tool designed to synchronize price action with EMA (Exponential Moving Average) trends. It helps you identify precise market entry and exit points, making it an essential tool for any trader. What does it do?
The indicator detects crossover signals between the price and EMA, which signify potential trend reversals or market corrections. These signals are displayed directly on your chart with clear and vibrant buy (lime green) and sell

The Visual EMA ReversalScout Indicator combines a powerful EMA crossover strategy with RSI-based divergence detection to generate reliable buy and sell signals. Its advanced logic ensures robust and actionable market insights while maintaining flexibility for optimization. Strategy Breakdown EMA Crossovers: Uses Fast EMA and Slow EMA to identify trend directions and reversals. Bullish signals arise when the Fast EMA crosses above the Slow EMA, indicating an uptrend. Bearish signals occur when t

Visual EMA SignalLine Pro – Your Ultimate Trading Companion Experience a smarter, more precise approach to trading with Visual EMA SignalLine Pro! This powerful indicator simplifies complex market analysis, allowing you to focus on what matters most: profitable trading decisions. Available now for just $65, this tool is your gateway to mastering trends, identifying entry and exit points, and managing trades like a pro. How Does It Work?
The Visual EMA SignalLine Pro combines the power of Expone

Adaptive Reversal Star is a new generation indicator with an advanced Adaptive algorithm , which additionally tracks potential reversal points and compares the values of the current market volatility when forming the main signals of the indicator.It provides accurate signals in real time without delays and redraws.Adaptive Reversal Star does not require any complex settings and additional calculations, just set it to the desired timeframe and select the parameter - Signal Filter. Why choose

VisualEMA TrendForce Indicator — Empower Your Trading with Precision Price: $65
Discover a Smarter Way to Trade with EMAs! The VisualEMA TrendForce Indicator is designed to elevate your trading with a reliable and visually intuitive trend-following system. Leveraging the power of Exponential Moving Averages (EMAs), this indicator provides actionable buy and sell signals based on dynamic market conditions, enabling traders to capture profitable trends with confidence. Core Features: Dynamic EMA

Visual CrossPulse Indicator - Revolutionize Your Trading! Take your trading to the next level with the Visual CrossPulse Indicator, a cutting-edge tool designed for precision and ease. This indicator combines powerful technical analysis with user-friendly features to identify profitable market opportunities effectively. What Makes Visual CrossPulse Special?
The Visual CrossPulse Indicator is a hybrid strategy tool that integrates the MACD (Moving Average Convergence Divergence) and an optional

The Pure Price Action ICT Tools indicator is designed for pure price action analysis, automatically identifying real-time market structures, liquidity levels, order & breaker blocks, and liquidity voids. Its unique feature lies in its exclusive reliance on price patterns, without being constrained by any user-defined inputs, ensuring a robust and objective analysis of market dynamics. Key Features Market Structures A Market Structure Shift, also known as a Change of Character (CHoCH), is a pivot
CrossPoint5 is an indicator that helps novice traders.
In addition to the standard "Crosshair" function (Ctrl + F), CrossPoint5 will show you how to set the StopLoss and TakeProfit levels correctly, taking into account the minimum allowable level, calculate the number of points between two points and convert this into the currency of the account, taking into account the expected lot of the transaction.
Sometimes, when opening a deal, a novice trader completely forgets about the spread.
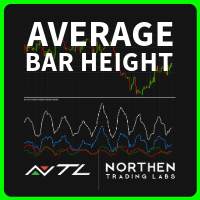
ABH - Candle Component Analysis - User Guide Overview and Features The ABH - Average Bar Height indicator is designed to help traders analyze market volatility and identify potential buy and sell signals by measuring the average size of each candlestick component over a specific period. The indicator calculates and displays four lines representing different candlestick metrics. By analyzing these values, traders can interpret market strength, volatility, and potential trend changes. Beyond

How to Add a Product Description (MetaTrader Market) To add the product description effectively in MetaTrader's Market, follow these steps: 1. Log into the MetaTrader Market: Go to your MQL5 account . Navigate to the "Seller's Dashboard" or "Products" section. Select your product, DuhokTrend . 2. Writing the Description: To enhance the product's rating, write a detailed and structured description : Template for Product Description:
DuhokTrend - Advanced Indicator for Trend Analysis Overview:

High Low Mid Daily Weekly Revolutionize Your Chart Analysis with Precision Levels! High Low Mid Daily Weekly is a powerful and intuitive indicator designed for traders seeking to elevate their technical analysis. This indispensable tool automatically plots the key price levels of the current day and week directly on your chart, ensuring you never miss crucial support and resistance zones. Key Features: Daily and Weekly Levels : Instantly displays today’s and this week’s High , Low , Mid levels

This indicator is for scalpers who want to make profit from recovery and retracements. As a scalping indicator, you won't win big but small and steady profits. How to use this? Open a stop buy order if the price close below the "Recovery" at the recovery price with a TP at the "Expected recovery". It's best to use with an EA to open orders automatically closing at the current "Expected recovery" instead of setting a TP. Doing so will ensure orders will close no matter where the price go without

Omega Support & Resistance
A unique indicator for buy low, sell high strategies Reversal type entries, as price rises to the full length line, expect price to turn/swing/reverse Can trade 1-5min charts with 4hr for interday setups or m15 and higher with daily, 1hr with weekly for long term setups
High precision future price predictor for high or low of any product for Weekly, Daily, 4hr and even 1hr charts Best to use SonicR color bar indictor or similar to avoid entry at certain levels, watc
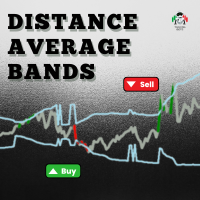
A very assertive and easy-to-view indicator, which can be used in any financial asset.
This indicator aims to show moments when the average price deviation in relation to the average deviation exceeds the configured standard deviation.
Step 1: We measure the distance between the price and the average configured in the "MAPrice" parameter;
Step 2: We calculate the average "MADistancePeriod" of the distances measured in Step 1.
Step 3: We calculate the standard deviation "Deviation" from th

Overview In the fast-paced world of forex and financial markets, quick reactions and precise decision-making are crucial. However, the standard MetaTrader 5 terminal only supports a minimum of 1-minute charts, limiting traders' sensitivity to market fluctuations. To address this issue, we introduce the Second-Level Chart Candlestick Indicator , allowing you to effortlessly view and analyze market dynamics from 1 second to 30 seconds on a sub-chart. Key Features Support for Multiple Second-Level
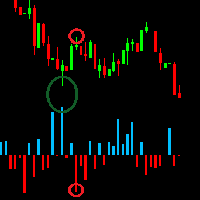
The Tick Volume Balance indicator is created based on the tick volumes of the instrument on the selected timeframe, taking into account the trading balance of supply and demand prices.
The indicator considers the nature of candle formation used in the Price Action strategy. With equal volume, a regular candle and a candle with a pattern will have a larger size and will be colored according to its pattern. I would like to note that large volume candles colored in bullish and bearish colors at t
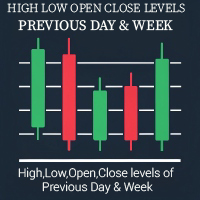
Revolutionize Your Chart Analysis with "Previous Daily Weekly HLOC Levels"! The Previous Daily Weekly HLOC Levels indicator is a must-have tool for traders who want to sharpen their technical analysis. This intuitive and powerful indicator automatically plots the High, Low, Open, and Close levels of the previous day and week on your chart, giving you a clear view of critical support and resistance zones. Key Features: Daily and Weekly Levels: Effortlessly displays the High, Low, Open, and Clos

I'll keep it Short and to the point. Let Your Backtest Results Speak for Themselves. After much deliberation, we’ve decided to release the foundational logic behind our process for public use.
This isn’t about changing the way you trade—because we know that’s unique to you. The best ways to enter a position? Those have always been confidential ! What we can share is the first of three essential steps we use before entering any trade. This tool is designed to keep you on the right side of the m

Introducing to your attention the unique trading system/indicator "Scaled Vidya Trends", designed for dynamic scalp trading on trend volatility pairs hour + timeframes.
Main features of Scaled Vidya Trends:
-Multi-level market analysis: it works on H1, H2, H3 timeframes; -Uses the most popular currency pairs: EURUSD, GBPUSD, USDCAD. Brokers usually set one of the lowest spreads for these pairs; -Applies a scalping method based on local targets for signals; -Signals appears at the new open of

The Easy Trend Trading Indicator delivers quick and accurate BUY/SELL signals, ensuring that traders can make timely decisions. It works flawlessly across various timeframes and supports all symbols, making it a versatile tool for any market. Whether you're trading short-term or long-term, this indicator adapts to your needs with ease. Quick Setup: Simply "Enable" the indicator via input settings With a low memory footprint, the indicator is designed for efficiency, ensuring smooth performance e

Overview "L3 Counter Peacock Spread" is a comprehensive technical analysis indicator for MetaTrader 5, developed by Blackmill Solutions UG. It employs a sophisticated combination of multiple moving averages, K-lines, and weighted analysis to provide traders with a robust set of visual tools for market analysis. Key Features Multiple Moving Average Analysis Combines short and long-term moving averages (MA1, MA3, MA10, MA30) Utilizes both Simple Moving Averages (SMA) and Weighted Moving Averages

Volume Weighted Average Price (VWAP) is a measure that combines price and volume data to reflect the average price at which a security has traded throughout a specific period. This indicator calculates the VWAP based on your selected timeframe and plots it on the main chart. It automatically identifies new sessions for the chosen timeframe and resets the calculation accordingly, ensuring that the displayed VWAP remains current. Use VWAP MTF to observe areas where trading activity is concentrate
Introducing to your attention unique trading advisor, Squeeze roc xau points, exclusively designed for trading on the XAU/USD pair. We analyzed predominantly all objectively important timeframes and identified unique characteristics of gold movements relative to the dollar to create this product. These insights can be extremely useful in predicting market reversal points on timeframes from M30 to H8 for the XAU/USD pair. You can choose your favorite timeframe to receive signals or use multiple
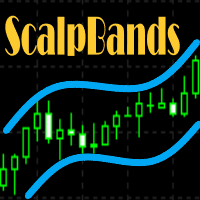
This indicator is designed for scalping Gold, BTC, US30, GBPUSD, and can also be used on any financial instrument. It does not repaint, erase past signals, and it is not lagging. The indicator is a combination of two well-known indicators: Bollinger Bands and TD Sequence. It has a relatively high win rate; however, it is not a complete system and should be used in conjunction with other indicators to filter noise, increase the win rate, and is intended for experienced scalpers. Always set reaso

Zone to Zone Indicator for MT5 Unleash the full potential of your trading strategy with the "Zone to Zone" indicator for MetaTrader 5. This advanced tool provides unparalleled precision and versatility, making it an essential addition to any trader's toolkit. Key Features: MT5 Compatibility : Seamlessly integrates with the MetaTrader 5 platform for a smooth and efficient trading experience. Accurate Historical Resistance/Support Zones : Effortlessly draw and identify key resistance and support

Take the stress out of trading with the Buy Sell Chill Indicator —your ultimate companion for effortless trend identification. This easy-to-use tool gives you a clear visual arrow to show the direction the market is about to take, making trading decisions as simple and "chill" as possible. Why Choose the Buy Sell Chill Indicator? Relaxed and Intuitive : Designed to make trading less stressful and more enjoyable by giving you straightforward signals with no clutter. Customizable Features : ATR Pe

EMA Scalper Indicator is an indicator of EMA lines and reversal EMA lines. Each pair of EMA channels area that can be used to make reversal entry. After the EMA lines are widening because of major trend, the area can be used to find profitable entry and exit, especially after EMA reversal. Do the cut loss whenever candle closed outside the area.
The A, B, C, D, and E area are colored differently. Solid lines: Normal EMA lines. Dashed lines: Reversal EMA lines.

Mtf Candle – An Advanced Tool for Your Trading Strategy Analyze the market, identify trends, and enhance your strategy! Mtf Candle is an innovative indicator designed for professional traders, offering a clear and structured way to visualize market dynamics. With this tool, technical analysis becomes structured and easily accessible. What Does Mtf Candle Offer? In-depth Bar Analysis – Monitor bars across multiple timeframes and determine whether they indicate an uptrend or downtrend. Precise St
Introducing to your attention a unique trading advisor "Detrended scalper jpy points" indicator, designed for trading with major JPY crosses.
The idea is based on a modified indicator, detrended price oscillator, whose task is to eliminate the influence of the trend on price movements. This greatly simplifies the process of determining overbought/oversold cycles. The focus is on analyzing short cycles: long market cycles consist of several short ones. By analyzing the short components, we can

Detailed Explanation of the Order Block Indicator What is an Order Block? An Order Block refers to a specific price zone where institutional traders (e.g., banks, hedge funds) have placed a large number of buy or sell orders. These zones are critical because they often mark areas of significant market reversals, continuations, or breakouts. In simpler terms, it's a region on the chart where the "big players" have left their footprints. Traders use these zones to predict price behavior—whether th
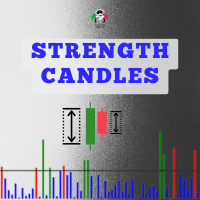
Indicator in histogram format, which is calculated using data on financial volume, tick volume and the body of the bar.
It is possible to visualize moments where there was a large entry of volume, both financial and in ticks, and that the market managed to progress and advance in one direction (up or down) due to the size of the bar body, which is where there really was a victory for one side of the negotiation (buyers and sellers).
By default, all bars in the indicator's histogram are colore
The Moving Average indicator remains one of the most popular tools in trading due to its simplicity, adaptability, and effectiveness in identifying market trends. Its role as a foundational tool for other technical indicators further cements its importance in both traditional and modern trading strategies.
The Multi MA indicator has 8 Moving Averages which can be plotted simultaneously using a unique set up of each MA.
Make Your Trading Simple dan Profit Again !
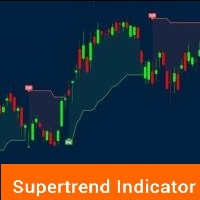
SuperTrend Indicator with Alerts Overview
The SuperTrend Indicator is a trend-following tool that helps traders identify market direction and potential reversals using a combination of: Commodity Channel Index (CCI): Detects momentum shifts and confirms trends. Exponential Moving Average (EMA): Acts as a trend filter to enhance signal accuracy. SuperTrend Lines: Visual trend markers for clear buy and sell signals. This indicator provides real-time alerts and visual markers to help traders reco

MACD indicator, first indicator, loading 3 cycles, 3 windows, 5-minute, 1-hour, 1-day chart, accurate comparison ,Can be used in conjunction with my EMA metrics, The other moving average indicator I sell on MQL5 can prevent volatile market conditions, The signal line needs to be fixed after the color changes, and then the signal direction can be confirmed,For example, for a 5-minute chart, you need to wait until the next 5 minutes to confirm that the signal direction is good

The indicator automatically identifies and labels essential elements of market structure shift, including: Break of Structure (BoS): Detected when there is a significant price movement breaking previous structural points. It mark possible uptrend and downtrend lines(UP & DN, It means constantly update high and low ), and once the price breaks through these lines, mark the red (BEAR) and green (BULL) arrows. BoS typically occurs when the price decisively moves through swing lows or swing highs t

Trade with Confidence: Understand the highs and lows of each session with live comparisons to previous period changes. Monthly Movement Tracking: Compare this year's performance with last year's to gauge market sentiment. Percentage Change Analysis: Helps avoid overpaying or underselling by showing price movement changes. Profit Overview: Instantly view your profit for different periods, including daily, weekly, and current values. Symbol Performance: Track the movement of any selected trading
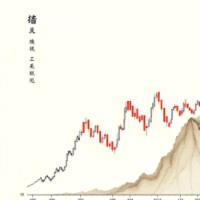
The principle behind this indicator is lost,In theory, In theory, it can load infinitely on the chart, but requires different parameters,Recommend 5, 10, 20,This indicator is more accurate in 5 minutes, 1 hour, and 1 day,Can be combined with my MACD to use together, https://www.mql5.com/zh/market/product/129184?source=Site +Profile+Seller ea, Indicator,Strategy Analysis,strategy optimization,Need to write,Provide strategy,Write EA, indicators,contact Telegram @r24231
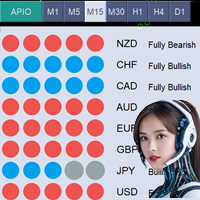
*Current Price Of Product Is 49$ For Limited Time, Next Price Of All Power In One Is 99$* All Power In One (APIO) Indicator The All Power In One (APIO) indicator is a robust tool designed to evaluate the strength of major currencies, including USD, EUR, GBP, and others. By analyzing the movements and directions of various currency pairs across selectable timeframes, APIO provides traders with clear insights into currency strengths and potential trading opportunities. MT4 Version of APIO is avai

HistoEdge Indicator Welcome to the world of precision trading tools! Introducing HistoEdge, a powerful and customizable MetaTrader 5 indicator designed to provide you with the insights you need to make informed trading decisions. Please note: HistoEdge is not optimized by default; it is designed for traders like you to fine-tune and unleash its full potential according to your strategies. Key Features
Advanced MACD Histogram Visualization:
Utilizes the MACD (Moving Average Convergence Divergenc

Introducing the DivergenceSpotter Indicator!
Note: This indicator is not pre-optimized—it’s crafted for you to customize and optimize to suit your unique trading strategies! The DivergenceSpotter Indicator is your ultimate tool for identifying divergences in the market, giving you an edge in spotting potential trend reversals and continuation opportunities. Whether you're a novice trader or a seasoned expert, this powerful tool is here to elevate your trading game. How It Works:
The DivergenceS

MACD Momentum Shift Unleash the Power of Momentum in Your Trades
The "MACD Momentum Shift" is an advanced trading indicator based on the renowned Moving Average Convergence Divergence (MACD). It’s crafted to give you the tools you need to optimize and adapt it for your personal trading style. Your Customizable Edge
This indicator isn't pre-optimized—it's designed for you to take control. Modify MACD fast, slow, and signal periods, as well as the delay between signals, to suit your preferred str

Introducing the Phoenix RSI Indicator – your gateway to mastering market momentum and identifying profitable trading opportunities! Designed for traders who value control, this indicator comes pre-equipped with powerful features but is intentionally left unoptimized to empower YOU to tailor it to your unique trading strategy. What Makes the Phoenix RSI Indicator Special? Customizable RSI Analysis: Visualize market momentum with a sleek RSI line directly on your chart. Adjust the RSI period to s

Introducing "Dragons Pulse"
Are you ready to take your trading strategies to the next level? The Dragons Pulse Indicator is a powerful tool designed with flexibility in mind, empowering you to optimize it according to your unique trading style. While not pre-optimized, this indicator provides you with a foundation to unleash your creativity and craft strategies that truly work for you! Key Features: RSI-Based Insights: Uses the trusted Relative Strength Index (RSI) to analyze market momentum. P

Storm Seeker Indicator
Unleash the power of precision trading with the Storm Seeker Indicator! This tool is designed for traders who want to take charge of their strategies by customizing and optimizing a powerful divergence-based system. Why Choose Storm Seeker? Divergence Analysis: The indicator identifies potential reversals by detecting divergences between price action and the RSI oscillator, giving you clear buy and sell signals. Visual Clarity: Green arrows indicate potential BUY opportun

Crystal Cross RSI Introducing the Crystal Cross RSI indicator—crafted for traders who seek control over their strategy! This tool is not pre-optimized, leaving room for you to fine-tune and adapt it to your trading style. Key Features: Clear Buy and Sell Signals: Lime arrows highlight buy opportunities, while red arrows signal sell entries—keeping your decisions sharp and informed. Dynamic RSI Analysis: The blue RSI line tracks market momentum, complemented by a signal line for precise crossing

Desert Mirage Indicator Take your trading to the next level with the Desert Mirage Indicator! Designed with flexibility in mind, this tool is your ultimate companion for identifying lucrative opportunities in the forex market. Please note: this indicator is not optimized—it’s built for you to customize and tailor to your unique trading style! Key Features: RSI-Based Signals: Harness the power of the Relative Strength Index (RSI) to spot overbought and oversold market conditions with ease. Gener

Introducing the Thunder Wave Indicator
The Thunder Wave Indicator is a powerful tool designed for traders who love to optimize and tailor their strategies. This indicator is not pre-optimized, giving you full control to adjust it according to your trading style and market conditions. Why Choose Thunder Wave?
The Thunder Wave Indicator leverages the Relative Strength Index (RSI) to deliver actionable insights, while incorporating delay and visualization features to ensure precision and clarity.

Welcome to the Ocean's Gate Stochastic Indicator! Note: This indicator is not optimized by default—it has been crafted for you to tweak and optimize based on your unique trading style! Dive into precise decision-making with this advanced trading tool that harnesses the power of the stochastic oscillator. The Ocean's Gate Stochastic Indicator not only visualizes overbought and oversold conditions but also identifies critical crossovers, allowing you to anticipate market movements with confidence
Mountain Echo Indicator
Your key to uncovering trade opportunities, designed for custom optimization.
Price: $65 Key Features:
Visual Buy and Sell Signals
The indicator places visually appealing arrows directly on your chart: Lime Green Arrows indicate potential buy opportunities. Red Arrows signal potential sell opportunities. Customizable Stochastic Parameters
Includes key inputs like: %K Period (default: 14) %D Period (default: 3) Slowing (default: 3) Bars to Wait Between Signals (default: 1

STRICTLY FOR BOOM INDEX ONLY!!!!! Here I bring the Maximum Trend Arrows OT1.0 MT5 indicator. This indicator is made up of a combination of different trend indicators for entries and exits, for entries an orange arrow will paint on the chart below the current market and a red flag for closing of trades and it produces buy arrows only. When the orange arrow appears, it will appear along with it's sound to notify you. The 1H timeframe is recommended, don't use it anywhere else than on the 1H timefr

Introducing the Star Path Stochastic Cross Indicator Ready to explore your trading potential? The Star Path Stochastic Cross Indicator is here to guide your path. Designed for traders who love flexibility, this indicator is not optimized, giving YOU the freedom to tailor it to your strategies. Whether you're a beginner or an experienced trader, this tool is the perfect addition to your toolkit. The Logic Behind the Indicator
This indicator leverages the powerful stochastic oscillator to identif

Introducing Wind Dancer Indicator Ready to take control of your trading journey? The Wind Dancer Indicator is here to empower your strategies with a unique, visually intuitive approach. Designed with flexibility in mind, this indicator is not optimized, giving you the creative freedom to fine-tune and adapt it to your specific trading needs. How Does the Wind Dancer Indicator Work? The logic behind the Wind Dancer Indicator is a blend of sophisticated signals and a seamless visualization algori

Introducing the River Flow Divergence Indicator Are you ready to unlock your trading potential? Meet the River Flow Divergence Indicator, a powerful tool designed to help you navigate market trends and reversals with precision. This indicator is tailored for traders who are eager to fine-tune their strategies and take control of their success. Note: This indicator is not optimized out of the box. It’s crafted for you to customize and optimize according to your unique trading style and goals. Ho

Discover the untapped potential of market range trading with the Forest Shadow Indicator! Designed for traders who want to optimize their strategies, this tool provides raw, powerful insights into market trends and turning points. Note: The indicator is unoptimized, offering you full flexibility to tailor it to your unique trading needs. Core Logic:
The Forest Shadow Indicator uses a combination of stochastic momentum and visual signals to highlight potential buy and sell zones within range-bou

ZLMA Trend Candles indicator uses an enhanced Zero-Lag Moving Average to highlight key trend shifts, repainting candles in real time. It reacts faster than traditional moving averages, helping you spot potential market turns earlier. Gain clear entry and exit signals and filter out market noise with ease! This product is also available for MetaTrader 4 => https://www.mql5.com/en/market/product/129279 1. What Is ZLMA Trend Candles?
ZLMA Trend Candles is a MetaTrader 4/5 indicator based on the Z
Индикатор ProfitAndDistance.
Этот пользовательский индикатор для MetaTrader 5 предназначен для отображения полезной информации о текущих позициях и их прибыли прямо на графике. Он автоматически обновляется каждую секунду и отображает важные данные, такие как прибыль, расстояние до последней открытой позиции, количество открытых позиций и тип последней сделки. Индикатор будет полезен как новичкам, так и опытным трейдерам, желающим легко отслеживать свои позиции в реальном времени. Основные особе

Moon Touch Indicator
Unlock the full potential of your trading strategy with the Moon Touch Indicator! This advanced tool is designed for traders who want to fine-tune their approach and optimize their results. While the indicator isn't pre-optimized, it gives you the flexibility to tailor it perfectly to your trading style and market conditions. How Does It Work?
The Moon Touch Indicator is a versatile signal tool that works by identifying key market conditions: Buy and Sell Signals: Clearly m

Not Optimized – Created for Your Custom Optimization!
Introducing Diamond Crush – your pathway to mastering market squeezes! This indicator is designed to identify powerful trading opportunities by analyzing market conditions and visualizing key areas of market compression and expansion. Why Diamond Crush? Band Squeeze Analysis: Harness the power of dynamic upper and lower bands to capture market volatility and trend shifts effortlessly. Buy & Sell Signals: Visual cues guide you through potenti

Solar Flare Indicator
The Solar Flare Indicator is a versatile and customizable tool designed for traders who value precision and adaptability. Built to empower traders of all levels, this indicator highlights key market dynamics to support strategic decision-making. Please note, the indicator is provided without pre-optimization, giving you the freedom to tailor its settings to your specific needs. Behind the Strategy – How It Works:
The Solar Flare is rooted in a combination of technical anal

Cosmos Dance Indicator The Cosmos Dance Indicator is your next powerful tool in financial trading, designed for traders who value precision and flexibility. This indicator is not pre-optimized, giving you the freedom to fine-tune and adapt it to your specific trading strategy. With Cosmos Dance, you hold the reins to enhance your trading edge. Key Features and Logic: Clear Buy and Sell Signals: Visual arrows for "Buy" (green) and "Sell" (red) opportunities, helping you identify potential market

Aurora Cross: Your Customizable Path to Trading Success! About This Indicator
The Aurora Cross Indicator is designed to empower traders to refine and optimize their strategies. It’s a versatile tool created specifically for you to customize and tailor to your unique trading approach. It is not pre-optimized, giving you complete freedom to experiment and find the perfect settings for your trading style. How It Works
At its core, the Aurora Cross Indicator leverages advanced technical analysis te

Unlock the Power of the Storm Break Indicator The Storm Break Indicator is a cutting-edge tool designed to identify precise market entry points using the proven logic of Bollinger Bands. While this indicator is not optimized out of the box, it offers you an exceptional opportunity to tailor it to your trading style and maximize its potential. What Makes the Storm Break Indicator Unique? Core Logic: The indicator leverages Bollinger Bands, a time-tested technical analysis tool, to identify overb

Unleash Market Volatility with the Titan Force Indicator! Are you ready to dominate the market by capitalizing on volatility? The Titan Force Indicator is your ultimate trading tool, designed for traders who thrive during periods of heightened market activity. Not Optimized for You – Yet! This indicator is a canvas for your creativity. It's been crafted to let you optimize it according to your unique trading strategies and preferences. Your skills, your edge! How Does the Titan Force Indicator

Lion’s Roar - Trend Strength Indicator Are you ready to take control of your trading journey? The Lion’s Roar - Trend Strength Indicator is here to help you identify and harness powerful market trends with precision and confidence. Designed with traders in mind, this advanced tool is built on a robust strategy that combines trend direction with momentum validation using the Average True Range (ATR). This indicator is not pre-optimized, giving YOU the freedom to tailor it to your unique trading

NTL Market Times Indicator The NTL Market Times Indicator for MT5 provides a clear unobtrusive display of the opening and closing times of the world’s major Forex trading centers. It automatically adjusts for UK daylight saving time, ensuring reliable market session information all year round. Main Features Major Markets: Displays New York, London, Frankfurt, Sydney, and Tokyo trading hours. Color-Coded Sessions: Each market session is uniquely color-coded for quick identification on the chart.
HLines User Guide Overview and Features The NTL HLines Indicator is designed to elevate your trading with precise support and resistance analysis. Utilizing a sophisticated algorithm, this MQL5 indicator scans for high-probability price levels across multiple timeframes, helping traders pinpoint strategic entry and exit zones. With fully customizable pivot scanning and multi-timeframe support, HLines provides a powerful, adaptable toolset for traders of all experience levels. Key features includ
The MetaTrader Market offers a convenient and secure venue to buy applications for the MetaTrader platform. Download free demo versions of Expert Advisors and indicators right from your terminal for testing in the Strategy Tester.
Test applications in different modes to monitor the performance and make a payment for the product you want using the MQL5.community Payment System.
You are missing trading opportunities:
- Free trading apps
- Over 8,000 signals for copying
- Economic news for exploring financial markets
Registration
Log in
If you do not have an account, please register
Allow the use of cookies to log in to the MQL5.com website.
Please enable the necessary setting in your browser, otherwise you will not be able to log in.