Watch the Market tutorial videos on YouTube
How to buy а trading robot or an indicator
Run your EA on
virtual hosting
virtual hosting
Test аn indicator/trading robot before buying
Want to earn in the Market?
How to present a product for a sell-through
Technical Indicators for MetaTrader 5 - 34

Neural Levels Indicator – Precise AI-Based Market Levels Unlock next-level trading precision with the Neural Levels Indicator, a powerful market analysis tool built on advanced price-action principles and inspired by cutting-edge neural networks. Instantly identify three key neural trading levels directly on your chart:
Neural Level 1 Purpose: Crucial equilibrium level, ideal for identifying market balance points and potential turning zones.
Neural Level 2 (Optimal Entry) Purpose: Indicates p
FREE
SmartRSI Pro – Intelligent RSI Signal Indicator for Smart Traders SmartRSI Pro is a next-generation RSI-based indicator designed to give traders clean, reliable, and actionable buy/sell signals directly on the chart. Built on the popular Relative Strength Index (RSI) , this tool adds smart logic to filter out market noise and reduce false signals — making it ideal for both beginners and advanced traders . Key Features: Automatic Buy/Sell Arrows
Clearly visible up/down arrows based on cu
FREE

If you love this indicator, please leave a positive rating and comment, it will be a source of motivation to help me create more products <3 How to use Aroon Indicator? The AroonUp and the AroonDown measure the strength of the uptrend and the strength of the downtrend, respectively. These lines fluctuate between zero and 100. Values close to 100 indicate a strong trend and values near zero indicate a weak trend where the lower the AroonUp, the weaker the uptrend and the stronger the downtrend,
FREE

The MP Andean Oscillator is used to estimate the direction and also the degree of variations of trends. It contains 3 components: Bull component, Bear component and Signal component. A rising Bull component indicates that the market is up-trending while a rising Bear component indicates the presence of down-trending market. Settings: Oscillator period: Specifies the importance of the trends degree of variations measured by the indicator. Signal line per: Moving average period of the Signal line
FREE

VWAP FanMaster: Master the Pullback Strategy with Precision!
The VWAP FanMaster is the ultimate indicator for traders seeking accurate entries and efficient pullbacks . It combines the power of VWAP (Volume Weighted Average Price) with Fibonacci Fan lines , providing a clear map of high-interest zones in the market. Key Features Simple yet powerful : Just move the vertical lines, and the indicator automatically draws both VWAP and Fibonacci Fan lines.
Smart trading strategy : Wait f
FREE

SMARTMASS INDICATOR
This indicator is different from all known volume indicators. It has a significant distinction; it is an algorithm that relates price movement to volume, attempting to find proportionality and efficient movement while filtering out noise and other movements that are more random and do not follow a trend or reversal. Ultimately, it reveals the true strength of the movement, indicating whether it has genuine support from bulls or bears or if it's merely a high-volume movement

Introducing the "Super Trend Filter Oscillator," your ultimate trading companion designed to enhance your technical analysis and help you make informed decisions in the financial markets. This innovative oscillator is crafted to provide valuable insights into market trends and price movements, assisting traders like you in identifying potential entry and exit points. Features: Trend Identification: The Super Trend Filter Oscillator excels in detecting prevailing market trends, whether they are b
FREE
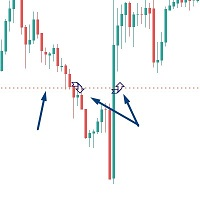
Introductory Offer! *** Only $47 - normal price $97 !! *** Ends soon - don't miis it!! The Close Above or Below Price Indicator is part of my suite of Price and Trendline Alerts Indicators. I'm excited to introduce the Close Above or Below Price Indicator – part of my new suite of Price and Trendline Alert Indicators – fantastic tools designed to alert you when candles close above or below significant prices in the markets you trade. With this indicator, you can set up to 4 price alerts on a

This indicator shows current major support and resistance, if one exists. And as a support or resistance is broken it shows the new current, if any. To identify support and resistance points it uses the high and low points identified on the current chart. Allows too you to inform the maximum number of bars used to consider a support or resistance point still valid.
FREE

VWAP Ultimate Pro MT5 – Anchored VWAP | Session VWAP | Dynamic Bands & Smart Alerts Elevate Your Trading Edge with the Ultimate Institutional‑Grade VWAP Indicator
WHY PROFESSIONAL TRADERS CHOOSE VWAP ULTIMATE PRO?
VWAP (Volume‑Weighted Average Price) is the gold standard used by institutions, hedge funds, and professional traders for identifying fair market value. VWAP Ultimate Pro MT5 brings this institutional power to retail traders with an all‑in‑one indicator, integrating advanced VWAP mo

This spread indicator displays the actual spread of each candle. It highlights the maximum spread and the minimum spread of the chosen symbol. This indicator is very helpful to see in real time the spread evolution helping to avoid taking a trade when the spread is too high.
Inputs:
Print value in Points: if true displays the spread as a whole number
D isplay minimum and maximum spread of the past N days: select the number of days to consider the maximum and minimum spread
Automatically adj
FREE
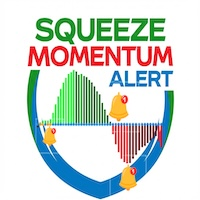
Squeeze Momentum Alert 1. Identifies Price "Explosion" Points (The "Squeeze") The greatest advantage of this indicator is its ability to catch periods where the market is "consolidating" or "gathering energy" before a massive move. Why it's good: Markets cycle between periods of calm (consolidation) and bursts of volatility (explosions). This tool tells you, "The chart is currently compressing tightly; get ready for the next big surge," ensuring you don't miss the start of a major trend. 2. Dist

English ICT_SuperTrend is an "All-in-One" tool designed to help traders see the complete market picture without needing to open multiple overlapping windows. Here are the main advantages of this indicator: Hybrid Trading System The biggest advantage of this tool is combining Trend Following with Smart Money Concepts / ICT (Price Structure) . SuperTrend: Tells the main market direction, whether to look for Buy or Sell trades. ICT Concepts: Identifies structural key points such as important suppor

Necessary for traders: tools and indicators Waves automatically calculate indicators, channel trend trading Perfect trend-wave automatic calculation channel calculation , MT4 Perfect trend-wave automatic calculation channel calculation , MT5 Local Trading copying Easy And Fast Copy , MT4 Easy And Fast Copy , MT5 Local Trading copying For DEMO Easy And Fast Copy , MT4 DEMO Easy And Fast Copy , MT5 DEMO Fibo: from KTrade 1. Automatically calculate and analyze the band. -> Get the desired band 2.
FREE
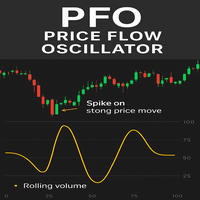
PFO Price Flow Oscillator – MT5 Indicator
The PFO Price Flow Oscillator is a highly advanced tool designed to help traders anticipate explosive price movements and identify market momentum with precision.One of its most powerful features is the ability to anticipate explosive price moves before they occur, giving traders an early edge in volatile markets. Unlike standard oscillators, the PFO does not rely on price alone—it integrates multiple market factors to provide clear, actionable insight
FREE

Indicators are for trend followers!
A trading system constructed by three moving averages. Trade with the trend and let profits run. Necessary for traders: tools and indicators Waves automatically calculate indicators, channel trend trading Perfect trend-wave automatic calculation channel calculation , MT4 Perfect trend-wave automatic calculation channel calculation , MT5 Local Trading copying Easy And Fast Copy , MT4 Easy And Fast Copy , MT5 Local Trading copying For DEMO Easy And Fast Copy ,
FREE
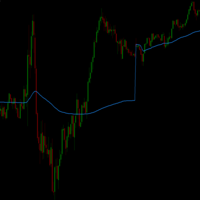
VWAP_PC_MQL5 — a simple home-built VWAP indicator showing real-time volume-weighted price levels directly on your MT5 chart. TF:
Works on all timeframes. Pair:
Compatible with all symbols — Forex, indices, commodities, and stocks. Settings: Applied Price – price type used for VWAP calculation (Close, Typical, Weighted, etc.) Line Color / Width / Style – customize VWAP line appearance Session Reset – optional reset per day or continuous mode How it works (VWAP principle):
VWAP (Volume Weighted
FREE

VR Cub is an indicator for getting high-quality entry points. The indicator was developed to facilitate mathematical calculations and simplify the search for entry points into a position. The trading strategy for which the indicator was written has been proving its effectiveness for many years. The simplicity of the trading strategy is its great advantage, which allows even novice traders to successfully trade with it. VR Cub calculates position opening points and Take Profit and Stop Loss targe

The Martinware Manual Trading Helper indicator is aimed at helping people start their lives in manual trading. It can be used to display both some generic images at the right side of the graph, where custom operational remarks may be displayed or just a blank rectangle hiding the chart while backtesting. Moreover, it can periodically play a list of sounds. To show a blank rectangle, let the first image name input field empty and select the desired color. To show one or more custom images inste
FREE
The Rayol Code Hour Interval Lines indicator was designed to assist your trading experience. It draws the range of hours chosen by the user directly on the chart, so that it enables traders to visualize price movements during their preferred trading hours, providing traders a more comprehensive view of price movements and market dynamics. This indicator allows the user to choose not only the Broker's time, but also the Local time. This way, the user no longer needs to calculate local time in
FREE

The Relative Equilibrium index (REi) is a technical analysis indicator that shows the direction and strength of a trend and indicates the probability of its change. It shows the ratio of the average price increase to the average fall over a certain period of time. The value of the index allows you to assess whether buyers or sellers had a stronger influence on the price over a set period of time and to assume further developments. The indicator is characterized by simplicity of interpretation an
FREE

It is the very same classic Stochastic indicator, but with a little twist: NO NAME and data is shown in the sub window. It could be stupid, BUT, if you are running out of space in Micro windows like Mini Charts, where the indicator's name is totally useless, you came to the right place. And that's it! I know it seems stupid but I needed the classical version of Stochastic indicator without that annoying name on my Mini Chart, so I did it that way... The original formula is right from Metaquote's
FREE

This is just a ADX with multi symbols, multi timeframes, and colors. features. different symbols and timeframes from the main chart. draw ADX and ADX moving average. easy to identify if ADX is above 25 or not. e asy to identify if ADX is above moving average or not. easy to identify the direction of the trend by color, not by DI line. unnecessary DI lines can be erased
FREE
Multi-Period EMA is a convenient indicator that displays multiple Exponential Moving Averages (EMAs) on a single chart. It is designed to help traders easily identify market trends and key crossover points without the need to add multiple individual EMA indicators. Key Features: Multiple EMAs in one: Simplifies chart analysis by combining several EMA lines into one indicator. Fully customizable: Easily change the period (default 20, 50, 100, 200), color, and thickness of each EMA line. Clean in
FREE
Read detailed blogpost with screenshots here: https://www.mql5.com/en/blogs/post/764306
Note: This is the MT5 only version. The MT4 version is available here: https://www.mql5.com/en/market/product/149941
Features Kalman smoothing to reduce market noise. Supertrend bands for trend direction. Color-coded dots and arrows for quick reading. Arrow signals for trend continuation. Alerts for trend changes. Adjustable inputs for different styles.
How to Use
Green dots = bullish bias. Red dots = bea

BinaWin NoTouch is an indicator that sends an alert signal when the trade is in the right position to wait for the breakdown of a side market.
It is specially designed to trade under the “No Touch” strategy of the Binary.Com platform with synthetic indexes N.10, N.25, N.50, N.75 and N.100
Similarly, trading can be done with the conventional CALL and PUT strategy of any Binary Options platform.
Requirements to use the indicator:
1. Have an account at Binary.Com
2. Configure the Binary.Com d
FREE

Классический индикатор фракталов является запаздывающим, т.к. для подтверждения образования фрактала необходимо ждать 2 бара. Если этого избежать, то индикатор будет перерисовывающим, т.е. при обновлении максимума/минимума в течении 2-х баров фрактал будет менять своё положение на более позднее. В данном продукте максимально нивелированы оба этих недостатка, при этом совмещены достоинства обоих подходов! Индикатор показывает фрактал сразу в момент его образования, а в случае его обновления показ
FREE

Free for now, price is going to be 30 USD at Jan 1. 2025.
Features: Pin Bar Detection : The indicator is designed to identify bullish and bearish pin bars based on specific criteria, including the relative size of the candle’s body and shadow, as well as the position of the candle's body in relation to the 38.2% Fibonacci level. Customizable Labels : Custom text is displayed above each identified bullish or bearish pin bar, such as "[38.2]" for bullish and "[-38.2]" for bearish, helping traders
FREE

The DFG Chart Indicator displays the historical DFG levels used in the DFG dashboard. These levels are generated dynamically using moving averages and Fibonacci ratios. The Fibonacci Bands automatically adjust to reflect changes in the price range and trend direction. The indicator also features buttons for selecting chart symbol and timeframe, along with a wide range of customization options. Key Features Dynamic DFG Levels
Automatically calculated using moving averages and Fibonacci ratios. H
FREE

Reversal Oscillator — Advanced Momentum Shift Detector
Reversal Oscillator is a free indicator designed to highlight price zones that are statistically outside their normal movement patterns, helping traders anticipate potential turning points before they occur. Unlike traditional oscillators that react mainly to overbought/oversold conditions, this indicator applies third derivative analysis (the "acceleration of the acceleration" of price) calculated using two independent methods within a n
FREE

AVERAGE DAILY RANGE INFO INDICATOR IS SIMPLY A NICE WAY TO GLANCE AT THE RANGE FOR A SPECIFIED NUMBER OF DAYS. IT SHOWS THE INFORMATION IN A SIMPLIFIED FORMAT BY DEFAULT RIGHT UPPER CORNER OF THE CHART WITH OPTIONS TO PLACE IT ANYWHERE ONE PLEASE. ITS SIMPLE YET EFFECTIVE. YOU CAN CHANGE THE PERIOD, CUSTOMIZE THE COLOR AND CHANGE THE FONT TYPE OR FONT SIZE IN THE SETTINGS TO SUIT YOUR STYLE.
FREE

This tool is useful for indicating resistance and support levels It bases on zone in setting to identify top/bottom of candles and and draw rectangle according to those resistance/support level Beside user can edit the zone via dialog on specific timeframe and that value will be saved and loaded automatically. User can determine what strong resistance and support and make the order reasonably.
FREE

Zigzag Indicator For RSI, To easily identify the highs and lows of the rsi signal. It is easier to observe divergent and convergent signals. Default setting: InpRsi =14 //Rsi Period InpDepth =12; // Depth InpDeviation =5; // Deviation InpBackstep =3; // Back Step
If you want open Exness account try this link : https://one.exness-track.com/a/teg5teg5 Dev buy taphu: Ha Van Tan - hatatrata - Trader's profile - MQL5 community Email: tan.ha@outlook.com
FREE

Special Offer ... It is totally free for all. New one coming soon...................
About This Indicator: RSI vs SMA Indicator: A Comprehensive Technical Analysis Tool for Better for Identify the Short and Long Signals.
The RSI vs SMA Indicator is a powerful technical analysis tool designed to understanding Market Price Fluctuation for Long or Short signals. This user-friendly Indicator good for both novice and experienced traders, providing valuable indication in price chart and separate wind
FREE

Indicator: Currency Strength Meter Pro Market Breadth Visualization Pros: Instead of looking at cluttered charts, this indicator displays data in a clean "Dashboard" format. Traders can instantly scan and know which pairs are the strongest or weakest. Benefits: Saves time checking individual charts and helps make faster trading decisions on pair selection. Auto-Ranking & Sorting Pros: Features a "Horizontal Ranking" mode which automatically sorts pairs from "Strongest" to "Weakest". Benefits: Al

An efficient, on-chart button panel that lets you switch symbols instantly. Features auto-sync with Market Watch, custom grids, and a highly customizable UI.
Stop wasting screen space with the bulky standard Market Watch window. On Chart Watchlist places a sleek, customizable dashboard directly on your chart, allowing you to scan markets and switch symbols with a single click. Designed for manual traders, scalpers, and anyone who needs to navigate multiple pairs quickly, this tool keeps yo
FREE
Swing High & Low Trendline Indicator is a professional tool that automatically identifies swing points on your chart and draws trendlines for easy visualization.
No need to manually scan candles, the indicator highlights key highs and lows based on your chosen settings, helping you analyze market structure and trade with confidence. Features: Automatically detects swing highs & swing lows Draws clean trendlines directly on the chart Works on all symbols (forex, indices, crypto, stocks,
FREE

The indicator is designed for displaying the following price levels on the chart: Previous day's high and low. Previous week's high and low. Previous month's high and low. Each of the level types is customizable. In the indicator settings, you set line style, line color, enable or disable separate levels.
Configurations ----Day------------------------------------------------- DayLevels - enable/disable previous day's levels. WidthDayLines - line width of daily levels. ColorDayLines - line
FREE

Simple Range Filter is an indicator designed to highlight candles with high or low volatility . It calculates the average range (High - Low) over a defined number of candles and dynamically adjusts the thresholds based on market conditions. Main Features: Dynamic calculation of average range Visual highlighting of bars with above or below-average range Configurable parameters for colors and calculation period Real-time updates (tick-by-tick) Use Cases: Helps identify periods of low volatility (
FREE
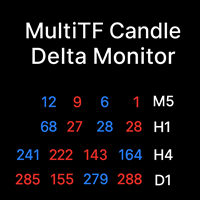
MultiTF Candle Delta Monitor — Multi-Timeframe Difference Panel (Visualizing candle changes as numeric values)
Overview: Monitor candle differences across multiple timeframes in a compact numeric panel. Each row represents a timeframe, and each cell shows the recent close-to-close difference (pips/ticks). Blue = upward, Red = downward, Gray = no change. Since it uses label rendering only, it is lightweight and does not interfere with the chart.
Key Features: - Multi-timeframe support (M1, M5,
FREE

Simple Super Trend indicator for MetaTrader 5. A trend indicator similar to moving averages. Use it for entry and exit signals. It gives accurate signals on precise time. Works as a Trailing SL/TP. This indicator can also be used on multiple timeframes where you place it on a larger timeframe then go to a lower timeframe. Super Trend needs to be used in conjunction with other indicators like rsi, Parabolic SAR, MACD, etc to receive filtered signals.

Moving Average Crossover with Alert is a indicator that can show buy and sell arrow types of alerts supported by the platform based on the crossover of two moving averages according to the parameters given by the trader. You can change inputs by yourself. This indicator only show the arrows to buy or sell to execute the trade you have to do it by yourself. For more information see the screenshot.

Looking for a powerful indicator to take your trading to the next level? Look no further than our unique RSI-based indicator, which combines the best of Relative Strength Index (RSI), Moving Average, and Heiken-Ashi indicators in MQL5. Our indicator offers real-time data without any lag, allowing you to make informed trading decisions with confidence. It's perfect for traders of all levels, from beginners to experts. With customizable settings and parameters, you can easily adjust the indicator

MT4 Version https://www.mql5.com/en/market/product/139061 MT5 Version https://www.mql5.com/en/market/product/139062
Half Trend Heikin Ashi Dashboard – Smart Multi-Pair & Multi-Timeframe Trend Scanner Half Trend Heikin Ashi Dashboard is a revolutionary analytical tool that combines the power of two of traders’ favorite indicators – Half Trend and Heikin Ashi – in one compact and informative dashboard. Designed specifically for traders who want to monitor dozens of pairs and multiple timeframes

Ichimoku Alerts is an indicator that identifies market opportunities using the Ichimoku indicator. It detects four types of signals. When a reversal pattern appears on the Tenkansen or Kijunsen line, and both lines are trending upward or downward, the indicator will send an alert and generate a risk management tool that automatically calculates the trade size and potential stop-loss and take-profit levels. If the signal forms on the Tenkansen line, the stop-loss will be placed on the Kijunsen li

This indicator is based on the original ZigZag provided as a source code example with MetaTrader installations. I rewrote it with some extra features for displaying the “depth” channel and the respective break-outs. It also allows one to observe prior zig-zag points. Optionally, it can alert the user when break-outs occur. The alerts can be simply on the terminal or also via push notifications on a mobile device, with your own custom text.

Trading setup could be a simple thing.
Triple Moving Average is a popular trading strategy to analyze market trends. It provides clear signals for identifying uptrends and downtrends based on the relative positioning and crossovers of short-term, medium-term, and long-term. Comparing Triple MA of two different time frame, provide a comprehensive look of price movement.
FREE
Supertrend Multicurrency Scanner Dashboard MT5 is a powerful tool designed to monitor multiple currency pairs and timeframes using the Supertrend indicator. It organizes signals in a grid format, displaying each symbol’s trend status across timeframes from M1 to MN1. Traders can enable or disable specific timeframes to align with their strategies. You can find the MT4 version here: SuperTrend Multicurrency Scanner MT4 For detailed documentation click here: Documentation Key Features: Supertrend

Enhance your trading strategy with the Big Candle Scanner Dashboard MT5, a versatile multi-asset dashboard designed to detect oversized bullish and bearish candles across numerous currency pairs and timeframes, signaling potential momentum shifts or volatility spikes. Rooted in classic candlestick analysis techniques popularized by traders like Steve Nison in the 1990s through his work on Japanese candlestick charting, this tool has become a staple for forex and crypto enthusiasts seeking to ca

Indicator introduction: The indicator draws wave lines and histograms, It has small price lag, and the signal will not drift. The indicator can send emails, alerts and notifications to you when previous k line has an up arrow and it is under the histogram sections or it has a down arrow. you can choose whether or not to send the two kind of alerts, the alerts repetition times can also be changed. If the indicator appears red and green histograms, this is a buy zone. It can be used to analyze mar
FREE
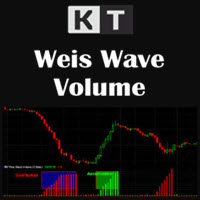
The KT Weis Wave Volume is a technical indicator based on the current market trend and description of the price movement's direction. The indicator is based on volume and displays the cumulative volumes for price increases and decreases in the price chart.
In addition, the indicator window shows a histogram of green and rising red waves.
The green color represents upward movement; the more the price rises, the larger the green volume. The red color represents a decreasing wave; the larger the
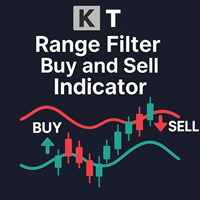
The KT Range Filter Buy and Sell simplifies minor price movements and fluctuations, transforming them into a smoother, more defined trend. While QQE smoothing is typically applied to RSI, It applies the concept directly to price, offering a unique and effective approach to market analysis.
It features a three-band structure, consisting of a main averaging line flanked by an upper and a lower band. These bands are calculated using a range multiplier, providing a clear visual representation of p
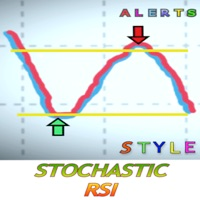
What is Stochastic RSI? The Stochastic RSI (StochRSI) is an indicator used in technical analysis that ranges between zero and one (or zero and 100 on some charting platforms) and is created by applying the Stochastic oscillator formula to a set of relative strength index (RSI) values rather than to standard price data. This version includes alerts to do not miss really good opportunities. You set the parameter when you want to receive a signal buy order or signal sell order. In order to receive

Indicator Introduction The indicator is designed according to moving average formulas, which is more stable and has less lag than RSI or CCI. The indicator has three indicator values, the moving average period and the colors of the line can be manually changed. What can this indicator brings to you? Accurate entry signals: The indicator draws up and down arrow signals. Multi-period trend analysis: Loading this indicator into a large timeframe chart and a small timeframe chart, the effect of

Introducing RSIScalperPro - the revolutionary RSI-based indicator for Metatrader 5, specifically designed for scalping in the one-minute chart. With RSIScalperPro, you'll have a powerful toolkit for precise entry and exit signals to take your trading to the next level. RSIScalperPro utilizes two different RSI indicators that provide clear signals for overbought and oversold areas. You can customize the time periods and limit values of the two RSIs according to your preferences to achieve the be
Enhance your trading decisions with the Cm Ultimate Ma Mtf MT5 , a powerful moving average indicator offering high customization and flexibility for multi-timeframe analysis. Based on popular TradingView concepts and optimized for MT5, it supports advanced MA types like Tilson T3 and has gained popularity since the 2010s for plotting dual MAs from different timeframes. Non-repainting and user-friendly, it highlights price crosses and MA intersections with arrows, ideal for trend detection in vo
Enhance your trading accuracy with the SSL Channel Indicator MT5 , a dynamic tool designed to visualize price trend dynamics through the innovative Semaphore Signal Level (SSL) approach. Rooted in technical analysis concepts popularized in trading communities like MQL5 and Forex Factory, this indicator uses two 10-period simple moving averages (SMAs)—one for highs and one for lows—to form a responsive price envelope. Renowned for its simplicity and effectiveness in identifying trend changes, it’
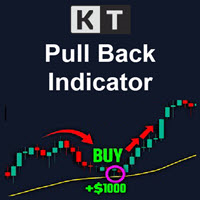
The KT Pull Back Arrows shows the pull back arrows using the RSI (Relative Strength Index) to identify suitable pull-back entry areas within the overbought and oversold zones. The indicator effectively pinpoints favorable moments for initiating pull-back trades by leveraging these RSI thresholds. Trend trading is often considered the most profitable strategy in the Forex market. It is the equivalent of riding the wave, going with the flow, and capitalizing on market momentum. However, timing is
The KT Adaptive RSI indicator integrates a adaptive module with the classic RSI, identifying dynamic overbought and oversold levels based on current market conditions. Traditional RSI assumes an instrument is overbought above 70 and oversold below 30, but this isn't always accurate for every instrument. Our adaptive module quickly analyzes historical data to adaptively identify optimal overbought and oversold thresholds. This helps traders make precise entry and exit decisions tailored to real-
The KT Two Pole Oscillator is designed to help traders spot precise market signals using an advanced smoothing method. It combines deviation-based calculations with a unique two-pole filtering approach, resulting in clear visual signals that traders can easily interpret and act upon. Thanks to its adaptive nature, the two pole filter remains consistent across different market conditions, making it a versatile tool whether the market is trending or ranging.
Features
Two-Pole Filtering: Smooths t

KT Higher High Lower Low marks the following swing points with their respective S/R levels: Higher High: The swing high made by the price that is higher than the previous high. Lower High: The swing high made by the price that is lower than the previous high. Lower Low: The swing low made by the price that is lower than the previous low. Higher Low: The swing low made by the price that is higher than the previous low.
Features The intensity of swing high and swing low can be adjusted by chan

One of the number sequences is called "Forest Fire Sequence". It has been recognized as one of the most beautiful new sequences. Its main feature is that this sequence avoids linear trends, even the shortest ones. It is this property that formed the basis of this indicator. When analyzing a financial time series, this indicator tries to reject all possible trend options. And only if he fails, then he recognizes the presence of a trend and gives the appropriate signal. This approach allows one t
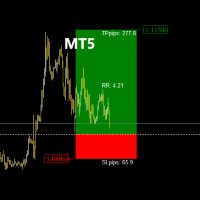
The TradeManagerRR Visualizer MT5 is a trade management indicator designed for traders who want to easily visualize their Take Profit (TP) and Stop Loss (SL) levels on a chart. This initial version provides a simple graphical representation that displays SL and TP zones as well as the entry price. Please note that this current version focuses solely on the graphical display of SL and TP zones as figures on the chart. Current Version Features: SL and TP Zones Display: Clear visualization of

Among the top indicators offered here on the market in terms of value for money.
I recommend you to read the product's blog (manual) from start to end so that it is clear from the beginning what the indicator offers. This supply and demand zone indicator draws the zones on the chart and sends alerts when the price has reached or broken a zone. It has support for one nested zones (zones on one other time frame than the current) which will also be drawn on the chart and involve alerts. It i
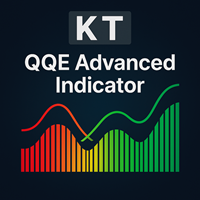
The KT QQE Advanced is a modified version of the classic QQE oscillator to depict it more accurately using the colored histogram with fast and slow Trailing Line(TL).
Unlike the classic QQE, the KT QQE Advanced consists of a histogram with overbought/oversold levels.
Applications
Find quick buy/sell signals across all the timeframes using the MTF scanner. Find the trend direction more accurately. Detects overbought/oversold market. Shows the price momentum.
Inputs RSI Period Smooth Period MT

Due to Technical and Logical manipulations by Brokerage, I have come a long way to bring this rear indicator that combines numerous strategies that have the following abilities: Market Trend Identification : Understand the overall trend of the market. Reversal Points : Identify potential points where the market may change direction. Entry and Exit Points : Determine optimal times to enter and exit trades. For a comprehensive understanding of how to use this indicator, please watch the accompanyi

Astral Pulse Oscillator — The Celestial Flow & Energy Resonance Tool Step into the mystic rhythm of market energy with the Astral Pulse Oscillator , a non-repainting fusion of celestial flow mapping and harmonic pulse resonance . This indicator translates hidden energetic fluctuations into radiant visual waves, allowing traders to interpret the unseen emotional tide that moves price — from euphoric expansions to ethereal contractions. Within its luminous subwindow, two astral forces dance: Ce

Elevate your trading strategy with the Radius Trend by ChartPrime MT5 , an advanced technical analysis tool that visualizes market trends through an adaptive, radius-based method. With dynamic bands that react to price action and volatility, it offers traders a unique insight into trend strength, direction, and potential reversals. Unlike traditional trend lines, this indicator adjusts dynamically like a radius sweeping across the chart, creating a fluid approach to trend analysis. Traders rely
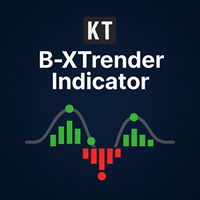
KT B-Xtrender is an advanced adaptation of the trend-following tool originally introduced by Bharat Jhunjhunwala in the IFTA journal. We’ve refined the concept to deliver more precise signals and built-in alerts, helping traders spot stronger opportunities in trending markets. While it can be applied to various charts, it shows its best performance on higher timeframes like the 4-Hour and Daily.
Features
Dual Trend View: It combines short-term and long-term analysis, making it easier to disti
This indicator shows No Demand and No Supply signals for high probability trade entries and exits. Very powerful when combined with specific support and resistance zones to identify turning points in the market.
No Demand – the situation of a deficit of buyers in the up-move. Possible short position. Definition: (look at the below screenshots for illustration) Signal candle volume is lower than the previous two. Signal candle is bullish. Signal candle has an upper wick/pin. Confirmation candle
The MetaTrader Market is a simple and convenient site where developers can sell their trading applications.
We will help you post your product and explain you how to prepare your product description for the Market. All applications on the Market are encryption-protected and can only be run on a buyer's computer. Illegal copying is impossible.
You are missing trading opportunities:
- Free trading apps
- Over 8,000 signals for copying
- Economic news for exploring financial markets
Registration
Log in
If you do not have an account, please register
Allow the use of cookies to log in to the MQL5.com website.
Please enable the necessary setting in your browser, otherwise you will not be able to log in.