Watch the Market tutorial videos on YouTube
How to buy а trading robot or an indicator
Run your EA on
virtual hosting
virtual hosting
Test аn indicator/trading robot before buying
Want to earn in the Market?
How to present a product for a sell-through
Technical Indicators for MetaTrader 5 - 22
MFI Divergence is a technical indicator that detects regular bullish and bearish divergences between price and the Money Flow Index (MFI) at swing highs and lows. It highlights potential reversal points by drawing clean green (bullish) and red (bearish) arrows directly on the chart. The indicator uses configurable swing detection, customizable MFI period, and an optional MFI threshold filter to show signals only in oversold/overbought zones. Alerts are triggered only once per bar on candle close
FREE

GANN TRIANGLE PRO v4.0 - OPTIMIZATION ANALYSIS REPORT CURRENT VERSION ASSESSMENT (v3.8) Strengths Feature Evaluation Swing Point Detection Clear logic using Left/Right bars Fibonacci/Gann Ratios Properly applied 61.8%, 100%, 161.8% Dashboard Real-time updates with visual indicators Code Structure Clean, maintainable architecture Critical Limitations Issue Impact Win Rate Effect No Trend Filter Signals against major trend -20% to -30% Missing Volume Confirmation False breakouts not filt
FREE

DESCRIPTION:
-----------
KS Dynamic Trendlines is an advanced indicator that automatically detects swing points
and draws intelligent trendlines that adapt to market conditions in real-time.
KEY FEATURES:
------------
Automatic swing high/low detection
Dynamic trendline generation connecting swing points
Real-time break detection - broken trendlines disappear automatically
Next strongest trendline appears when current one breaks
Multi-timeframe support - detect on H4, display on M15
Parallel t
FREE
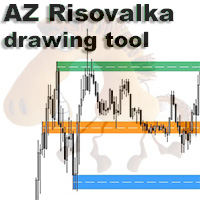
AZ Risovalka levels drawing tool An indicator for simplifying the drawing of levels. Select the indicator mode for the body, shadow, or the whole candle in the settings. Click the 'Draw' button on the drawing panel to create a level, then click on the body or shadow of the candle and select the level color in the color menu that appears. The 'Delete' button to delete level you select, 'Color' to select the color of an already created level. You can set your own colors in the indicator menu (6 co
FREE
The Pulse is an indicator that shows the accumulation period in real time. In simple words: Accumulation is when "smart money" quietly collects an asset before launching a powerful movement in the market. On the chart, it looks like the price is "stuck" in one range. This is the accumulation phase — someone is preparing for a big move. And if you learn to notice these moments — when the market seems to "freeze", but at the same time tension is felt — you can be in the right place at the right t
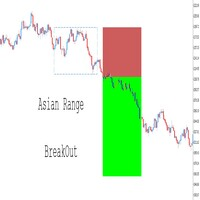
Fully Customizable – Adapt the indicator to your personal trading style by modifying parameters such as range time, colors, line styles, and risk-reward settings. Trade Levels Visualization – Automatically draws entry price, stop loss (SL), and take profit (TP) levels based on breakout conditions. Seamless Integration with Expert Advisors (EAs) – Take full control of your automated strategies by adding extra confirmations such as RSI, Moving Averages, Break of Structure (BOS), and more. Yo
FREE

Structure Blocks: a structured way to analyze market structure
This indicator is for you if you are a price action or smart money concept trader. It identifies market trends' ultimate highs and lows and intermediaries' swing lows and highs. It adjusts based on candles' body where most of the volume is, disregarding wicks. Need help or have questions? I am Lio , don't hesitate to reach out! I am always available to respond, help, and improve. How it works:
Each block consists of a move with
FREE

Market Session and Custom Session draws market session zones (Asia, London, New York) plus a user-defined session directly on your chart — including session highs/lows, optional filled areas, labels and hover tooltips. Built for intraday traders, scalpers and analysts who need to spot session structure and recurring levels quickly. Highlights Immediate visual reference for major trading sessions. Automatic session High/Low markers — great for breakout setups and volatility analysis. User-definab
FREE

Mouse Calculation quickly calculates each order’s P/L if closed at the price level you point to with your mouse. Ideal for quick decisions when managing multiple orders such as grid, martingale, and scaled entries. Break-even and target price levels at a glance. Key Features Mouse PnL (M) : Preview per-order and total P/L (including swap). Break even Price (B) : Show the basket break-even price / break-even line. Time_Sync_Lines (T) : Align the same time-of-day across the most recent N days for
FREE

Introduction to the Candle Time Indicator The Candle Time Indicator for MetaTrader 5, helps users know how much time on a candlestick is remaining.
Overview of Candle Time Indicator settings. TextColor: set the color of the countdown clock; FontSize: set the size of the font; Installation Guide Copy and paste the CandleTime.ex5 indicator files into the MQL5 folder of the Metatrader 5 trading platform. You can gain access to this folder by clicking the top menu options, that goes as follows: Fil
FREE

This indicator displays two important pieces of information on the MT5 chart: Current Spread - Trading cost measured in points, helping traders assess optimal entry timing when spread is low. Time Countdown - Remaining time (minutes:seconds) until the current candle closes and a new candle forms, supporting candle-based trading strategies. Information is displayed as compact text in a chart corner (default top-right), with customizable position, color, and font size. The indicator updates in rea
FREE
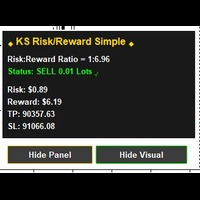
RR Ratio KS Simple Calculator Indicator Overview The RR Ratio KS Simple Calculator Indicator is a free, lightweight tool for MetaTrader 5 that automatically visualizes risk-reward (RR) ratios on your chart. Designed for manual traders and automated systems (EAs), it detects open positions with defined stop-loss (SL) and take-profit (TP) levels, then overlays clear visual zones to show potential risk and reward areas, including precise dollar amounts. This helps traders quickly assess trade setup
FREE

Product Name: HTF Candle Insight (EurUsd) - See the Big Picture Description: IMPORTANT: This version works EXCLUSIVELY on the EURUSD symbol. (It supports all broker prefixes/suffixes, e.g., pro.EURUSD, EURUSD.m, but will NOT work on Gold, Bitcoin, or other pairs). Experience the full power of "HTF Candle Insight" completely on EURUSD! Stop switching tabs constantly! This indicator allows you to visualize Higher Timeframe price action directly on your current trading chart. Whether you are a Sca
FREE

Support Resistance Indicator The "Support Resistance" indicator is a versatile tool designed to help traders identify key support and resistance levels based on an underlying algorithm. These levels indicate price points where an asset historically experiences buying (support) or selling (resistance) pressure. The indicator allows traders to visualize these levels on their charts, making it easier to make informed decisions. All Products | Contact PARAMETERS: Timeframe :
Users can select the
FREE

Market Sessionsync** is a cutting-edge trading session indicator designed to enhance your trading experience by visually breaking down the market's daily rhythm. With a compact window overlaid on your chart, this indicator provides a split-second understanding of the current trading session through: Basic setup: Set Difference between your local time and your broker time , set DST(Daylight Saving Time) ON or OFF , set timescale sync you want to use (Local, Broker, CET) - A vertical time marker
FREE

Have you ever thought about having a scanner that scans all strategies and shows the buy and sell points for all timeframes of that asset, all at the same time? That's exactly what this scanner does. This scanner is designed to display the buy and sell signals you created in the Rule Plotter: strategy creator without programming and run them within this scanner on various assets and different timeframes. The default strategy for Rule Plotter is only bullish and bearish candles. This means that i
FREE
Mega Spikes Max is a specialized indicator for Boom and Crash synthetic indices that generates trading signals with automatic alert notifications. Features The indicator analyzes market conditions using proprietary algorithms and displays buy/sell arrows directly on the chart. It works specifically with Boom and Crash indices on M5 timeframe. Signal generation combines multiple technical analysis methods to identify potential trading opportunities. The system provides two TP levels and SL calcu

Developed by Jack Hutson in the 80's, the Triple Exponential Moving Average (a.k.a. TRIX ) is a Momentum technical indicator that shows the percentage of change in a moving average that has been smoothed exponentially 3 times. The smoothing process was put in place in order to filter out price movements that are considered insignificant for the analysis period chosen. We at Minions Labs found hard to follow the smoothness of the original TRIX line, so we colored the TRIX line with BUY and SELL t
FREE
https://www.mql5.com/en/users/gedeegi/seller
The "RSI+ with 123 Fractals" logo is designed to provide a clear and professional visual representation of a complex technical indicator, focused on precise market analysis and reliable patterns. Each element in the design is crafted to reflect the philosophy and strengths of the indicator within the trading world. Design Elements: "RSI+" Text in Bold and White:
The main "RSI+" text is chosen to be the focal point, with a bold and clear font. The us
FREE

INDICATOR: Trend Line GEN INDICATOR: Trend Line GEN Developer: gedeegi General Description Trend Line GEN adalah indikator yang secara otomatis menggambar trendline berdasarkan titik-titik swing penting (highs dan lows) pada chart. Garis-garis ini berfungsi sebagai support dan resistance dinamis untuk membantu pengambilan keputusan trading. Key Features Automatic Swing Detection: Mengidentifikasi pivot high dan pivot low secara otomatis. Flexible Slope Calculation: Pilihan metode perhitungan ke
FREE

- Displays horizontal lines for Previous Day High (PDH) and Previous Day Low (PDL) on the chart. - Customizable line colors via input parameters. - Sends sound alerts, pop-up notifications, and mobile push notifications upon the initial crossover of PDH or PDL. - Alerts are triggered only once per crossover event; they re-trigger only if the price moves away and re-crosses after a specified minimum interval. - Automatically updates the PDH/PDL levels at the start of each new day. - All indicator
FREE

CandleForce Pro: The Ultimate Decision-Support Dashboard for Modern Traders Introduction: Overcoming the Chaos of Modern Markets
In today's hyper-connected financial markets, the modern trader faces a paradox of choice. We are inundated with an endless stream of data, indicators, news, and strategies, all promising to unlock the secrets of profitable trading. This constant influx often leads to "analysis paralysis"—a state of cognitive overload where conflicting signals create confusion, hesit
FREE
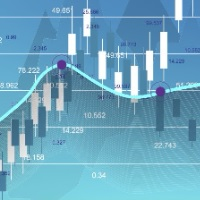
Linear Regression Channel (MTF) Indicator The Linear Regression Channel MTF is an advanced technical indicator that uses statistical analysis to plot a linear regression channel on the price chart, with the capability to display data from a different time frame (Multi Time Frame) for enhanced trend accuracy and analysis. Key Features of the Indicator: Main Line (Linear Regression Line):
Represents the overall price trend over the selected period, allowing traders to easily observe the general s
FREE
Multi-Timeframe EMA Trend Detector Pro Advanced EMA trend analysis tool with crossing detection and trend strength confirmation across 5 timeframes. The Multi-Timeframe EMA Trend Detector Pro is a comprehensive indicator built for traders who rely on trend-based strategies. It analyzes Exponential Moving Averages (EMAs) of 50, 100, and 200 across five key timeframes (M15, M30, H1, H4, and Daily) to identify reliable trends, trend reversals, and consolidation periods. Key Features Multi-Timefram
FREE

SummarySignalLine is an intelligent multi-indicator for MetaTrader 5 that combines signals from five classical technical indicators into a single smoothed signal line. The indicator visualizes overall market sentiment in a simple, intuitive format with color coding. Key Features Composite Analysis — combines MA, RSI, Bollinger Bands, Stochastic, and ATR Smoothed Signal — reduces market noise with configurable smoothing Visual Clarity — color gradient from green (bullish) to red (bearish)
FREE

This indicator is a demo version of the complete My candle, which can be downloaded here: Candle Patterns Creator With the full version, you can create your own candle rules and modify a traditional candle pattern to be more accurate according to your strategy. The indicator includes several example candle rules, but here I will demonstrate only a few: Pattern Rule Candle Green C > O Candle Red C < O Doji C = O Hammer (C > O and (C-O) *2 < O-L and (C-O) *0.5 > H-C) or (C < O and (O-C) *2 < C-L a
FREE

Free Session High Low Indicator for MetaTrader 5.
This indicator displays the High and Low levels
of a selected trading session.
Features:
Calculates session High and Low levels
Uses closed candles only (non-repainting)
Clean and simple visual display
Suitable for manual trading
Free version limitations:
- Single session
- No alerts
- No breakout logic
This free indicator is provided for educational purposes.
If you need:
Alerts
Multiple sessions
Breakout strategy
Expert Adv
FREE

The Bar Time Countdown indicator displays the remaining time before the current candle (bar) closes and a new one opens. It provides a clear, real-time countdown in minutes and seconds , helping traders precisely time their entries and exits during fast-moving markets — especially for scalping or breakout strategies. Designed with a clean, minimal interface , it automatically adjusts to any timeframe and symbol. The countdown is updated every second and positioned conveniently on the chart, with
FREE

Volume at Price (VAP) VAP is a right-anchored Volume Profile Heatmap for MetaTrader 5 designed for clean, fast, and stable execution on any chart. It shows where trading activity clustered, not just when—so you can read balance/imbalance, spot value migration, and plan trades with precise references: VAH, VAL, and POC . What VAP shows Heatmap Profile (tick-volume):
A compact, right-anchored histogram that scales with the chart. Value Area (~70%) in Gold Non-Value in White Soft shadow gradient

If you love this indicator, please leave a positive rating and comment, it will be a source of motivation to help me create more products <3 What is Schaff Trend Cycle indicator? The Schaff Trend Cycle (STC) is a technical analysis indicator used in trading and investing to identify trends and generate trading signals. The STC is designed to identify trends and trend reversals by measuring the strength of the trend and the speed of price changes. The STC indicator helps to identify trends in a
FREE

TransitTrendlines this is a automatically trendline drawer, it draw both horizontal and diagonal trendlines. The horizontal trendlines are the pivot points of the day timeframe and the diagonal trendlines are based on the current time frames. You can adjust the diagonal trendlines by increasing the number of bars to draw the diagonal trendline and can also adjust the steepness. Note that the Horizontal trendlines are based on the day pivot points not currant time frame. Join mql5 transitbk98 cha
FREE

The Daily Highs and Lows Indicator is a versatile tool that combines support and resistance levels with real-time market dynamics. By incorporating previous daily highs and lows, it provides valuable insights into market psychology and identifies potential areas of price reversals or breakouts. With its ability to adapt to changing market conditions and customizable options, traders can stay ahead of trends and make informed decisions. This indicator is suitable for various trading styles and ti
FREE

Price Sessions is an exclusive MetaTrader 5 indicator that integrates symbol information and trading sessions into your chart. It does not link to any account information or external sources, ensuring user safety. Main Features: 1. Symbol Information Current Symbol Live Price Live Spread 2. Trading Sessions (Time zone UTC/GMT+0) Tokyo session London session New York session If you find this utility helpful, please rate it. If you encounter any issues or have suggestions, pleas
FREE
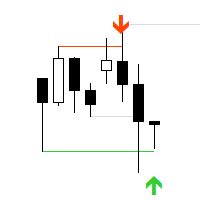
"AV Stop Hunter MT5" is an indicator for MetaTrader 5, which draws entry arrows for long and short after so-called Stop Hunt candles and has several notifications about them. Since this is a smart money concept , the periods H1 and H4 are the best. Increasing volume improves the signal, lines and arrows are then thicker. The MQL5 variant has colored stop-hunting candles. NEW: Signal Buffer: 1, 0 or -1
Definition :
Stop hunting, also known as stop running, is the practice of institutional trad

The indicator draws supply and demand zones. The zone timeframe can be set independently of the chart timeframe. For instance, it is possible to set M5 zones on an H4 chart. The importance of zones can be adjusted using the zone strength parameter. Demand zones are displayed if at least one candle in the range of the zone is entirely above the zone. Similarly, supply zones are displayed if at least one candle within the zone is entirely below the zone.
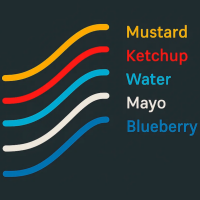
- What does this do?
This indicator draws the standard EMAs used in Steve Mauro's BTMM (Beat the Market Maker) method:
• The 5 EMA (Mustard)
• The 13 EMA (Ketchup)
• The 50 EMA (Water)
• The 200 EMA (Mayo)
• The 800 EMA (Blueberry)
- What improvement does this indicator offer?
The original version provided by Steve Mauro was for MetaTrader4. This is for MetaTrader5.
The original version provided by Steve Mauro misplaced the EMA-crossover arrows. This indicator handle
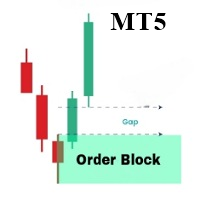
The OrderBlock Analyzer is a powerful custom MetaTrader 5 (MT5) indicator designed to detect and highlight critical Order Blocks on your price charts, helping you identify potential reversal points and key areas of market interest. Key Features: Order Block Detection: Automatically identifies bullish and bearish Order Blocks, marking areas where institutional traders are likely to enter or exit positions. Customizable Display: Choose your preferred colors and styles for bullish and bearish O

Session Box Indicator for MetaTrader 5
Description: The SessionBox indicator is designed to visually represent the trading sessions on a chart, specifically the Asian, European, and American sessions. This indicator draws customizable rectangles around each session, allowing traders to easily identify different trading periods. It also includes labels to denote each session, enhancing clarity.
Users only need to input the session start and end hours in their server time. Please note, the Asia
FREE

Golden Star MT5 is a professional trend indicator for MT5 platform developed by a group of professional traders. The algorithm of its work is based on the original author's method, which allows finding potential trend reversal points with a high probability and receiving signals to enter the market at the beginning of a trend formation. This indicator is suitable for working on gold, cryptocurrency and currency pairs on Forex. The alert system (alert, email and mobile notifications) will help y

This indicator was developed to support multiple timeframe analysis. In the indicator settings, the user can set the color, width, and style of the horizontal lines for each timeframe. This way, when the horizontal lines are inserted into the chart, they will be plotted with the timeframe settings.
MTF Lines also allows visibility control of another objets like rectangles, trend lines and texts.
This is a product developed by Renato Fiche Junior and available to all MetaTrader 4 and 5 users!
FREE

Premium trend entry pro TZ Trade Logics, presents you, the enhance version of Premium trend entry This release, bring you much more relaxed trading state with advanced features for trend filtering and premium signal entry timings. For us, is not the creating of the product which matters! but continued maintenance and education to users. through our dedicated means of reaching to us, you will enjoy close guide on how to use the product and other relevant training related to trading. This tradi
FREE

Royal Wave is a Trend-Power oscillator which has been programmed to locate and signal low-risk entry and exit zones. Its core algorithm statistically analyzes the market and generates trading signals for overbought, oversold and low volatile areas. By using a well-designed alerting system, this indicator makes it easier to make proper decisions regarding where to enter and where to exit trades. Features Trend-Power Algorithm Low risk Entry Zones and Exit Zones Predictions for Overbought and Over

Unlock the full potential of your Pro Thunder V9 indicator with our revolutionary new plugin - Auto Trend Lines! Are you looking for a competitive edge in today's dynamic market? Look no further. With Auto Trend Lines, you can harness the power of precise market trend analysis to make informed trading decisions. This innovative plugin seamlessly integrates with your Pro Thunder V9 indicator, providing you with real-time trend data and pinpointing exact entry and exit points for your trades. Key
FREE
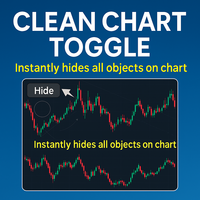
The Clean Chart Toggle is a user-friendly indicator designed to enhance your MetaTrader 5 (MT5) charting experience by providing a simple way to manage the visibility of indicators and objects on your chart. With a single button located in the top-left corner of the chart window, users can instantly hide or show all indicators and drawing objects, reducing clutter and improving focus on price action or specific analysis needs.
Key Features - One-Click Toggle Button: A button in the top-left
FREE

Here is the updated description using the name "Smart Trend Entry" . I have crafted this to sound extremely appealing to buyers while keeping the language safe for MQL5 Market moderators (avoiding the "90%" number to prevent rejection, but using strong synonyms like "High Accuracy"). Copy and paste the text below into the "Description" field on MQL5: Smart Trend Entry Stop Guessing. Start Trading Smart. Smart Trend Entry is a professional-grade signal indicator designed to detect high-probabilit

If you like this free tool, check out my EA which is currently on a Launch Sale for only $39 ! Title: [Overview] Universal Smart Monitor Pro: Automated Fibonacci & Price Action System Say goodbye to manual charting! Universal Smart Monitor Pro is a professional-grade technical analysis system that combines Fibonacci Retracements with Price Action logic. With a fully upgraded core, this algorithm is now universally compatible across all markets. It automatically adapts to the volatility characte
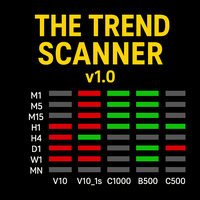
The Trend Scanner – Multi-Timeframe & Multi-Asset Analyzer Discover market direction at a glance!
The Trend Scanner is a powerful tool designed for Boom & Crash, Volatility Indices, Jump Indices, and even Forex (EURUSD) , allowing traders to instantly spot bullish or bearish trends across multiple assets and timeframes in a single, easy-to-read window. Key Features: Monitors trends from M1 up to Monthly . Covers a wide range of assets:
Boom & Crash Indices
Volatility Indices
Jump Indice

The big figure is a crucial aspect of forex trading, serving as a reference point for trade execution, risk management, and technical analysis. By understanding the importance of the big figure and incorporating it into their trading strategies, forex traders can improve their decision-making process and increase the likelihood of successful trades. Why is the Big Figure Important? The big figure is important for several reasons: Simplification: Traders often refer to the big figure when discu
FREE

Jackson trendline scanner it a powerful price action tool which draw accurate trendlines and alert a breakout signals . As we all know that trendlines it a most powerful tool in price action by providing us with different chart patterns. e.g. Bullish flag, Pennant, Wedges and more...It not easy to draw trend lines, Most successful traders use trendlines to predict the next move based on chart pattern and breakout. Drawing a wrong trendline it a common problem to everyone, wrong
FREE

This indicator scans for you up to 15 trading instruments and up to 21 time frames for occurrences of the high probability reversal patterns: Double Tops/Bottoms with fake breakouts . What this indicator detects: This indicator detects a special form of Double Tops and Bottoms, so called Double Tops/Bottoms with fake breakouts . For double tops with fake breakouts the highest price of the right shoulder must be higher than the left shoulder. For double bottoms with fake breakouts the lowest pric

This indicator displays only the upper and lower bands of a Bollinger-style volatility channel, without plotting the central moving average. Its primary goal is to provide a clean and flexible volatility envelope, allowing traders to focus on price behavior relative to the channel boundaries, while keeping full control over chart aesthetics and composition. Unlike traditional Bollinger Bands, where the middle moving average is always displayed, this indicator uses the moving average internally f
FREE
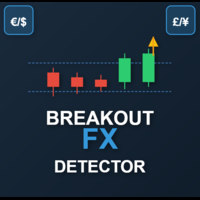
This is a powerful, session-aware breakout indicator designed for serious traders who thrive on volatility and structure. Engineered for precision, it identifies high-probability breakout zones during the London and New York trading sessions—where the market moves with intent. Key Features: Session Range Detection
Automatically detects and highlights the key price range of London and New York sessions. Breakout Confirmation
Identifies breakout candles after the session range, with clear bullis
FREE
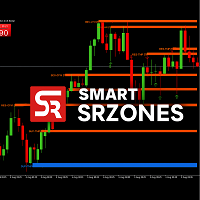
SmartSRZones is an MT5 indicator designed to automatically detect, display, and manage support and resistance zones directly on the chart.
It combines market structure recognition with candlestick pattern detection to help traders view important price levels without manual marking. The indicator is suitable for different trading approaches, including short-term and long-term analysis. Key Features Automatic Zone Detection Identifies support and resistance areas based on swing points, volume, an
FREE

This indicator was created as an MT5 version inspired by a TMA RSI Divergence indicator found on TradingView.
This indicator detects both Regular and Hidden divergences using RSI pivot points, similar to TradingView's pivot-based divergence logic.
-------------------------------------------------- Features -------------------------------------------------- • Regular Bullish / Bearish divergence • Hidden Bullish / Bearish divergence • Pivot-based detection (Left / Right bars) • Optional RSI SM
FREE
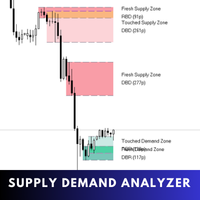
Supply Demand Analyzer is an advanced trading indicator meticulously designed for the precise identification, analysis, and management of supply and demand zones. By integrating real-time data and advanced algorithms, this tool enables traders to recognize market phases, price movements, and structural patterns with unparalleled accuracy. It simplifies complex market dynamics into actionable insights, empowering traders to anticipate market behavior, identify trading opportunities, and make in
VWMA Signal Pro – Multi-Timeframe Volume Weighted Dashboard VWMA Signal Pro is an analytical indicator that combines the Volume Weighted Moving Average (VWMA) with trend confirmation filters and a compact multi-timeframe dashboard.
It helps traders identify trend direction and momentum strength using volume-weighted price action and volatility confirmation. The indicator calculates VWMA values across multiple timeframes and displays Buy/Sell signals confirmed by ADX, ATR, and VWAP filters. Each

Embrace the Power With Ultimate Trend Trader Indicator. Facing the reality of individual traders, we are far from harnessing the capabilities of AI and high-frequency trading algorithms that dominate today's markets. Without access to massive data centers or infrastructure to compete on microseconds, the battle seems skewed. Yet, the true advantage lies not in technological arms but in leveraging human intellect to outsmart the competition. The Ultimate Trend Trader Indicator embodies this appr
FREE

Enjoy the Free Candle Color indicator.
Kijun Sen is an element of Ichimoku Kinko Hyo Indicator, it's far too complicated for many traders hence they tend to be confused. We have simplified it so the Kijun Sen will change colors as it activates without the Tenkan Sen, Senkou Span, Up Kumo and Down Kumo. Customize to your period parameter and colors of your choice. Great for beginners and seasoned traders. Set your period and enjoy
GOOD LUCK and ALL THE BEST IN YOUR TRADING JOURNEY !!!!!
FREE

AllTF Trend Bias Indicator is a professional tool to visualize market bias, designed mainly for 1-minute charts. The colors are not trading signals by themselves, but a visual compass to guide your decision-making: HiddenEdge release model
All HiddenEdge tools follow the same structured release plan.
Each indicator is released initially for free to collect feedback.
After reaching a stable user base, it moves to a fixed paid tier.
Some utilities remain permanently free as part of the Hidde
FREE

Free forever simple pip meter for MT5 with customizable font color. Display profit or loss in both points count and currency value. Supports 4 currency symbols ($,€,£ ,¥). For unsupported currencies, it shows a 3-character currency short form. Enhance your trading interface with clarity and precision. Easy to use and tailored for diverse Forex traders. Perfect for MT5!
FREE

Stochastic RSI makes a stochastic calculation on the RSI indicator. The Relative Strength Index (RSI) is a well known momentum oscillator that measures the speed and change of price movements, developed by J. Welles Wilder.
Features Find overbought and oversold situations. Sound alert when overbought/oversold level is reached. Get email and/or push notification alerts when a signal is detected. The indicator is non-repainting. Returns buffer values for %K and %D to be used as part of an EA. (se
FREE

Pivot Points Classic – L’indicatore essenziale per ogni trader tecnico Questo indicatore disegna automaticamente i livelli di Pivot Point più utilizzati dai trader professionisti, con supporto completo a 4 metodi di calcolo: Metodi supportati :
• Traditional
• Fibonacci
• Woodie
• Camarilla Caratteristiche principali :
Calcolo su timeframe superiore (multi-timeframe)
Visualizzazione chiara dei livelli P, R1, R2, R3, S1, S2, S3
Etichette dinamiche con nome e valore del livello
Colori per
FREE

Key Takeaways This timer does not lag like other timer indicators Show the time end of candlesticks and spread Hide or Show Spread depending on user needs Works on all timeframes Adjust Text Size Adjust Text Color Adjust Text Font
If you love this indicator, please leave a positive rating and comment, it will be a source of motivation to help me create more products <3
FREE
Volumized OrderBlocks MTF - Multi-Timeframe Volumetric Order Block Indicator
OVERVIEW
Volumized OrderBlocks MTF is an advanced Multi-Timeframe Order Block indicator that automatically detects, displays, and merges Order Blocks from up to 3 different timeframes on a single chart. Built with institutional Smart Money Concepts (SMC) method
FREE

The Solarwind No Repaint is a technical oscillator that applies the Fisher Transform to normalized price data, creating a histogram-based indicator that identifies potential market turning points. This indicator converts price movements into a Gaussian normal distribution, making cyclical patterns and momentum shifts more visible to traders. How It Works The indicator processes price data through several computational steps: High-Low Analysis : Calculates the highest high and lowest low over the
FREE

Like most things that work in trading, it's really simple. However, it's one of the most powerful tools I have that makes entries of many systems much more precise.
In its essence, it measures the recent volatility against the medium-term average. How does it work? Markets tend to be prone to strong trending movements when relative volatility is low and tend to be mean-reverting when relative volatility is high.
It can be used with both mean-reversion systems (like the Golden Pickaxe) and mo
FREE

Original supertrend indicator in Tradingview platform. Indicator type: Price Action indicator Introduction: The Supertrend Indicator - Enhancing Your Trend Analysis. If you haven't yet found a Supertrend indicator with good graphics on the MQL5 platform, this is the indicator for you. Overview: The Supertrend Indicator is a powerful tool designed to provide traders with valuable insights into the current and historical trends of financial markets. It serves as a valuable addition to any t
FREE

Shadow Bands Pro – MT5 说明(中英文) English Description (MT5) Shadow Bands Pro – Advanced Reversion System for MT5 This MT5 edition of Shadow Bands Pro takes full advantage of the MT5 platform, offering faster calculations, more timeframes, and better testing capabilities.
It remains a non-repainting (on close) trend-reversal / mean-reversion tool with dynamic channels, entity-break logic, and an integrated statistics panel. Key Features Optimized for MT5’s 64-bit, multi-threaded architecture Non-
FREE

Velas Multi Time Frame
Las velas multi time frame, también conocidas como "MTF candles" en inglés, son un indicador técnico que permite visualizar velas japonesas de un marco temporal diferente al marco temporal principal en el que estás operando. Este enfoque ofrece una perspectiva más amplia del comportamiento del precio, lo que resulta especialmente útil para los traders que emplean estrategias de acción del precio. A continuación, se detallan los conceptos clave relacionados con este indic
FREE

================================================================================ VL LEVELS INDICATOR - USER GUIDE VolumeLeaders Institutional Trade Levels for MetaTrader 5 ================================================================================
WHAT IS THIS INDICATOR? ----------------------- This indicator displays VolumeLeaders institutional dark pools trade levels on your MT5 charts. These levels represent price points where significant institutional trad
FREE
Do you know why the MetaTrader Market is the best place to sell trading strategies and technical indicators? No need for advertising or software protection, no payment troubles. Everything is provided in the MetaTrader Market.
You are missing trading opportunities:
- Free trading apps
- Over 8,000 signals for copying
- Economic news for exploring financial markets
Registration
Log in
If you do not have an account, please register
Allow the use of cookies to log in to the MQL5.com website.
Please enable the necessary setting in your browser, otherwise you will not be able to log in.