Watch the Market tutorial videos on YouTube
How to buy а trading robot or an indicator
Run your EA on
virtual hosting
virtual hosting
Test аn indicator/trading robot before buying
Want to earn in the Market?
How to present a product for a sell-through
Technical Indicators for MetaTrader 5 - 21

AstroCycles: Advanced Financial Astronomy Indicator Overview AstroCycles is a sophisticated technical analysis tool developed for the MetaTrader 5 (MQL5) platform. It bridges the gap between orbital mechanics and financial market analysis by calculating precise astronomical cycles and visualizing them directly on your trading chart. Unlike standard indicators that rely on past price data, AstroMaster utilizes high-precision astronomical algorithms (Keplerian Elements and Brown’s Lunar Theory)
FREE

This powerful tool automatically identifies trend lines, helping you streamline your trading strategy and make more informed decisions. MT4 Version
Key Features Automatic Trend Line Detection : The "Basic TrendLine" indicator scans the market for potential trend lines and displays them on your chart instantly. This saves you valuable time and ensures you never miss an important trend. User-Friendly Panel : Our indicator comes with a beautiful, intuitive panel that allows you to easily draw a v

Easy Trend , as the name implies, is an indicator that easily shows the prevailing trend by bringing several indicators into one. The strategy is: when all indicators point in the same direction a signal is triggered. When red, is a signal to sell, when blue, signal to buy. It is that simple :) There are a total of 9 indicators: Moving Average, RSI, CCI, Parabolic SAR, William's Range, Stochastic, MACD, ADX and Heiken Ashi. It is possible to configure each of these indicators to suit your way of

Мой самый популярный и востребованный продукт здесь https://www.mql5.com/ru/market/product/41605?source=Site+Market+Product+From+Author#
Индикатор стрелочник идеален для торговли в боковике, очень точно показывает моменты перекупленности и перепроданности инструмента, с дополнительными фильтрами также можно использовать для торговли по тренду. На экран выводятся стрелки сигнализирующие о развороте тренда, направление стрелки показывает дальнейшее направление торговли, также имеется звуковое о
FREE

Setup Tabajara was created by a Brazilian trader known as "The OGRO of Wall Street" .
The idea of this setup is to indicate to the trader the current trend of prices and the type of operation should be looked for in the graph.
Operation
It does this through the relation of the closing price position and the of 20 periods, by painting the candles in 4 possible colors : Green -> Price rising in upward trend (Search entry points for PURCHASE) Black -> Price correcting in Bullish Trend (Sear
FREE

The TMA Centered Bands Indicator for MT5 draws bands on the chart and shows the overall price trend. It displays three bands - the lower and upper boundaries of the channel and the median. The bands are made up of moving averages, and each of them has an MA period. The name TMA comes from triangular moving averages, as the indicator draws triangular bands. The price will fluctuate between these ranges whenever the trend changes direction, thus creating entry and exit points. How to trade
FREE

Introducing VFI (Volume Flow Indicator) – a trading indicator that analyzes the relationship between volume and price movement to identify key trading opportunities. The indicator displays the strength and direction of volume flow, providing clear signals about potential entry and exit points. Signals are formed based on zero line crossovers, crossovers between the VFI line and its exponential moving average (EMA), and when the indicator exits overbought and oversold zones.
Attention! This stra
FREE

A pin bar pattern consists of one price bar, typically a candlestick price bar, which represents a sharp reversal and rejection of price. The pin bar reversal as it is sometimes called, is defined by a long tail, the tail is also referred to as a “shadow” or “wick”. The area between the open and close of the pin bar is called its “real body”, and pin bars generally have small real bodies in comparison to their long tails.
The tail of the pin bar shows the area of price that was rejected, and t
FREE
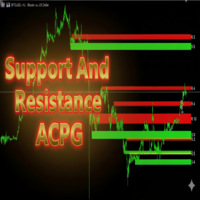
Support And Resistance ACPG Indicator
The Support And Resistance ACPG Indicator (developed by Grok by xAI) is an advanced tool for the MetaTrader 5 (MQL5) platform, designed to identify and visualize support and resistance zones on a price chart. Unlike traditional support and resistance indicators, the ACPG method combines a dynamic approach based on swing points, volatility analysis using the Average True Range (ATR), and an adaptive clustering system to detect high-relevance zones in the
FREE
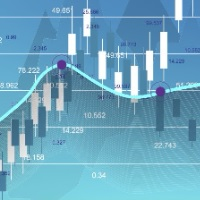
Linear Regression Channel (MTF) Indicator The Linear Regression Channel MTF is an advanced technical indicator that uses statistical analysis to plot a linear regression channel on the price chart, with the capability to display data from a different time frame (Multi Time Frame) for enhanced trend accuracy and analysis. Key Features of the Indicator: Main Line (Linear Regression Line):
Represents the overall price trend over the selected period, allowing traders to easily observe the general s
FREE

Product Name: HTF Candle Insight (EurUsd) - See the Big Picture Description: IMPORTANT: This version works EXCLUSIVELY on the EURUSD symbol. (It supports all broker prefixes/suffixes, e.g., pro.EURUSD, EURUSD.m, but will NOT work on Gold, Bitcoin, or other pairs). Experience the full power of "HTF Candle Insight" completely on EURUSD! Stop switching tabs constantly! This indicator allows you to visualize Higher Timeframe price action directly on your current trading chart. Whether you are a Sca
FREE

BEHOLD!!!
One of the best Breakout Indicator of all time is here. Multi Breakout Pattern looks at the preceding candles and timeframes to help you recognize the breakouts in real time.
The In-built function of supply and demand can help you evaluate your take profits and Stop losses
SEE THE SCREENSHOTS TO WITNESS SOME OF THE BEST BREAKOUTS
INPUTS
MaxBarsback: The max bars to look back
Slow length 1: Period lookback
Slow length 2: Period lookback
Slow length 3: Period lookback
Slow leng
FREE

Gold Storm Signals - Professional XAU/USD Trading Indicator
Gold Storm Signals is a premium multi-confirmation indicator for Gold (XAU/USD) trading on MetaTrader 5. Get precise buy/sell signals with automatic stop loss and take profit levels displayed directly on your chart.
KEY FEATURES:
- Clear Buy & Sell Signal Arrows - Automatic ATR-Based Stop Loss Calculation - Dual TP Levels (TP1 & TP2) - Complete Alert System (Push, Email, Sound) - Works on All Timeframes (M1 to D1) - No Repainting -
FREE
A Smart Price Imbalance Tool with Arrows, Labels, and FVG Zones The Fair Value Gap (FVG) Indicator is designed to automatically detect price imbalance zones on the chart – a widely used concept in Smart Money Concepts (SMC) and Institutional Trading Models (ICT) . These gaps, also known as imbalances or inefficiencies , often highlight areas where price may return to "rebalance" liquidity. Many professional traders consider these levels as high-probability zones for potential reversals, retrace

Pivot Point Supertrend (corresponds to Pivot Point Super Trend indicator from Trading View) Pivot Point Period: Pivot point defined as highest high and highest low... input 2 = defining highest high and highest low with 2 bars on each side which are lower (for highest high) and are higher (for lowest low calculation) ATR Length : the ATR calculation is based on 10 periods ATR Factor: ATR multiplied by 3
FREE

Original supertrend indicator in Tradingview platform. Indicator type: Price Action indicator Introduction: The Supertrend Indicator - Enhancing Your Trend Analysis. If you haven't yet found a Supertrend indicator with good graphics on the MQL5 platform, this is the indicator for you. Overview: The Supertrend Indicator is a powerful tool designed to provide traders with valuable insights into the current and historical trends of financial markets. It serves as a valuable addition to any t
FREE
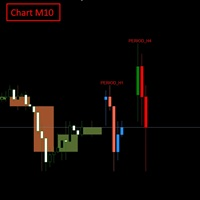
FULL PRODUCT DESCRIPTION Multi-Timeframe Candle Overlay Pro lets you view higher-timeframe candles directly on your current chart with absolute accuracy. When trading lower timeframes like M1–M15, understanding what the H1–H4 candles are forming is a major advantage: you avoid counter-trend entries, read market context faster, and trade with more confidence.
The indicator supports up to 2 higher timeframes, drawing full OHLC candles with precise positioning—no misalignment, no distortion. C
FREE

Several assets in several markets have the behavior of using specific numbers as Force Numbers, where support, resistance and price thrust is created. Let this indicator draw those levels of support and resistance for you. You can also stack it to show different level of Prices! This technique is being used by Tape Readers and Order Flow traders all over the world for a long time. Give it a try. Challenge yourself to study new ways of Price Action!
SETTINGS
What Price reference to use in the c
FREE

MATADOR GOLD – XAUUSD MT5 M5 Timeframe Scalp Signals MATADOR GOLD is a professional signal indicator designed for XAUUSD (Gold) scalping on the M5 timeframe , with optional higher-timeframe confirmation. This indicator does not open or manage trades automatically .
It provides structured buy and sell signals, intelligent filtering, and alerts, allowing traders to execute trades using their own strategy and risk management rules. Core Concept (Multi-Concept Architecture) MATADOR GOLD is built

The Solarwind No Repaint is a technical oscillator that applies the Fisher Transform to normalized price data, creating a histogram-based indicator that identifies potential market turning points. This indicator converts price movements into a Gaussian normal distribution, making cyclical patterns and momentum shifts more visible to traders. How It Works The indicator processes price data through several computational steps: High-Low Analysis : Calculates the highest high and lowest low over the
FREE

TrendBoard ALMA SimpleVer — Надёжный и наглядный контроль тренда TrendBoard ALMA SimpleVer — это стабильная и удобная панель, которая помогает быстро и точно оценивать рыночный тренд на нескольких таймфреймах. Бесплатная версия поддерживает три ключевых инструмента: USDJPY / EURUSD / BTCUSD , обеспечивая уверенный контроль за изменениями тренда в реальном времени. Преимущества SimpleVer Точное определение тренда на основе ALMA Плавная фильтрация шума и уверенная классификация тренда в пя
FREE

SUPERTREND INDICATOR MT5 Developer: gedeegi General Description GEN SmartTrend Signal is a comprehensive technical indicator for MetaTrader 5 (MT5), focused on trend identification and automated risk management. It utilizes a refined SuperTrend -based algorithm powered by the Average True Range (ATR) to determine the primary trend direction. What sets this indicator apart is its integrated trade management features displayed directly on the chart, including visual placement of Stop Loss (SL)
FREE
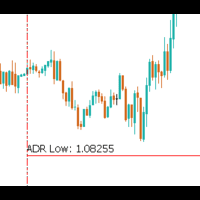
The Average Daily Range (ADR) is a powerful tool for traders, especially those focused on intraday and scalping strategies. It provides valuable insights into the expected price movement for the day and how price action is behaving relative to historical trends. The ADR indicator shows the following key information: Today's ADR : The typical range of price movement for the current trading day, based on historical data. 3x Today's ADR : Three times the current ADR, showing potential price moveme
FREE
The Round Level Indicator automatically draws psychologically significant price levels directly on your chart.
These round numbers often act as key support and resistance zones across all markets and timeframes.
Round Levels are used in my automated EA: Opal This indicator works best when combined with other tools and strategies, e.g.: Price Action Strategies
Round levels often align with key support/resistance. Use it with candlestick patterns (like pin bars or engulfing bars) to confirm high
FREE
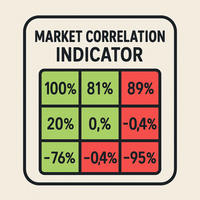
General Description
This indicator calculates in real time the Pearson correlation coefficient between multiple financial instruments. It displays a dynamic correlation matrix that shows the strength and direction of relationships among currencies, indices, stocks, and commodities. Main Parameters SymbolsList : list of instruments to compare (comma separated) BarsToAnalyze : number of historical bars used for calculation TimeFrame : timeframe for correlation analysis Correlation Interpretation
FREE

Finally a Metatrader version of the very popular (and expensive) Market Cipher B indicator, or the Vumanchu Cipher B + Divergences very popular on Tradingview platform.
This tool is very heavy on calculations, total are 31 plots using 97 buffers from several indicators. On my mid end computer, timeframes below M15 start getting a bit laggy, so it would require a powerful computer to run it properly at very low timeframes. It's still usable here, but somewhat sluggish response in Metatrader (lik
FREE

BUY INDICATOR AND GET EA FOR FREE AS A BONUS + SOME OTHER GIFTS! ITALO TREND INDICATOR is the best trend indicator on the market, the Indicator works on all time-frames and assets, indicator built after 7 years of experience on forex and many other markets. You know many trend indicators around the internet are not complete, does not help, and it's difficult to trade, but the Italo Trend Indicator is different , the Italo Trend Indicator shows the signal to buy or sell, to confirm the signal t

BUY INDICATOR AND GET EA FOR FREE AS A BONUS + SOME OTHER GIFTS! ITALO VOLUME INDICATOR is the best volume indicator ever created, and why is that? The Indicator works on all time-frames and assets, indicator built after 7 years of experience on forex and many other markets. You know many volume indicators around the internet are not complete, does not help, and it's difficult to trade, but the Italo Volume Indicator is different , the Italo Volume Indicator shows the wave volume, when market

The Horse DCA Signal 1.26 – สุดยอดนวัตกรรมอินดิเคเตอร์สำหรับการเทรดทองคำและทุกสินทรัพย์ The Horse DCA Signal คืออินดิเคเตอร์รุ่นล่าสุดจากตระกูล WinWiFi Robot Series ที่ได้รับการออกแบบมาเพื่อยกระดับการเทรดบนแพลตฟอร์ม MT5 โดยเฉพาะ โดยเป็นการผสมผสานอัจฉริยะระหว่างกลยุทธ์ Follow Trend และ Scalping เข้าด้วยกันอย่างลงตัว คุณสมบัติเด่น: ระบบลูกศรแยกประเภทชัดเจน: ลูกศรสีทอง: บ่งบอกสภาวะตลาดช่วง Sideway เหมาะสำหรับการเทรดแบบ Swing Trade หรือ Scalping เก็บกำไรระยะสั้น (2) ลูกศรสีน้ำเงินและสีแดง: บ่งบอกส
FREE

Real Trend Zigzag PRO shows the real trend of a market, u nlike the default Zigzag indicator. It calculates the trend in real time and shows green lines for upwards trends, red lines for downward trends and blue lines for no trends. Regarding the old slogan "the trend is your friend" it helps you to decide if should open a buy or sell position. The PRO version is a multi timeframe zigzag (MTF). Means, it shows the trend of the current timeframe as well as the trend of a higher or lower time.

Enjoy the Free Candle Color indicator.
Kijun Sen is an element of Ichimoku Kinko Hyo Indicator, it's far too complicated for many traders hence they tend to be confused. We have simplified it so the Kijun Sen will change colors as it activates without the Tenkan Sen, Senkou Span, Up Kumo and Down Kumo. Customize to your period parameter and colors of your choice. Great for beginners and seasoned traders. Set your period and enjoy
GOOD LUCK and ALL THE BEST IN YOUR TRADING JOURNEY !!!!!
FREE

Market Sessionsync** is a cutting-edge trading session indicator designed to enhance your trading experience by visually breaking down the market's daily rhythm. With a compact window overlaid on your chart, this indicator provides a split-second understanding of the current trading session through: Basic setup: Set Difference between your local time and your broker time , set DST(Daylight Saving Time) ON or OFF , set timescale sync you want to use (Local, Broker, CET) - A vertical time marker
FREE

For those who love to follow Volume behavior here it is a little indicator that could be used as a replacement for the old and standard MT5 built-in volume indicator. The trick here is that this indicator paints the volume histogram based on the direction of the candle giving to the trader a quick "Heads Up" on what is happening, visually! It could be used to study and see for instance, the volume and past bars volume during (or, reaching) a peak (Tops and Bottoms). UP candles are shown in pale
FREE

M & W Pattern Pro is an advanced scanner for M and W patters , it uses extra filters to ensure scanned patterns are profitable.
The indicator can be used with all symbols and time frames.
The indicator is a non repaint indicator with accurate statistics calculations.
To use , simply scan the most profitable pair using the statistics dashboard accuracy , then enter trades on signal arrow and exit at the TP and SL levels.
STATISTICS : Accuracy 1 : This is the percentage of the times price hits TP

Free forever simple pip meter for MT5 with customizable font color. Display profit or loss in both points count and currency value. Supports 4 currency symbols ($,€,£ ,¥). For unsupported currencies, it shows a 3-character currency short form. Enhance your trading interface with clarity and precision. Easy to use and tailored for diverse Forex traders. Perfect for MT5!
FREE

Idea extracted from the books by Anna Coulling and Gavin Holmes using Volume and Spread Analysis (VSA) techniques coupled with Al Brooks' expertise with Price Action these candles are magical, identify the exact moment
of the performance of the big players are acting in the market represented by the colors:
1) Red Candles we have an Ultra High activity,
2) Candles Orange we have a Very High Activity
3) Candles Yellow we have one High Activity
4) White Candles represent normal activity in
FREE

Velas Multi Time Frame
Las velas multi time frame, también conocidas como "MTF candles" en inglés, son un indicador técnico que permite visualizar velas japonesas de un marco temporal diferente al marco temporal principal en el que estás operando. Este enfoque ofrece una perspectiva más amplia del comportamiento del precio, lo que resulta especialmente útil para los traders que emplean estrategias de acción del precio. A continuación, se detallan los conceptos clave relacionados con este indic
FREE

If you love this indicator, please leave a positive rating and comment, it will be a source of motivation to help me create more products <3 How to use SuperTrend? When the price crosses above the supertrend line it signals a buy signal and when the price crosses below the supertrend line it signals a sell signal. The supertrend indicator which acts as a dynamic level of support or resistance and helps traders make informed decisions about entry and exit points. When prices are above s upertre
FREE

Advanced Elder's Force Index (EFI) Indicator with multi timeframe support, customizable visual signals, and highly configurable alert system.
Features: Visual signal markers (arrows and/or vertical lines) with customizable colors and codes Three independent signal buffers with configurable triggers (direction change, level cross, peak/valley) Highly customizable alert functions for each signal (via email, push, sound, popup) Configurable alert timing (after close, before close, or both) Multi
FREE

The Bull DCA DowJones Signal – Premium Trend & Swing Indicator (WinWiFi Robot Series) Overview: Unlock the full potential of Index trading with the latest innovation from the WinWiFi Robot Series . "The Bull DCA DowJones Signal" is a precision-engineered indicator designed to conquer global Indices, Energy, and Forex markets. Optimized for the H4 Timeframe , this tool filters out market noise and delivers clear, actionable signals for Trend Following, Breakouts, and Pullbacks.
Key Features & S
FREE

We often need to know the sudden change in trend that happens on the graph and this can be confirmed through indicators.
This indicator shows the moments of trend reversal and how in which trend the price is shifting.
Custom background, no need to configure the colors in the chart, just drag the indicator!
Indication with arrows.
- Blue arrow: Upward trend.
- Pink Arrow: Downward Trend.
NOTE: Free indicator, support may take a while to respond.
FREE

This indicator displays two important pieces of information on the MT5 chart: Current Spread - Trading cost measured in points, helping traders assess optimal entry timing when spread is low. Time Countdown - Remaining time (minutes:seconds) until the current candle closes and a new candle forms, supporting candle-based trading strategies. Information is displayed as compact text in a chart corner (default top-right), with customizable position, color, and font size. The indicator updates in rea
FREE

The Spots Indicator can be used for Entering and Exiting your trades based on the common candlestick patterns such as: engulfing, hanging man, doji etc. It is designed to publish desktop and mobile notification every time a signal is triggered. However, it is worth noting that this indicator is recommended to be used with other indicator for confirming the entries. It is best to use it with the Investment Castle Trend Lines indicator and the Supply and Demand indicator .
FREE
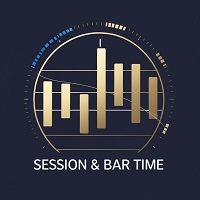
The Sessions and Bar Time indicator is a professional utility tool designed to enhance your trading awareness and timing precision on any chart. It combines two key features every trader needs — market session visualization and real-time bar countdown — in one clean, efficient display. Key Features: Candle Countdown Timer – Shows the remaining time before the current candle closes, helping you anticipate new bar formations. Market Session Display – Automatically highlights the four main trading
FREE
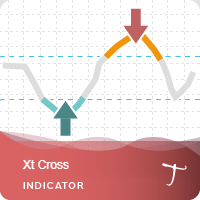
Xt Cross is a port of a famous TS /MT indicator.
When the oscillator is above the overbought band (red lines) and crosses down the signal (dotted line), it is usually a good SELL signal. Similarly, when the oscillator crosses above the signal when below the Oversold band (green lines), it is a good BUY signal.
Xt Cross Advantages The indicator is suitable for scalping and intraday trading. It is possible to evaluate the effectiveness of the indicator on history. The indicator does not
FREE

My Fibonacci MT5 An automated Fibonacci indicator for MetaTrader 5 that combines ZigZag swing detection with comprehensive Expert Advisor integration through a 20-buffer system. More details about data specification and EA integration: https://www.mql5.com/en/blogs/post/764114 Core Features Automated Fibonacci Detection The indicator identifies swing points using configurable ZigZag parameters and draws Fibonacci retracements and extensions automatically. It updates levels as new swing formatio
FREE
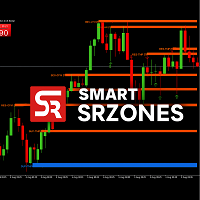
SmartSRZones is an MT5 indicator designed to automatically detect, display, and manage support and resistance zones directly on the chart.
It combines market structure recognition with candlestick pattern detection to help traders view important price levels without manual marking. The indicator is suitable for different trading approaches, including short-term and long-term analysis. Key Features Automatic Zone Detection Identifies support and resistance areas based on swing points, volume, an
FREE
The Pulse is an indicator that shows the accumulation period in real time. In simple words: Accumulation is when "smart money" quietly collects an asset before launching a powerful movement in the market. On the chart, it looks like the price is "stuck" in one range. This is the accumulation phase — someone is preparing for a big move. And if you learn to notice these moments — when the market seems to "freeze", but at the same time tension is felt — you can be in the right place at the right t

The "HiperCube USD INDEX (DXY /USDX)" is a financial benchmark representing the performance of a specific group of assets, like stocks, bonds, or commodities, with values denominated in U.S. dollars. These indices help investors track and compare the performance of particular sectors or markets over time. By being expressed in USD, the index provides a consistent measure for evaluating investments, regardless of the assets' native currency or geographical location. Discount code for 20% off at
FREE

Swiss VWAPsimple Motivation Did not find free VWAP that works, the one that I found craseh. So I created a VWAP which calculates values only for the actual day. So computer resouces are not over stressed.
What is VWAP, how is it used? VWAP stands for Volume Weighed Average Price, it calculates the running sum of tick volume and the runnung sum of price times tickvolume. The division of these sums result in a weighed price (Sum P*V/Sum V). The calculation starts normally at midnight. The values
FREE

Mouse Calculation quickly calculates each order’s P/L if closed at the price level you point to with your mouse. Ideal for quick decisions when managing multiple orders such as grid, martingale, and scaled entries. Break-even and target price levels at a glance. Key Features Mouse PnL (M) : Preview per-order and total P/L (including swap). Break even Price (B) : Show the basket break-even price / break-even line. Time_Sync_Lines (T) : Align the same time-of-day across the most recent N days for
FREE

Boost your trend-spotting capabilities with the Consecutive Candle Indicator MT5, a dynamic tool designed to identify streaks of bullish or bearish candles, delivering timely alerts for trend confirmations and potential reversals in forex, stocks, crypto, and commodities markets. Celebrated in trading communities like Forex Factory and Reddit’s r/Forex, as well as praised in discussions on Investopedia and TradingView for its ability to simplify momentum analysis, this indicator is a favorite a
FREE

- Displays horizontal lines for Previous Day High (PDH) and Previous Day Low (PDL) on the chart. - Customizable line colors via input parameters. - Sends sound alerts, pop-up notifications, and mobile push notifications upon the initial crossover of PDH or PDL. - Alerts are triggered only once per crossover event; they re-trigger only if the price moves away and re-crosses after a specified minimum interval. - Automatically updates the PDH/PDL levels at the start of each new day. - All indicator
FREE

Jackson trendline scanner it a powerful price action tool which draw accurate trendlines and alert a breakout signals . As we all know that trendlines it a most powerful tool in price action by providing us with different chart patterns. e.g. Bullish flag, Pennant, Wedges and more...It not easy to draw trend lines, Most successful traders use trendlines to predict the next move based on chart pattern and breakout. Drawing a wrong trendline it a common problem to everyone, wrong
FREE
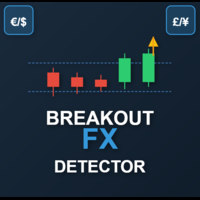
This is a powerful, session-aware breakout indicator designed for serious traders who thrive on volatility and structure. Engineered for precision, it identifies high-probability breakout zones during the London and New York trading sessions—where the market moves with intent. Key Features: Session Range Detection
Automatically detects and highlights the key price range of London and New York sessions. Breakout Confirmation
Identifies breakout candles after the session range, with clear bullis
FREE

Mahdad Candle Timer MT5 — Real‑Time Candle Countdown Mahdad Candle Timer is a lightweight and precise MetaTrader 5 indicator that displays the remaining time until the current candle closes, shown directly beside the latest bar. It is designed for traders who rely on accurate timing — whether scalping, day trading, or waiting for candle confirmation in swing setups. Key Features Accurate Countdown – Remaining time in HH:MM:SS (optional milliseconds) Dynamic Placement – Always aligned with th
FREE
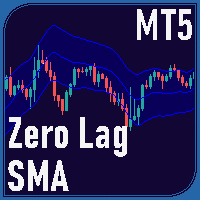
Zero Lag SMA for MT5 The Zero Lag SMA (ZLSMA) indicator for MT5 provides a variation of the Simple Moving Average (SMA) designed to minimize lag, offering traders a more responsive moving average that adjusts more quickly to price changes. This makes it useful for identifying potential trend reversals and key price levels in a timely manner.
If you want to see more high-quality products or order the development/conversion of your own products, visit my partners' website: 4xDev
Get 10% OFF on m
FREE
https://www.mql5.com/en/users/gedeegi/seller
The "RSI+ with 123 Fractals" logo is designed to provide a clear and professional visual representation of a complex technical indicator, focused on precise market analysis and reliable patterns. Each element in the design is crafted to reflect the philosophy and strengths of the indicator within the trading world. Design Elements: "RSI+" Text in Bold and White:
The main "RSI+" text is chosen to be the focal point, with a bold and clear font. The us
FREE

This indicator was created as an MT5 version inspired by a TMA RSI Divergence indicator found on TradingView.
This indicator detects both Regular and Hidden divergences using RSI pivot points, similar to TradingView's pivot-based divergence logic.
-------------------------------------------------- Features -------------------------------------------------- • Regular Bullish / Bearish divergence • Hidden Bullish / Bearish divergence • Pivot-based detection (Left / Right bars) • Optional RSI SM
FREE
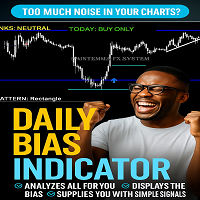
INTRODUCING the Powerful Daily Bias Indicator
The Daily Bias Indicator
Stop Guessing. Start Trading with Confidence.
Tired of staring at your charts and not knowing if today is a buy day or a sell day? The Daily Bias Indicator does the heavy lifting for you.
It scans the market using 7 powerful tools (EMA trend, RSI, MACD, ADX, Volume, Pivot Points & Price Action). It tells you in plain language:
“TODAY: BUY ONLY”
“TODAY: SELL ONLY”
Or “NO CLEAR BIAS” (so you don’t waste money
FREE

Unlock the full potential of your Pro Thunder V9 indicator with our revolutionary new plugin - Auto Trend Lines! Are you looking for a competitive edge in today's dynamic market? Look no further. With Auto Trend Lines, you can harness the power of precise market trend analysis to make informed trading decisions. This innovative plugin seamlessly integrates with your Pro Thunder V9 indicator, providing you with real-time trend data and pinpointing exact entry and exit points for your trades. Key
FREE

Breakout 4-in-1 Package Core Functionality The indicator serves as a "Trend Confirmation Engine." It identifies when the price breaks through a key structural level and then uses secondary oscillators to verify if the move has enough strength to continue. 1. The Breakout Engine (S&R) The foundation of the indicator is identifying Support and Resistance (S&R) . When price closes above resistance or below support, the indicator triggers an alert. Horizontal Levels: Breaks of previous highs/lows or
FREE

Opening Range Indicator
Idea Toby Crabel introduced this way of trading in the ealy ninties in his book "Day Trading with Short Term Price Patterns and Opening Range Breakout". In simple terms this means to trade the brekouts from the limits of the first trading hour with the stop loss at the opposite side. I.e. if the first hourly candle meausres 40 points (Crabel calls this the "stretch") you set the stop loss at breakout level minus 40 points and the take profit at the breakout level plus 4
FREE

TransitX1 indicator is very useful, with unlimited signals and works on all the timeframes and all the piers. TransitX1 draws two trend lines very short trendlines (+/-20 bars) which can be considered as support and resistance. The support is in red trendline and the resistance is in green trendline. TransitX1 gives buying and selling signals, with only 3 being previous signals and the 4th one being the current signal. Buying signals are in green arrows and are always on the support trendline an
FREE

Fair Value Gap Sweep is a unique and powerful indicator that draws fair value gaps on your chart and alerts you when a gap has been swept by the price. A fair value gap is a price gap that occurs when the market opens at a different level than the previous close, creating an imbalance between buyers and sellers. A gap sweep is when the price moves back to fill the gap, indicating a change in market sentiment and a potential trading opportunity.
Fair Value Gap Sweep indicator has the following
FREE
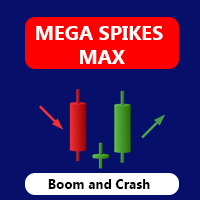
Mega Spikes Max is a specialized indicator for Boom and Crash synthetic indices that generates trading signals with automatic alert notifications. Features The indicator analyzes market conditions using proprietary algorithms and displays buy/sell arrows directly on the chart. It works specifically with Boom and Crash indices on M5 timeframe. Signal generation combines multiple technical analysis methods to identify potential trading opportunities. The system provides two TP levels and SL calcu
The Hammer and Doji Scanner is a powerful technical analysis tool designed for MetaTrader platforms, such as MetaTrader 4 (MT4) and MetaTrader 5 (MT5), to detect and highlight key candlestick patterns, specifically the Hammer and Doji . These patterns are widely used by traders to identify potential trend reversals or periods of indecision in the market. Hammer: The Hammer is a bullish reversal candlestick pattern that appears after a downtrend. It is characterized by a small body near the top o
FREE

Enhance your price action strategy: inside bar breakouts at your fingertips
This indicator detects inside bars of several ranges, making it very easy for price action traders to spot and act on inside bar breakouts. [ Installation Guide | Update Guide | Troubleshooting | FAQ | All Products ] Easy to use and understand Customizable color selections The indicator implements visual/mail/push/sound alerts The indicator does not repaint or backpaint An inside bar is a bar or series of bars which is/a
FREE

If you love this indicator, please leave a positive rating and comment, it will be a source of motivation to help me create more products <3 How to use QQE? Determine trend when RSI MA above 50 indicate a bullish market, while RSI MA below 50 indicate a bearish market and can server as a trend filter. Identify short-term up/down momentum, when the RSI MA crosses up Smoothed signals bullish momentum, and when the RSI MA crosses down Smoothed signals bearish momentum. It is also possible to
FREE
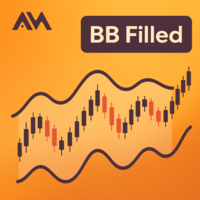
A clean Bollinger Bands indicator with single-color filling designed to reduce chart clutter. What is This Indicator? This is a Bollinger Bands technical indicator designed with visual simplicity in mind. Unlike standard Bollinger Bands implementations that display multiple colored lines and bands, this indicator uses a single-color filled area to represent the trading bands. This approach minimizes visual clutter while maintaining full functionality for technical analysis. How It Works The ind
FREE
The MetaTrader Market is a simple and convenient site where developers can sell their trading applications.
We will help you post your product and explain you how to prepare your product description for the Market. All applications on the Market are encryption-protected and can only be run on a buyer's computer. Illegal copying is impossible.
You are missing trading opportunities:
- Free trading apps
- Over 8,000 signals for copying
- Economic news for exploring financial markets
Registration
Log in
If you do not have an account, please register
Allow the use of cookies to log in to the MQL5.com website.
Please enable the necessary setting in your browser, otherwise you will not be able to log in.