Watch the Market tutorial videos on YouTube
How to buy а trading robot or an indicator
Run your EA on
virtual hosting
virtual hosting
Test аn indicator/trading robot before buying
Want to earn in the Market?
How to present a product for a sell-through
Technical Indicators for MetaTrader 5 - 46

The Haos oscillator coded for the MT5!
This oscillator allows to verify overbought / oversold regions in two periods (14 and 96, for example), making it possible to anticipate a reversal. Possibility to activate an audible alert when it reaches a defined level. Possibility to choose the alert sound by placing a .wav song in each asset or timeframe. (save a .wav file to the MQL5 \ Files folder) Possibility to activate / deactivate histogram and levels to make the screen cleaner. Customizable col

Elevate your breakout trading with the Support Resistance Breakout Indicator MT5, a powerful ZigZag-driven tool that dynamically identifies support and resistance zones, delivering confirmed breakout signals for high-probability entries in forex, stocks, crypto, and commodities markets. Drawing from established price action principles outlined on sites like Investopedia and BabyPips, where breakouts from support/resistance are hailed for signaling trend reversals or continuations by shifting bu
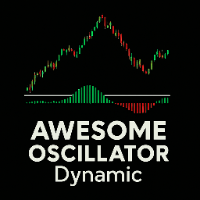
Awesome Oscillator Dynamic Technical indicator that displays, via a histogram, the difference between two simple moving averages (SMA 5 and SMA 34) applied to the median price. Bar colors change automatically to show market momentum: green for bullish, red for bearish. Quick reading: Green above zero → bullish momentum Red below zero → bearish momentum Zero crossover → possible trend change Compatible with any asset and timeframe, no setup required. Uses standard terminal data and appears in a
FREE
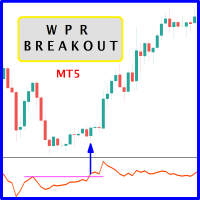
The likelihood of farther price movement increases when Larry Williams Percentage Range oscillator "WPR" breaks through its historical resistance levels in conjunction with prices breakout of resistance levels. It's strongly encouraged to confirm price breakout with oscillator breakout since they have comparable effects to price breaking support and resistance levels; similar perception is applied to short trades. Concept is based on find swing levels which based on number of bars by each side t
FREE

Simple alternate MACD version like the one used in tradingview. Two lines (MACD & signal line) and a histogram. This MACD version can be used in many different ways. Potential trades are the crossing of the MACD & signal line, the crossing of the MACD through the 0-line of the histogram, the MACD being under the 0-line of the histogram or the movement of the histogram itself. A combination of these potential signals on different timeframes can be very precise, but always needs additional confirm
FREE

El indicador técnico Non Lag MA (Non-Lagged Moving Average) es una variante de la media móvil que busca reducir el retraso inherente a las medias móviles tradicionales.
Pros: - Menos retraso: Al estar diseñado para reducir el retraso, el Non Lag MA puede proporcionar señales más rápidas que las medias móviles tradicionales. - Tendencias claras: Las líneas del Non Lag MA muestran claramente las tendencias alcistas y bajistas, lo que facilita la interpretación de la dirección del mercado. - Pers
FREE

NewTest https://backoffice.aurum.foundation/u/DHXP1U
hello. The indicator shows the levels of change in the spread per unit of time when its values are higher. Practice shows that the change in volumes is associated with the warning and advance of speculative activity, especially at key moments: Fed news, oil news, speeches by leaders of the IDR countries. We are very happy to present new developments. Thanks.
FREE

The ATR Indicator Based on Heiken Ashi is a unique volatility analysis tool that combines the Average True Range (ATR) with Heiken Ashi candlestick calculations to provide a smoother and more reliable measure of market volatility. Unlike the traditional ATR, which uses standard candlesticks, this indicator applies the Heiken Ashi formula to filter out market noise and deliver a clearer volatility signal.
Key Features: • ATR Calculation Based on Heiken Ashi Candlesticks – Offers a more stable v
FREE

New candlestick alert, the alert appears according to the timeframe it is placed on. The indicator works on any asset, the alert can be silenced at any time, without the need to remove the indicator from the graph. It's great for those who can't keep an eye on the chart all the time. You can use this tool at work, college or anywhere else. It is also possible to receive signals directly on your cell phone by connecting to the metatrader. Aurélio Machado.
FREE

VPS Terminal Restart Detection & Monitoring for MetaTrader Users Understanding the Need for VPS Restart Monitoring When running MetaTrader 5 (MT5) or MetaTrader 4 (MT4) Expert Advisors on a Virtual Private Server (VPS), detecting terminal restarts is critical for maintaining continuous automated trading operations. VPS servers can restart unexpectedly due to maintenance, updates, system failures, or resource management processes. Without proper monitoring, traders may discover hours later that t
FREE

MyHistogram The MyHistogram indicator is a tool designed to help users visualize the distance between price extremes and a moving average. By calculating and displaying this distance in a histogram format, it allows to quickly assess market trends, spot potential reversals, and make more informed trading decisions. The indicator is highly customizable, enabling users to select different timeframes, moving average types, and applied price settings. Additionally, it features a color-coded syste
FREE

Бинарный индикатор находит свечной паттерн "Поглощение" и рисует соответствующий сигнал для входа рынок. Имеет встроенные фильтры и панель для просчета количества успешных сделок. Демо версия является ознакомительной, в ней нет возможности изменять параметры. Полная версия . Особенности Работает для всех валютных пар и любых таймфреймов. Индикатор рассматривает комбинацию из 2-х или 3-х свечей в зависимости от настроек. Имеется возможность фильтровать сигналы путем настройки количества свече
FREE

MultiTimeframe Trend Pro shows you the market direction across 7 timeframes at a glance. Clear colors, no repainting, fully customizable. Perfect as a quick filter for any intraday or swing strategy.
Key Features Supports M1, M5, M15, H1, H4, D1 and W1
Colors MediumSeaGreen when the close is above the MA, and Red when below
No repainting → always based on the last closed candle for each timeframe
Fully customizable: MA period (200 by default) font, size and colors X/Y offsets, spacing
FREE

"Driver Road Bands" indicator that is designed to be used in the 1H, 4H and 1D timeframes in the most ideal way. If we compare timeframes to roads and streets; main streets and highways with high traffic volume are similar to high-time timeframes in technical analysis. If you can interpret the curvilinear and linear lines drawn by this indicator on the graphic screen with your geometric perspective and develop your own buy and sell strategies; you may have the key to being a successful trader.
FREE

Points of Inertia is a powerful tool for detecting critical points of price movement, based on the idea of calculating the inertia of price fluctuations.
_________________________________
How to use the indicator signals:
The indicator generates a signal after a new price bar appears. It is recommended to use the generated signal after the price breaks through the critical point in the specified direction. The indicator does not redraw its signals.
_________________________________
The in
FREE

Bollinger Bands Technical Indicator (BB) is similar to envelopes. The only difference is that the bands of Envelopes are plotted a fixed distance (%) away from the moving average, while the Bollinger Bands are plotted a certain number of standard deviations away from it. Standard deviation is a measure of volatility, therefore Bollinger Bands adjust themselves to the market conditions. When the markets become more volatile, the bands widen and they contract during less volatile periods. This ada
FREE

Are you having trouble with too many events in the economic calendar? This reduces to the minimum number you need. You can filter by country code importance any key words and you can receive alerts before the set time of the event. ++++++++++++++ If country code is blank, display available code on the expert tab. You need to turn off the automatic calendar update setting in MT5. Any sound file of .wav format in Sounds directory. The length of keyword characters is limited by MT5.
FREE
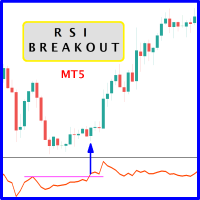
The likelihood of farther price movement increases when Relative Strength Index oscillator "RSI" breaks through its historical resistance levels in conjunction with prices breakout of resistance levels. It's strongly encouraged to confirm price breakout with oscillator breakout since they have comparable effects to price breaking support and resistance levels; similar perception is applied to short trades. Concept is based on find swing levels which based on number of bars by each side to confir
FREE

В стандартном индикаторе DeMarker используется простая скользящая средняя - Simple Moving Average, что несколько ограничивает возможности этого индикатора. В представленном индикаторе DeMarker Mod добавлен выбор из четырех скользящих средних - Simple, Exponential, Smoothed, Linear weighted, что позволяет существенно расширить возможности данного индикатора. Параметры стандартного индикатора DeMarker: · period - количество баров, используемых для расчета индикатора; Параметры индикат
FREE
This is a free helper indicator for MT5 that will help traders setup their constant volume charts depending on their trading style. It will calculate the number of ticks that your constant volume chart should have depending on the following trading styles: Scalper Active Day trader Day trader Swing trader Position trader Instruction video attached.
Enjoy!
FREE
This indicator is an advanced loss position monitor, designed to help you react in time and protect your capital. It analyzes all open trades on the current symbol in real-time, calculates volatility using ATR on multiple timeframes, and determines how close the price is to your Stop Loss. It displays visual lines ( dynamic Stop Loss and Break-Even ) and a Bloomberg-style panel with key information for each trade: Loss percentage relative to your balance Distance to Stop Loss in pips and ATR mul
FREE

Fibonacci Trend Indicator for MT5 Unlock the power of Fibonacci analysis on your MetaTrader 5 charts!
Our Fibonacci Trend Indicator automatically plots dynamic support and resistance levels so you can spot trends, reversals, and breakout opportunities at a glance. Features & Advantages Automatic Fibonacci Levels
Instantly displays seven key Fibonacci retracement levels based on the highest and lowest prices from your chosen lookback period — no manual work required. Dynamic Trend Adaptatio
FREE

Hello,
This is an easy symbol change panel.
The free version only can change major pairs which are "AUDUSD, EURUSD, GBPUSD, USDCHF, USDCAD, USDJPY, NZDUSD"
The full version can add your symbols.
FULL version here:
https://www.mql5.com/en/market/product/71173?source=Site+Market+MT5+Indicator+New+Rating005#description
Also, can change the TimeFrame as well.
Symbols must be active on your Market Watch list.
Parameters:
ratio - change the size LineNumber - you can set that how many symbo
FREE
ForexRubyEA is a fully automated trading system designed to simplify your trading. Using forexruby Custome Indicator.
It manages trades with smart logic, risk control, and built-in protection features — all without requiring constant monitoring. Download EA for this indicator: forexrubyaibot DM: https://www.mql5.com/en/users/forexruby/
Key Features Plug & Play – Easy setup, works out of the box. Automated Trading – Places, manages, and closes trades automatically. Risk Management –
FREE

Advanced Volume Flow Indicator A professional volume analysis tool that helps traders identify potential market reversals and trend confirmations through advanced volume flow calculations and smart filtering algorithms. Main Features Advanced volume analysis with precision filtering Real-time trade signals with price levels Smart alert system for automated trade detection Clear visual representation with color-coded volume bars Multi-timeframe optimization Professional-grade calculat
FREE

The utility draws pivot levels for the selected timefram in classic method. Pivot = (high + close + low) / 3 R1 = ( 2 * Pivot) - low S1 = ( 2 * Pivot) - high R2 = Pivot + ( high - low ) R3 = high + ( 2 * (Pivot - low)) S2 = Pivot - (high - low) S3 = low - ( 2 * (high - Pivot)) you can change the timeframe, colors and fontsize. also you can change the text for the levels.
Have fun and give feedback...
FREE

Фрактальная дивергенция - это скрытая дивергенция, построенная на фракталах Билла Вильямса. Бычья фрактальная дивергенция представляет собой комбинацию из двух нижних фракталов, последний из которых расположен ниже предыдущего, и при этом две свечи справа от минимума последнего фрактала имеют минимумы выше уровня предыдущего фрактала (см. скриншот 1). Медвежья фрактальная дивергенция - это комбинация из двух соседних верхних фракталов, последний из которых расположен выше, чем предыдущий верхн
FREE
Indicador IMI (Intraday Momentum Index) Descrição O Indicador IMI (Intraday Momentum Index) é uma poderosa ferramenta de análise técnica desenvolvida para identificar a força do momentum e potenciais reversões no mercado. Este indicador quantifica a relação entre ganhos e perdas durante um período específico, ajudando traders a avaliar a dinâmica atual do mercado. Características Oscila entre 0 e 100, facilitando a interpretação das condições de mercado Identifica com precisão áreas de sobrecomp
FREE

Trading Guide MT5 Indicator - Ultimate Trading Psychology Assistant Description
The Trading Guide MT5 Indicator is a powerful psychological trading assistant designed to keep traders disciplined, focused, and emotionally balanced. This innovative indicator displays real-time motivational messages, trading rules, and analysis guidelines directly on your chart, with vibrant blinking colors to capture your attention and reinforce proper trading habits.
Key Features
Real-Time Trading Psychology
FREE

Imbalance DOM Pro: Enhance Your Trades with the Book Imbalance DO YOU HAVE ACCESS TO THE ORDER BOOK ON MT5? WANT TO TAKE YOUR TRADING TO THE NEXT LEVEL? If you're a trader who relies on order flow for decision-making, Imbalance DOM Pro can transform your analysis. Designed specifically for scalpers and short-term traders, it identifies imbalances in the order book, uncovering valuable opportunities for quick and precise trades. Seize Opportunities in Small Price Movements
Imbalance DOM
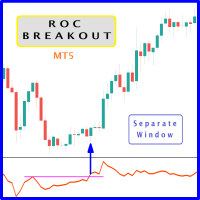
When prices breakout resistance levels are combined with Rate of Change oscillator "ROC" breaks out its historical resistance levels then higher chances emerges to record farther prices. It's strongly encouraged to confirm price breakout with oscillator breakout since they have comparable effects to price breaking support and resistance levels; certainly short trades will have the same perception. Concept is based on find swing levels which based on number of bars by each side to confirm peak or
FREE

516/5000 Average volume indicator to calculate the average volume for a given period. Useful as a filter to measure the strength of a trend, or false breaks in support or resistance.
It does not give a signal to buy or sell, it only acts as a filter to avoid entering into transactions with a drop in volume, or below-average volume, which may indicate disinterest in trading at the price level.
It has only the parameters of period, method of calculating the average and type of volume.
It h
FREE

I present the well-known Moving Average indicator.
This indicator is presented as a channel, where the upper and lower lines are equidistant from the main line by a percentage set by the user.
The indicator is easy to use. The basic settings of the moving average have been saved and a percentage parameter (Channel%) has been added.
Basic parameters:
Channel% - shows how much we want to deviate from the main line.
The indicator is freely available.
FREE

This is a volume indicator with the addition of a threshold level that can be set to a fixed value chosen personally or obtained from the average of the volume values themselves. The type of averaging method can be selected in the input parameters.
The input parameters are easy to interpret but let's examine them:
1 - Volume type Here you can select the type of volume you want to see represented and there are 2 choices, either TICK volume or REAL volume. Keep in mind that for forex, for examp
FREE

STRUCTURAL TREND LINES - MT4/MT5 Indicator
Simple indicator that automatically draws trend lines based on market structure.
Features:
- 3 degrees of structure detection (short, medium, long term)
- Configurable swing strength for each degree
- Single color per degree for clean visualization
- Adjustable number of lines per degree
- Customizable colors and line widths
How it works:
The indicator identifies swing highs and lows based on the strength parameter,
then connects these points to crea
FREE

MP Price Change Indicator is a tool to calculate the price movement by percentage. The Value of this indicator can be adjusted to look back of the percent of price change within certain timeframes. This is a powerful tool when used by other indicators as well, such as ATR and ADR, for understanding price fluctuations and tolerance in different strategies. ___________________________________________________________________________________ Disclaimer:
Do NOT trade or invest based upon the analysi
FREE
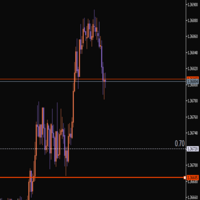
This indicator helps you set and adjust your stop-loss levels. Just move the line to where you usually place your stop, and a second line will automatically appear at a specified distance between the current price and your chosen level. Review your trades on historical data Measure the maximum drawdown from entry to exit Get data that allows you to optimize your stop-loss placement It’s a convenient way to train yourself to use more optimal stops, based on your own trading statistics.
FREE

The Mono Waves indicator is designed to display the wave behavior of the market on a chart. Its appearance is presented on slide 1. This indicator uses the PPPC (Point-Percent Price Channel) indicator, which can be downloaded for free from the Market . When the market moves up, the upper border of the price channel is built on High candlestick prices (for more details, see the description of the PPPC indicator at the link given above). The higher the High prices rise
FREE

Displays previous months Highs & Lows. You can set the number of months to display levels for, also the line style, color and width. This is very useful for traders using the BTMM and other methods like ICT. I'll be creating more indicators for MT5 for the BTMM. Send me your suggestions to my Telegram: https://t.me/JDelgadoCR Take a look at my other products at: https://www.mql5.com/en/users/jdelgadocr/seller
FREE

Moving Spread – Real-Time Market Cost Monitor Monitor the average spread in real time and avoid trading during high-cost periods. What does this indicator do? The Moving Spread measures the average spread (in points) of the market in real time, showing how it varies over time. It's an essential tool for traders who want to understand when the entry cost is too high, which can erode profits even before a trade begins. Why does it matter?
A high spread means you're paying more to enter and
FREE

Identify key support/resistance levels and potential breakouts with the HighestOpenIndicator! Based on daily, weekly, and monthly high/low/open prices, it provides clear signals for informed trading decisions. Featuring the iconic "HO" from the logo, this MT5 version is ported from the original MT4 indicator by TooSlow on ForexFactory, with contributions from Dave (4xtrader2009). Disclaimer: This indicator is provided for educational purposes only. The author is not responsible for any losses in
FREE

MACD ******************** MACD для платформы секундных графиков Micro . ********************* Секундный график на порядок увеличит точность ваших входов и выходов. Секундный период , в привычном формате, позволит увидеть то, что ранее было скрыто. Бесплатные индикаторы, дополнят визуальную картину, что, в совокупности выведет вашу торговлю на новый уровень. Идеально подходит как скальперам, так и трейдерам торгующим внутри дня. Индикатор MACD для платформы Micro. Входные параметры:
FREE

This indicator solves the problem of chart scaling where the bar becomes too thin and it becomes difficult to determine the bar's open and close prices.
Thick Bar indicator - allows you to change the thickness of the lines and the color of the stroke, due to which you can get a thicker bar on the chart. The default indicator has a bar thickness of 2 and preset colors that can be changed in the settings
FREE

This indicator closes the positions when Profit. This way you can achieve a goal without determine Take Profit.
Parameters: Profit: the amount of Dolllars you want to close when profit.
Just determine Profit section and open new positions. If Any of your positions reaches above Profit , Indicator will close automatically and you will recieve your Profit.
FREE
SyncCrosshair – Synchronized & Snapped Crosshair Indicator
Overview: SyncCrosshair is a lightweight MQL5 indicator that replicates TradingView’s crosshair experience across multiple MT5 charts. Move your mouse or click on any synced chart, and watch the vertical + horizontal lines snap precisely to each candle’s opening time at the chart’s timeframe (5 min, 15 min, H1, H4, etc.).
Key Features:
• Multi-Chart Sync: Automatically mirrors crosshair position across all charts that have Sync
FREE

Multi Signal Radar 2.0 (MT4 / MT5)
Clean, Confidence-Based BUY & SELL Signals Multi Signal Radar 2.0 is a clean and intelligent trading signal indicator designed to highlight high-probability BUY and SELL opportunities without cluttering your chart. All calculations are performed internally, while the chart remains minimal — only arrows, a real-time confidence dashboard, and a candle countdown timer are displayed .
This makes Multi Signal Radar ideal for traders who value clarity, timing pre

SuperTrend Indicator for MetaTrader 5
Ride Trends Like a Pro — Never Miss a Move Again Description:
The SuperTrend Indicator is your ultimate companion for mastering trend-following strategies. Designed to cut through market noise, this powerful tool combines the precision of Average True Range (ATR) with adaptive trailing stops to pinpoint trend reversals, confirm breakouts, and keep you on the right side of the market. Whether you’re trading forex, stocks, crypto, or commodities, the SuperTr
FREE

Easily draw Entry, Take Profit, and Stop Loss levels on your chart to analyse and follow trading signals. Key Features Easily input Entry, TP1, TP2, TP3 and SL values Optional vertical line to mark the exact time of the signal Custom labels and colours for each line Visually assess the accuracy and risk/reward of any signal Works with all symbols and all timeframes No repainting, no lag, just clear and stable lines Use Cases Visualise signals from Telegram, WhatsApp, or other channels A
FREE
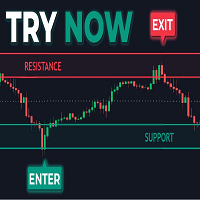
The Predictive Ranges indicator aims to efficiently predict future trading ranges in real-time, providing multiple effective support & resistance levels as well as indications of the current trend direction.
Predictive Ranges was a premium feature originally released by LuxAlgo in 2020.
The feature was discontinued & made legacy, however, due to its popularity and reproduction attempts, we deemed it necessary to release it open source to the community.
USAGE Figure 1 The primary purpo

Highly configurable MFI indicator. Features: Highly customizable alert functions (at levels, crosses, direction changes via email, push, sound, popup) Multi timeframe ability Color customization (at levels, crosses, direction changes) Linear interpolation and histogram mode options Works on strategy tester in multi timeframe mode (at weekend without ticks also) Adjustable Levels Parameters:
MFI Timeframe: You can set the current or a higher timeframes for MFI. MFI Bar Shift: you can set the
FREE

Switch symbols and timeframe by arrow buttons 1. You can switch multiple symbols of one or all charts. 2. You can set list of symbols to switch between them or get them from Market Watch. 3. You can change timeframe of one or all charts. List of timeframes here [M1, M5, M15, M30, H1, H4, D1, W1, MN1]. Switch symbol of all charts: indicator check current symbol of the chart to get index of it in list and change for next or previous. Key functions: - Right arrow key: switch to next symbol. - Left
FREE
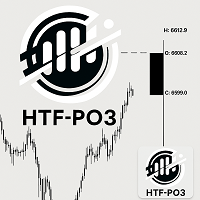
HTF Power of Three (ICT) - MT5 Indicator Overview The HTF Power of Three indicator is a professional implementation of the Inner Circle Trader's (ICT) Power of Three concept, inspired by Larry Williams. This indicator visualizes higher timeframe (HTF) candle development in real-time on any lower timeframe chart, making it an essential tool for ICT traders who study institutional price movement patterns. What is Power of Three (PO3)? Power of Three represents a three-staged Smart Money campaign

RSI Scanner, Multiple Symbols and Timeframes, Graphical User Interface An indicator that scans multiple symbols added from the market watch and timeframes and displays result in a graphical panel. Features: Multi symbol Multi timeframe Alerts and Notifications Live Monitoring Sorting modes One click to change symbol and timeframe Inputs for RSI and scanner settings
FREE

The TickVolume is an advanced Order Flow & Volume Analysis tool for MetaTrader 5, designed to track real-time tick dominance between buyers and sellers. It translates raw tick volume into an intuitive and actionable visualization, highlighting strength, weakness, velocity, and absorption zones through multiple dynamic histogram layers. Exclusive Features and Advanced Technology Multi-Layer Dominance Tracking: Strength & Weakness: Variable thickness histogram ( Thick bars for Strong dominance

The Luta Volatility Meter is an essential technical indicator for traders in MetaTrader 5 (MT5). It was developed by Eng. Lutandula to clearly measure and visualize market movement, helping you easily identify high and low volatility periods. By calculating the average daily trading range, this tool offers a simple yet powerful way to gauge market activity and potential movement for better trade timing Key Advantages Optimal Trade Timing: Helps you identify whether the market is slow (low vol
FREE

The ATR Finder indicator for MT5 is a powerful tool designed to help traders analyze market volatility using the Average True Range (ATR) . This indicator calculates and displays ATR values dynamically, allowing traders to identify periods of high and low volatility, optimize stop-loss and take-profit levels, and refine their trading strategies.
Key Features: • Real-time ATR Calculation – Continuously updates ATR values to reflect current market conditions. • Customizable Settings – Adjust
FREE

MultiTimeFrame Double Screener MT5 — HiddenEdge MultiTimeFrame Double Screener MT5 is a professional dashboard that monitors multi-timeframe trend bias across multiple symbols from a single chart.
It uses dual confirmation to reduce noise and keep readings consistent across all windows. Functional Overview Computes bias per symbol using closed candles and a time anchor (H1 by default) to avoid historical repaint. Applies dual confirmation: bias reading + optional N-bar validation on the anchor
FREE

Eexibe níveis de preço de referência diretamente na janela do gráfico. A sua função principal é projetar automaticamente pontos de preço importantes baseados em dados diários.
O indicador plota linhas horizontais que correspondem aos preços de abertura, máxima, mínima e fechamento do dia de negociação anterior (D-1).
Adicionalmente, exibe os níveis de abertura, máxima e mínima para o dia de negociação atual.
Os níveis de máxima e mínima do dia atual são atualizados dinamicamente durante o anda
FREE

Risk5Percent is a custom indicator for MetaTrader 5 designed to help you manage your risk exposure precisely. By entering the desired risk percentage and the number of lots used, it calculates and displays the corresponding price level on the chart that represents your maximum anticipated loss (e.g., 5%), automatically considering contract and tick size for the selected instrument. Key Features:
Custom settings for trade direction (long/short), risk percentage, and lot size.
Automatic adjus
FREE

FTU Vertical lines
This indicator draws vertical lines at times of your choosing, minute or hour to show past and future time on chart
Features: Multiple adjustable times Change color and amount of lines
Usage : Purpose is to study or measure price at close of specific bars, to plan for future news or hour close etc Change color and amount of bars from range. Use on any timeframe, product/pair, non repaint, fast loading
FREE

A custom indicator that displays a real-time countdown showing how much time remains before the current candle closes and the next one opens. Equipped with a 10-second audio countdown , providing a visual–auditory reminder so traders don’t miss critical moments before a candle closes and can execute decisions with precision. Highly useful for traders who rely on precise timing whether for entries, exits, or analyzing momentum that forms exactly at candle open and close.
FREE
Description: The MACD Combined is an advanced indicator that integrates two visualization modes to provide clearer, more adaptable analysis of Moving Average Convergence/Divergence. Key Features: Two operating modes : Mode 1 : Histogram colored according to the MACD sign (positive or negative). Signal line colored according to the relationship between MACD and the signal line. Mode 2 : Histogram colored based on the comparison between MACD and the signal line. Signal line colored according to
FREE
Session Volatility Map is an indicator that displays key trading sessions (Asia, Europe, US) directly on the chart. Automatically shows session boundaries and overlapping zones where volatility often spikes.
Plots the High–Low range of each session to help identify support and resistance.
Highlights the currently active trading session.
Adjusts automatically for Daylight Saving Time (Europe/US). Who will benefit:
Scalpers — to catch high-volatility market phases.
Intraday trader
FREE

Recomended broker: https://tinyurl.com/5ftaha7c Indicator used to monitor price fluctuations in the market and discover possible reversals through reversal points or divergences in the indicator. All assets and all timeframes. SEE OUR RESULTS ON INSTAGRAM: https://www.instagram.com/diogo.cansi/ TELEGRAM GROUP = https://t.me/robosdsc More information by email dscinvestimentos@gmail.com or by Whatsapp 55-991372299
FREE

HumaI Power Zones – Precise OHLC Mapping for Serious Traders Product Description
HumaI Power Zones is a precision-designed indicator that automatically plots key OHLC (Open, High, Low, Close) levels from the Daily (D1) , Weekly (W1) , Monthly (MN1) , and Yearly (Y1) timeframes. These levels are calculated and drawn in real time, offering a stable and clear view of price structure. Whether you're working with lower timeframes or tracking higher timeframe context, HumaI Power Zones provides a

Highly configurable Relative Vigor Index (RVI) indicator.
Features: Highly customizable alert functions (at levels, crosses, direction changes via email, push, sound, popup) Multi timeframe ability ( higher and lower timeframes also) Color customization (at levels, crosses, direction changes) Linear interpolation and histogram mode options Works on strategy tester in multi timeframe mode (at weekend without ticks also) Adjustable Levels Parameters:
RVI Timeframe: You can set the lower/higher t
FREE

Highly configurable Force Index indicator. Features: Highly customizable alert functions (at levels, crosses, direction changes via email, push, sound, popup) Multi timeframe ability Color customization (at levels, crosses, direction changes) Linear interpolation and histogram mode options Works on strategy tester in multi timeframe mode (at weekend without ticks also) Adjustable Levels Parameters:
Force Index Timeframe: You can set the current or a higher timeframes for Force Index. Force Ind
FREE
The Percentage Average True Range (ATR) indicator measures market volatility by calculating the ATR of a selected asset and expressing it in one of three customizable formats: Percentage (%) relative to the current price, enabling easy comparison across assets with different price ranges. Basis Points (bps), where 1 bps equals 0.01%. Real ATR values, representing the raw ATR in price terms. By normalizing ATR values using percentage or basis points, this indicator allows for direct comparison of
FREE

Transform your way of analyzing the market with our innovative trend and support/resistance indicator!
By combining the robustness of pivot points, the sensitivity of price adjustment, and the reliability of moving averages, our indicator provides a comprehensive and intuitive view of price behavior. Whether to detect emerging trends, track significant price shifts, or map critical support and resistance zones, this tool is your reliable guide amidst market volatility (BMF WIN).
T ested for B
FREE

TickChart Indicator plots tick line on the main window of MetaTrader.
In the Lite version, the number of ticks is limited to 20 and the alert function described below is omitted. The tick-line shows the most detailed, fastest and real-time activities of the market, which are usually hidden in bars or candles longer than 1 minute. Usually, several new tick-line segments appear while a bar of M1 time frame is completed. After the release of an important economic indicator, the number of ticks per
FREE
Do you know why the MetaTrader Market is the best place to sell trading strategies and technical indicators? No need for advertising or software protection, no payment troubles. Everything is provided in the MetaTrader Market.
You are missing trading opportunities:
- Free trading apps
- Over 8,000 signals for copying
- Economic news for exploring financial markets
Registration
Log in
If you do not have an account, please register
Allow the use of cookies to log in to the MQL5.com website.
Please enable the necessary setting in your browser, otherwise you will not be able to log in.