Watch the Market tutorial videos on YouTube
How to buy а trading robot or an indicator
Run your EA on
virtual hosting
virtual hosting
Test аn indicator/trading robot before buying
Want to earn in the Market?
How to present a product for a sell-through
Technical Indicators for MetaTrader 5 - 123
Welcome to the Pair Spread Oscillator by Xignal Coding!
Ever wondered if you could monitor one asset against another—typically correlated—and spot opportunities? That’s exactly what you can do with the Pair Spread Oscillator! The Pair Spread Oscillator calculates the distance between your selected instruments and provides the mean distance and the standard deviation of your choice. This way, you can easily identify when these two instruments are moving in different directions and act before the

BluePrint Adaptive Trader - Professional Trading System Advanced Channel Trading System based on our proprietary TrenderFlex PRO algorithm Learn more about TrenderFlex PRO KEY FEATURES • TrenderFlex PRO Channel Technology - Advanced channel calculation based on our proven algorithm
• Adaptive Risk Management - Automatic TP/SL calculation based on channel width
• Win Rate Statistics - Real-time tracking of TP1, TP2, TP3 success rates
• Multi-Timeframe Analysis - Monitor 7 timeframes simultaneou
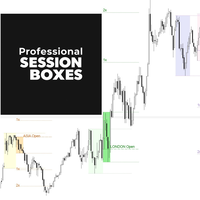
Professional Session Boxes – Multi-Market Trading Sessions Indicator Transform your trading charts from confusing price action to clear, actionable market sessions. Join hundreds of successful traders already using Professional Session Boxes , the ultimate MT5 session indicator , to time their entries perfectly. Transform Your Trading with Color-Coded Market Sessions Never miss a trading opportunity again! This professional-grade Forex volatility tool automatically highlights the most important
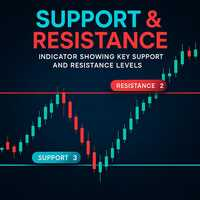
Discover the Strongest Support and Resistance Areas. This indicator is an advanced tool for identifying and plotting support and resistance levels on a chart. Instead of using a simple method, it follows a dynamic approach to identifying the most important levels. Its goal: to find important highs and lows that represent potential price reversal points.
The indicator analyzes three different time frames that you specify in the inputs: TF1, TF2, and TF3. Support and Resistance is the profession
Chart Scalper v1.01 Professional Trading Indicator for MetaTrader 5 OVERVIEW Chart Scalper is an advanced technical indicator designed to accurately identify optimal market entry and exit points. Using a sophisticated price reversal analysis algorithm, the indicator automatically detects significant trend changes and generates clear visual signals for buy and sell trades.
KEY FEATURES Accurate Trading Signals
Automatically detects trend reversals based on configurable parameters Generates
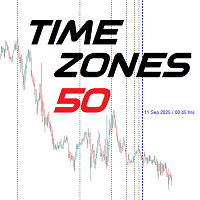
Time Zones 50 - time and price united!
The indicator solves one essential problem:
How should we count time? Which zones should we use, how, and why?
It is entirely based on logic. ( This is a manual indicator and contains features that are not supported by the MetaTrader testing environment )
Applying Time Zones To apply time zones, we need a starting moment. This starting point must be logically defined, not chosen at random.
Some people start from: the first day of the year, the first day of

Inverse Fair Value Gaps (FVG) Indicator Overview The Inverse Fair Value Gaps (FVG) indicator is an advanced technical analysis tool that identifies and tracks Fair Value Gaps and their subsequent inversions on your trading charts. This powerful indicator helps traders spot potential reversal opportunities by monitoring when price action invalidates existing Fair Value Gaps and creates inverse trading signals. What are Fair Value Gaps? Fair Value Gaps (FVGs) are price inefficiencies that occur wh

Category: Trend Indicator
Platform: MetaTrader 5
Type: Level Indicator
Timeframes: All
Trader Styles: Scalping, Day Trading, Swing Trading
Markets: All Description The Madrid Ribbon is a moving average–based trend visualization tool. It combines multiple exponential or simple moving averages into a ribbon structure that adapts to market changes. The indicator highlights trend direction, possible reentry zones, and areas where reversals may occur. Main features: Dynamic Trend Display – Multiple m
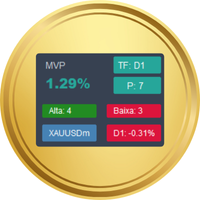
Market Variation Pro (MVP) is a unique indicator in the market, easy to use and configure, and works on any time frame and any asset .
It calculates the average percentage variation of any asset over a defined period. Unlike indicators that only analyze the closing price, MVP considers the entire price range, providing a more comprehensive view of market behavior. Main functionalities Volatility measurement Quantifies average volatility in percentage terms Compares volatility across different a
RENKO SCALPER - PROFESSIONAL TRADING INDICATOR OVERVIEW RENKO SCALPER is an advanced technical indicator designed specifically for professional traders looking to maximize accuracy in their scalping and intraday trading. Based on the adaptive Renko brick methodology, this indicator combines dynamic volatility algorithms with automatic buy/sell signals to provide a superior trading experience.
MAIN TECHNICAL FEATURES Adaptive Renko Analysis Dynamic brick calculation based on ATR (Average
Dual-Period Williams %R Oscillator for MT5 A sophisticated trend exhaustion detector that combines two Williams %R oscillators to identify high-probability reversal opportunities through confluence analysis. ======================================================================================== Key Features Intelligent Dual-Signal System Fast and Slow Williams %R periods working in confluence Real-time trend exhaustion detection with reliable signals Optimized calculations for smooth MT5 perfor

Projection of Phi Is a technical indicator that calculates dynamic support and resistance levels. It uses angular geometric projections and mathematical ratios to identify market expansion ranges. Features: Dynamic Fibonacci Expansion: Extension level projection Geometric Calculation: Angular analysis and mathematical ratios Visualization: Graphical objects with informative labels Compatibility: M1 to H4 timeframes Applications: Identification of zones for trade management Analysis of volatil
Category: Trend Indicator
Platform: MetaTrader 5
Type: Entry Indicator
Timeframes: All
Trader Styles: Scalping, Day Trading, Swing Trading, Binary Options
Markets: All Description This indicator is an enhanced version of the Relative Strength Index (RSI) with additional features for visual clarity and cycle detection. It is designed to provide traders with a clearer view of momentum conditions and potential turning points. Main features: Improved RSI Visualization – The indicator displays RSI va

The Sormed indicator utilizes advanced algorithms to deeply analyze market fractal structures and price volatility, accurately drawing strong bullish and bearish trend lines while effectively avoiding misleading entry signals. Sormed: Your ultimate all-in-one trading edge. With our dynamic insights into complex fractals, key support and resistance levels, and market volatility, Sormed precisely identifies optimal buy (blue) and sell (red) periods. It greatly simplifies the trend trading decision
Fibo Scalper is a specialized indicator for traders who use Fibonacci retracements in short-term trading. It automates level drawing and generates rebound signals, saving time and reducing human error. Its customization and adaptability to different sessions make it a valuable tool for scalpers and day traders.
Fibo Scalper is a technical analysis tool designed for short-term trading (scalping). Its main function is to automatically draw Fibonacci retracement levels based on the price range of
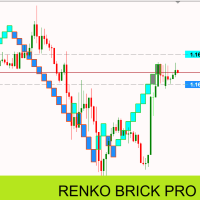
Renko Brick Pro - Advanced Renko Indicator for MT5 Professional Renko bricks with intelligent ATR sizing and ready-to-use EA integration buffers. Renko charts eliminate market noise by creating bricks only when price moves a specific amount. Unlike traditional price charts, each brick represents the same price movement, giving you cleaner trend identification and better entry points. This indicator brings true Renko analysis to MT5 with intelligent ATR-based brick calculations that automatically

GorMaster_Pro — Sesgo confiable, noticias y técnica en una sola pantalla Visión GorMaster_Pro es una herramienta indispensable para cualquier tipo de trader (scalper, intradía o swing) porque combina información fundamental y técnica para darte una lectura fiel y accionable del mercado.
En una sola vista verás: sesgo direccional BUY/SELL/RANGO , ventanas de noticias en tiempo real que congelan la operativa, métricas técnicas clave (ATR_Z, RangeRatio, ADX, SpreadZ), sesiones y alertas . Todo org

FVG - Fair Value Gap The FVG - Fair Value Gap is an advanced MQL5 indicator designed for traders who utilize institutional order flow and Smart Money Concepts to identify market inefficiencies. This indicator automatically detects and highlights Fair Value Gaps (FVGs) on your chart, providing a clear visual representation of potential support and resistance zones, reversal points, and high-probability trading setups. Key Features: Automated FVG Detection: The indicator automatically identifie
TREND LINES Scalper Professional Indicator OVERVIEW Trend Lines Scalper is a highly accurate, advanced indicator designed specifically for professional traders looking to maximize their scalping opportunities by automatically detecting trend lines and high-probability signals.
This powerful algorithm combines classic technical analysis with modern technology, automatically identifying price patterns and generating accurate, real-time signals for successful scalping trades.
MAIN FEATURES
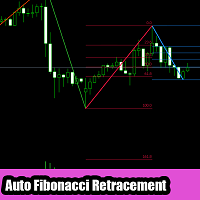
What This Indicator Does : This indicator automatically draws Fibonacci retracement levels based on Z igZag pattern detection. It identifies significant price swings and applies Fibonacci retracement levels without manual drawing. Key Features : Automatic ZigZag Detection - Uses customizable depth, deviation, and backstep parameters to identify price swings Dynamic Fibonacci Levels - Real-time Fibonacci retracement base d on the most recent ZigZag swing (updates as price move

THUNDER WAVE ANALYZER – Professional Multi-Trend Analysis System Il Thunder Wave Analyzer è un indicatore avanzato multi-strumento che combina in un’unica interfaccia la potenza di diversi sistemi di analisi tecnica.
Pensato per trader professionisti e scalper, questo tool permette di leggere la forza del trend , rilevare setup ad alta probabilità e individuare con precisione i momenti di pressione del mercato. Cosa rende unico il Thunder Wave Analyzer? In un solo indicatore integra più metod

ForceFlow – Momentum & Trend Predictor ForceFlow è un indicatore avanzato che combina la forza del Relative Strength Index (RSI) con un innovativo istogramma dinamico multi-livello , colorato in base alla direzione del trend.
I colori si adattano in tempo reale, anticipando la formazione della prossima candela e filtrando i falsi segnali. Caratteristiche principali: RSI dinamico a colori (blu per fase rialzista, rosso per fase ribassista). Istogramma multilivello che rappresenta la forza e la

English – Canal H Pro Name: Canal H Pro – Support, Resistance & Breakout Short Description:
Premium indicator with three dynamic lines (high, low, median) . Perfect for Breakout, Range, and trend following. Full Description: Red (High) → dynamic resistance Blue (Low) → dynamic support Yellow (Median) → balance and trend filter Automatic BUY/SELL signals on chart Adjustable period and colors Works on all strategies and timeframes Canal H Pro – spot key zones and take positions fast.
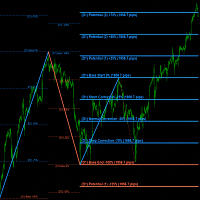
"Impulses and Corrections 5" is created to help traders navigate the market situation. The indicator shows multi-time frame upward and downward "Impulses" of price movements. These impulses are the basis for determining the "Base" , which is composed of zones of corrections of price movements, as well as "Potential" zones for possible scenarios of price movement.
Up and down impulses are determined based on a modified formula of Bill Williams' "Fractals" indicator. The last impulse is always "U

Nuage Trend Pro – Trend Tracking & Kijun Signals Nuage Trend Pro is an advanced indicator for MetaTrader 5 , designed to quickly identify strong market trends and pinpoint optimal entry points through Kijun crossovers. Transform your charts into clear visual maps to trade with accuracy and confidence . Key Features Automatic Kijun Cross Detection : Instantly highlights key moments when price crosses the base line. Dynamic Trend Cloud : Your chart comes alive with intuitive colors – green f

Description – Weekly Levels Pro Weekly Levels Pro – Key Weekly Levels is a simple yet powerful indicator for MetaTrader 5, designed to automatically display the four most important trading levels of each week: Weekly High → natural resistance level Weekly Low → natural support level Weekly Open → trend reference point Weekly Close → bullish or bearish strength indicator Key Features: Automatically updates at the start of each new week
Clear and easy-to-read display directly on the char

GoldRushTrader EA – Trade Smart Money Concepts Automatically on MT5
GoldRushTrader EA is a fully automated trading system built on Smart Money Concepts (SMC) .
It combines institutional trading logic with advanced market scanning to generate and manage trades automatically. Key Features: SMC Trading Engine – Detects liquidity grabs, order blocks, and structure breaks. Automated Execution – Places and manages trades directly without manual input. Multi-Symbol Capability – Monitor and trade up t
Strivex Supply/Demand Indicator for MetaTrader 5 The Strivex Supply/Demand Indicator automatically detects key supply and demand zones, marks market structure breaks (BOS), and alerts the trader in real time.
A special feature: The zones remain visible even if you change the chart timeframe. For example, you can display H1 zones on an M15 chart without them being redrawn or lost.
Key Features Automatic zone detection based on swing highs and lows Clear chart display – only the most recent
Vice SwingTrading – Advanced Multi-Timeframe Swing Trading Indicator Vice SwingTrading is built for serious swing traders who rely on multi-timeframe confirmation to capture market swings efficiently. The indicator combines trend identification on the Daily (D1) with entry precision on the Hourly (H1) , giving you a structured edge in volatile markets. Core Trading Logic Trend Detection (D1) → Identifies the dominant market direction to ensure trades align with the bigger picture. Entry Trigg

Fibonacci Auto Levels — Smart, Automatic Fibonacci Mapping
Introduction Fibonacci Auto Levels is an indicator that automatically detects key price zones and draws precise Fibonacci levels. It helps traders focus on strategy by removing the need for manual setup.
Key Features - Automatic peak and trough detection based on customizable candle lookback - Classic and extended Fibonacci levels from 0.0% to 161.8%, drawn with geometric precision - Customizable visual design with adjustable colors,
ATTENTION!!!Get this product at a discounted price NOW!!! Description of the Directional Strength Index mt5 I present to you this awesome indicator that concludes the trading armor of a trader seeking for a strong affirmative and insightful entries and exits confluences.The core idea that runs behind the indicator is generated from the famous children game " TUG OF WAR ".The market is depicted as being influenced by two forces : buying and selling force. The indicator's work is to determine wh

Horizontal Grid Indicator This is a simple utility indicator for MetaTrader 5 that draws a customizable horizontal grid directly on your chart. Its primary goal is to help traders visualize price levels, support/resistance zones, and potential profit targets at fixed pip intervals. Key Features Customizable Spacing: You can set the distance between the lines in pips (e.g., every 50 pips or X pips). Dynamic and Adaptive: The grid automatically adjusts to what you see on the screen, drawing lines
The Stochastic ZigZag is a powerful and intuitive indicator designed to identify significant market swing points with a high degree of reliability. By integrating the Stochastic Oscillator, this indicator plots swing highs and lows only after they are validated by a clear shift in market momentum by using Stochastic overbought and oversold zone. Features: Stochastic Confirmation: Uses momentum to filter out insignificant price movements. Simple Chart Visualization: Draws clear trend lines connec

Wave Volume Indicator for MetaTrader 5 The Wave Volume indicator is a powerful tool that combines volume analysis with price action using a ZigZag approach. It helps traders identify significant market moves by displaying accumulated volume in wave formations, making it easier to spot potential trend reversals and momentum shifts. Volume Wave Visualization : Displays volume accumulation in wave patterns Flexible Volume Types : Choose between tick volume or real volume Customizable ZigZag Period

Wave Price Indicator The Wave Price indicator is an advanced technical analysis tool that visualizes price movements in wave formations using a ZigZag approach. It helps traders identify significant price patterns, trends, and potential reversals by breaking down price action into meaningful waves. Price Wave Analysis : Visualizes price movements in clear wave patterns ZigZag-based Calculation : Filters out market noise and focuses on significant price moves Color-Coded Waves : Aqua: Bullish wa

Daily PnL Guard (MT5) — Profit Smasher Stop blowing your day. Start trading with discipline.
Daily PnL Guard is a clean on-chart HUD that gives you instant clarity on your trading session. It answers the only question that matters: Can I keep trading right now? This tool isn’t about signals. It’s about discipline . By tracking your current profit/loss against your starting balance and comparing it to your Daily Max Loss and Profit Target , Daily PnL Guard keeps you in check before the market do

Meta Cipher B: The All-in-One Oscillator Suite for MT5 Meta Cipher B brings the popular Market Cipher B concept to MetaTrader 5, optimised for speed and precision. Built from the ground up for performance, it delivers professional-grade signals without lag or sluggish scrolling. Although powerful on its own, Meta Cipher B is also designed to pair naturally with Meta Cipher A for complete market context and deeper confirmation.
What it does A unified oscillator stack that visualises wave momentu
Wave Tracker
The Wave Tracker is an innovative price action tool that plots wave patterns directly on your chart, helping traders identify significant market movements and potential turning points. By using a sophisticated ZigZag algorithm, it creates a visual representation of price waves, making it easier to spot trends, reversals, and important price levels. Direct Chart Visualization : Plots waves directly on your price chart for seamless analysis Smart Wave Detection : Advanced ZigZag al
The Absorption & Exhaustion Detector Professional indicator is a sophisticated volume analysis tool designed to identify critical market turning points by analyzing the relationship between price movement and cumulative volume delta (CVD). This indicator helps traders spot when price movements lack volume confirmation, indicating potential absorption or exhaustion zones. KEY FEATURES Real-time Cumulative Volume Delta (CVD) calculation and normalization Price-volume divergence gap measurement dis
The Moving Average Acceleration Indicator is a simple but powerful tool for traders. It shows you more than just the trend; it reveals the strength and momentum behind it . Why it's Useful See the Trend's Energy: Unlike a regular moving average that just shows direction, this indicator measures how fast the trend is accelerating or decelerating. This helps you spot a trend that's picking up speed or one that's about to slow down. Early Warnings: A trend that's losing momentum often signals a pot
Advanced SRP (Strong Retracement/Reversal Points) Tired of support and resistance indicators that constantly repaint, clutter your charts with irrelevant lines, and fail across different timeframes? It's time to stop guessing and start trading with institutional-grade clarity. Advanced SRP is not just another S/R tool; it's a definitive market structure indicator designed for the serious trader. It identifies and displays the most critical price levels where the market is statistically likely

PriceZoneAlert V3 - Product Description
Main Description
PriceZoneAlert V3 is the most advanced trading tool for monitoring critical price levels with smart, customized alerts, delivered directly to your phone or tablet. This revolutionary version for MetaTrader 5 allows you to configure alerts on both support/resistance levels and price zones, with instant push notifications to stay informed in real time, wherever you are.
Whether you're trading according to SMC concepts, support/r

SRA (Support & Resistance Adaptive) Trade with Conviction, Not Guesswork Support & Resistance Adaptive is a professional-grade analytical engine for MetaTrader 5, designed to cut through market noise and automatically pinpoint the most statistically robust support and resistance levels. Move Beyond Basic Indicators: Forget outdated, single-method tools that litter your chart with irrelevant lines. Our indicator employs an advanced multi-source confluence engine , synthesizing data from four dis

Clean Scalper uses a non-repaint non recalculate ZigZag-based approach to map significant highs and lows in price, producing continuous lines that emphasize price swings while filtering out minor fluctuations. Traders can adjust the sensitivity by modifying the ATR period and multiplier, tailoring the indicator to different timeframes and market conditions. Trade breakouts of points or trend following scalps

Rule-compliant Description Category: Trend Indicator
Platform: MetaTrader 5
Type: Level Indicator
Timeframes: All
Trader Styles: Scalping, Day Trading, Swing Trading
Markets: All Description The Slope MA With Tester is a technical indicator that evaluates the slope of a moving average relative to volatility (ATR). It highlights directional bias through a color-coded slope line and plots entry arrows when slope conditions change. Main features: Slope-based Calculation – The slope of an EMA is nor
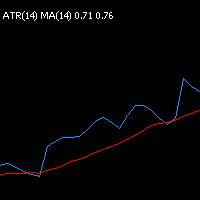
This indicator combines the Average True Range (ATR) with a moving average to provide a smoothed view of market volatility. The ATR measures the average range of price movement over a defined period, while the moving average filters out short-term noise, helping traders better identify sustained volatility trends.
It’s particularly useful for setting dynamic stop-loss levels, assessing risk, and timing entries or exits based on evolving market conditions.
Temporal Predictive Encoding Indicator Discover the Future of Trading with Temporal Predictive Encoding (TPE) Unlock unprecedented trading accuracy with Temporal Predictive Encoding (TPE) , the revolutionary MetaTrader 5 indicator designed to predict market movements by analyzing temporal patterns and anomalies in price data. Built on advanced algorithms inspired by quantum mechanics and spectral analysis, TPE detects hidden predictive biases in real-time, empowering traders to stay ahead of ma

Session Map Pro with Pip Tracker. Y our analytical toolkit automatically plots the critical price levels from previous trading days and overlays visual session markers, giving you an instant "roadmap" of potential support and resistance.
This indicator transforms your chart into a strategic trading battlefield. Detailed Line Reference Guide (For visual display m1-m5 works best but can be attached to any time frame) Default lookbackDays=5. "Set to 1 for today only and a less cluttered d

Market Structure Break & Order Block (MSB-OB) The Market Structure Break & Order Block (MSB-OB) indicator is built to analyze price structure, highlight market structure breaks, and mark order block zones. It also provides buffers for Buy/Sell signals and MSB detection, making it suitable for both manual analysis and automated strategies. A tester panel is included to evaluate performance under different conditions in the Strategy Tester. Main Concept Market Structure Break (MSB):
Occurs after

Elite Harmony Signals Pro Panoramica Elite Harmony Signals è un indicatore sofisticato di analisi tecnica che visualizza rettangoli dinamici che forniscono zone di trading chiare e segnali di conferma per decisioni migliorate. Caratteristiche Principali Zone Rettangolo Dinamiche Estensione in Tempo Reale : I rettangoli si estendono automaticamente all'azione corrente del prezzo Chiusura Intelligente : I rettangoli si chiudono solo quando appaiono segnali opposti Conferma Visiva : Zone di trading

Trend Signals TP SL UAlgo
This professional trading indicator combines two T3 moving averages with automated take profit and stop loss calculations to provide accurate trend signals and comprehensive risk management on MetaTrader 5.
Main Algorithm
The indicator uses two independently configurable T3 (Triple Exponential Moving Average) calculations with customizable periods and hot values. The T3 algorithm offers superior smoothing compared to traditional moving averages while maintaining res

SWT Manifold Oscillator A Next-Generation Momentum Oscillator Based on Stationary Wavelet Transform and Manifold Theory Unlock a new perspective on market momentum with the SWT Manifold Oscillator . This is not just another oscillator; it is a sophisticated analytical tool designed for the discerning trader who demands a deeper, more nuanced understanding of price dynamics. By leveraging advanced mathematical concepts, this indicator provides a clearer, smoother, and more responsive measure of

The Smart Squeeze Momentum Indicator MT5 is a powerful trading tool that helps traders identify periods of market contraction, expansion, and potential trend reversals . Built on the proven concepts of Bollinger Bands and Keltner Channels , this indicator detects “squeeze” conditions and provides a clear momentum histogram along with buy and sell trading signals . Key Features Momentum Histogram – Visualizes the strength and direction of market momentum.
Squeeze Detection – Identifies low-vol

CM Williams Fix Indicator for MT5 Introduction The CM Williams Fix Indicator for MetaTrader 5 is one of the most popular indicators on the TradingView platform, now available for MT5 users. This tool identifies special market conditions and delivers reliable, high-quality buy signals. Simply attach it to your chart and experience its outstanding performance in your trading.
Type: indicator
Market: all markets
TimeFrames: all timeframes
Trading type: all trading types from scalping to posit

Engulfing Zones MT5: Your Edge in Price Action Trading Description The Engulfing Zones MT5 indicator is a sophisticated, non-repainting tool designed to automatically detect, highlight, and track the most significant Engulfing Candle Patterns (EG) and, crucially, Engulfing Failures (EF) on your chart. Developed by Coders Guru (XPWORX), this indicator goes beyond simple pattern recognition by drawing persistent, dynamic support and resistance zones based on these high-probab

Fox Wave PSAR – PSAR Dashboard for Multiple Symbols and Timeframes Description:
Fox Wave PSAR is a powerful indicator for MetaTrader 5 that allows you to monitor the Parabolic SAR (PSAR) across multiple symbols and timeframes directly in a clear and convenient dashboard. It is ideal for scalping, intraday, and long-term trading strategies. Key Features: Clear dashboard with a list of symbols and their current PSAR status. Supports any number of symbols and customizable suffixes (e.g., ".m"). Di
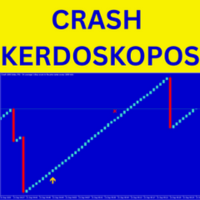
Crash Kerdoskopos Indicator – Buy Without Fear The Crash Kerdoskopos Indicator is the ultimate tool for scalping Crash markets on the M1 timeframe . Designed with precision entry and exit rules, it allows you to buy with confidence and capture 8–10 safe candles without being caught by spikes. With yellow up arrows for entry and a red cross for exit , the indicator removes all guesswork. You’ll also receive audible alerts, push notifications, and email signals so you never miss a profitable op
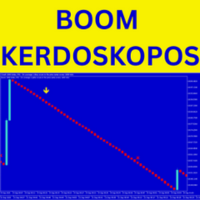
Boom Kerdoskopos Indicator – Sell With Confidence The Boom Kerdoskopos Indicator is a scalper’s dream for Boom markets on M1 timeframe . Built to protect you from spikes, it gives precise yellow down arrows for sell entries and red cross exit signals so you always know when to enter and leave the trade. With smart alerts (audible, push, email), you can trade stress-free and secure 8–10 safe candles every time. It’s perfect for scalpers who want fast, consistent profits. Why Traders Choose

Modern Spike Indicator Features:
1. Support and Resistance Lines: Displays dynamic horizontal dashed lines on the chart representing current support and resistance levels calculated from recent price swings.
2. Spike Detection Arrows: Shows up arrows (green) for potential upward spikes and down arrows (red) for potential downward spikes, triggered when price breaks S/R levels with RSI confirmation.
3. Trend Analysis: Incorporates ADX (Average Directional Index) to determine market trend stre

Pin Bar Pro v1.0 – MQL5 Indicator Description:
Pin Bar Pro is a professional MetaTrader 5 indicator that automatically detects Pin Bars , a key candlestick pattern for anticipating market reversals. Signals are displayed as custom arrows directly on the chart: Blue arrow → Buy signal (bullish Pin Bar) Red arrow → Sell signal (bearish Pin Bar) Features: Automatic detection of Pin Bars Customizable visual arrows ( Arrow_Up_Code , Arrow_Down_Code ) Adjustable vertical offset ( Arrow_Offset_Pts ) W

ArroX Indicator Description
ArroX is a technical analysis indicator designed for MetaTrader 5 platform. This indicator analyzes price movements and market trends to provide trading signals.
Key Features: - Displays buy and sell arrows on the chart - Includes trend filtering capabilities - Provides multiple take profit levels - Shows market analysis information panel - Supports different signal sensitivity modes - Uses Bollinger Bands and moving averages for analysis - Includes stop loss calc

ENGLISH – Monthly Levels Pro v1.0 The Ultimate Monthly Market Levels Indicator Master key market zones at a glance. Monthly Levels Pro helps you analyze long-term trends and spot essential support and resistance levels by automatically displaying the High, Low, Open, and Close of a monthly candle. Why Choose Monthly Levels Pro?
Instant Analysis – See monthly levels immediately without checking candles manually.
Smarter Trading – Spot reversal or breakout zones at a glance.
Clear Visuals –
Introduction The Wave Trend Oscillator Indicator for MT5 is one of the well known indicators in the market, helping traders find strong entry points into the market. Like any other MetaTrader 5 indicator , it can produce both good and bad signals, but the number of accurate buy/sell signals is significantly higher than the weak ones. This makes it a powerful tool for improving your forex trading strategy , whether you are a beginner or an advanced trader. How does this indicator work? This indic

Emperor Signal MT5 - Indicator act and simulate trades like that Expert Advisor! Emperor Signal MT5 is an advanced indicator that simulates signals similar to an Expert Advisor while remaining fully under the trader’s control. It provides clear entry and exit points, complete trade visualization, and an intuitive interface to support safe and systematic trading. Key Features Smart Entry Simulation
Each signal is divided into up to 5 entry levels , creating a basket of trades that enhances safet

Hourly Sweep Matrix – 1m Chart
By Daniel Butogwa (The Alien Trader) The Hourly Sweep Matrix is a precision tool built for traders who want to see market structure with sniper clarity. It automatically marks out hourly price sweep zones on the 1-minute chart, showing you exactly where liquidity was taken each hour and where price reacted. No clutter, no lagging nonsense — just pure price action zones, updated every minute, so you always know which hour’s high/low is being hunted. Key Features:

Trend Reversal Catcher with Alert MT5 Trend Reversal Catcher with Alert MT5 is a non-repainting, non-redrawing, and non-lagging price action indicator designed to identify precise market turning points.
It combines pivot detection , candlestick patterns (pin bars and engulfing setups), and an ATR-based volatility filter to deliver clean and reliable reversal signals. The indicator plots Buy/Sell arrows on the chart and sends real-time alerts , making it suitable for scalping, day trading, an

Balance Levels is an easy-to-use trading indicator that provides clear buy and sell signals along with dynamic price levels, helping traders plan their entries and exits with more confidence. The tool is highly flexible – it can be used as a standalone strategy or integrated into any existing trading system. It works on all timeframes and across all markets: Forex, Gold, Indices, Crypto, or Stocks. Balance Levels suits every trading style – from scalping and intraday, to swing trading and even l

Most SMC trades are painfully stressed because, They miss out on trades because there is a lot to mark and they keep forgetting important markings. They back-test a method correctly because back testing is done in one go, they later fail in forward test because they unconsciously change how levels were marked during testing phase. When they don't find a level, they think they are missing something and then mark a wrong level thinking its the right one. Be focused on trading, not marking, because

Indicator Monthly Levels + Pin Bar Pro Description The Monthly Levels + Pin Bar Pro indicator combines the power of monthly key levels (High, Low, Open, Close) with automatic detection of Price Action reversal patterns (Pin Bars) .
Designed for technical and institutional traders, it helps anticipate market reaction zones and generates clear visual signals directly on the chart. Main Features Automatic monthly levels : High, Low, Open, Close. Pin Bar detection (bullish & bearish) in r

1️⃣ English – Yearly Levels Pro v1.0 Version: 1.0
Developer: KOUAME N'DA LEMISSA
Platform: MetaTrader 5 (MT5)
Type: Technical Indicator / Annual Price Levels Description:
Yearly Levels Pro v1.0, developed by KOUAME N'DA LEMISSA, is a powerful indicator to quickly identify annual key price levels. It automatically calculates the Open, High, Low, and Close prices of a specific year and displays them on the chart with colored horizontal lines. Key Features: High (Red), Low (Blue), Open (Green), Cl
The MetaTrader Market is the best place to sell trading robots and technical indicators.
You only need to develop an application for the MetaTrader platform with an attractive design and a good description. We will explain you how to publish your product on the Market to offer it to millions of MetaTrader users.
You are missing trading opportunities:
- Free trading apps
- Over 8,000 signals for copying
- Economic news for exploring financial markets
Registration
Log in
If you do not have an account, please register
Allow the use of cookies to log in to the MQL5.com website.
Please enable the necessary setting in your browser, otherwise you will not be able to log in.