Smart Volume Profile
- Indicators
-
Mattia Impicciatore
 Hello,
I’m Mattia — a fintech developer, trader, and expert in MQL5, Python, and web technologies. - Version: 1.31
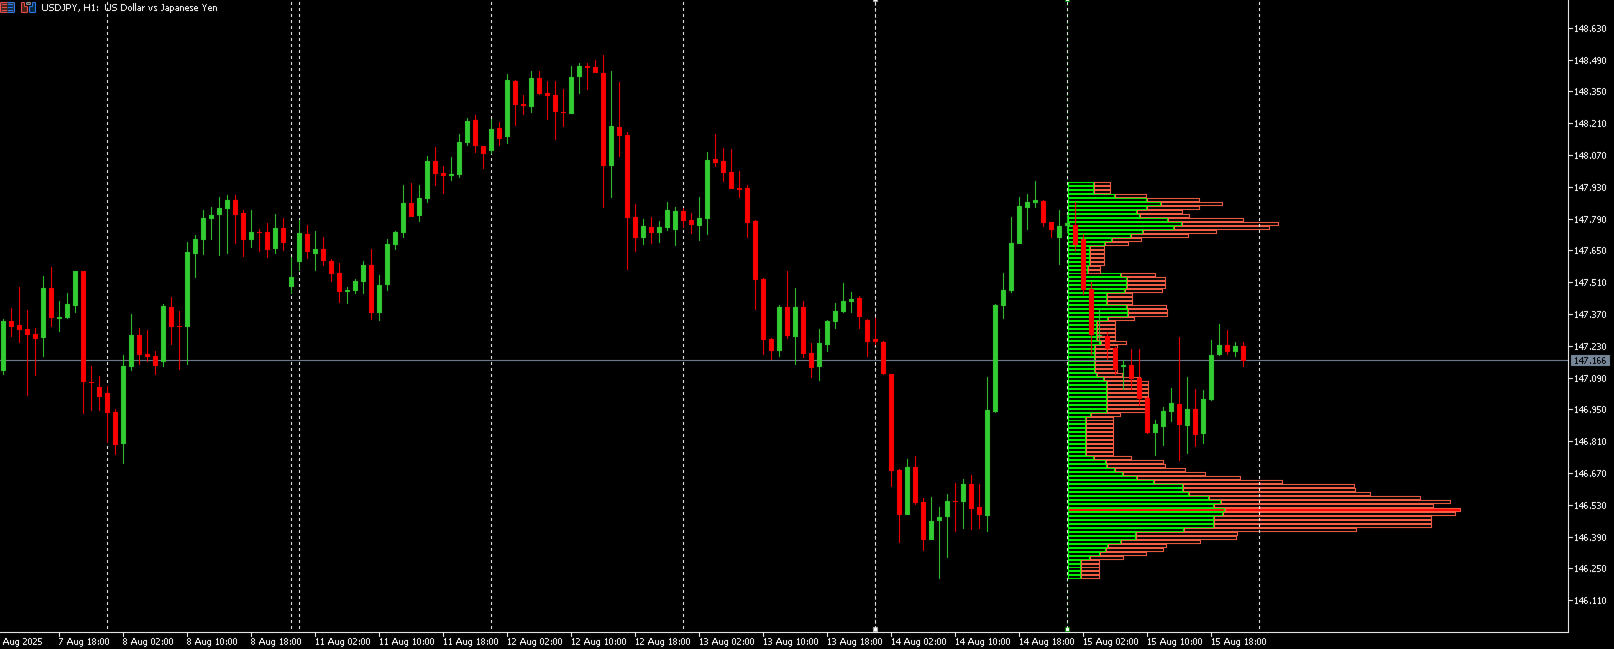
Smart Volume Profile is a professional volume profile indicator that calculates and displays in real time the distribution of volumes between two vertical lines, with buy/sell split and POC, VAH, VAL levels. Designed for both discretionary and systematic trading, it allows you to see where the market traded the most and how buying and selling pressure was distributed within the selected period.
Why this indicator
Full control of the analysis period thanks to two draggable VLINEs that define the range.
Buy/Sell split with dedicated colors to immediately identify which side is driving the flow.
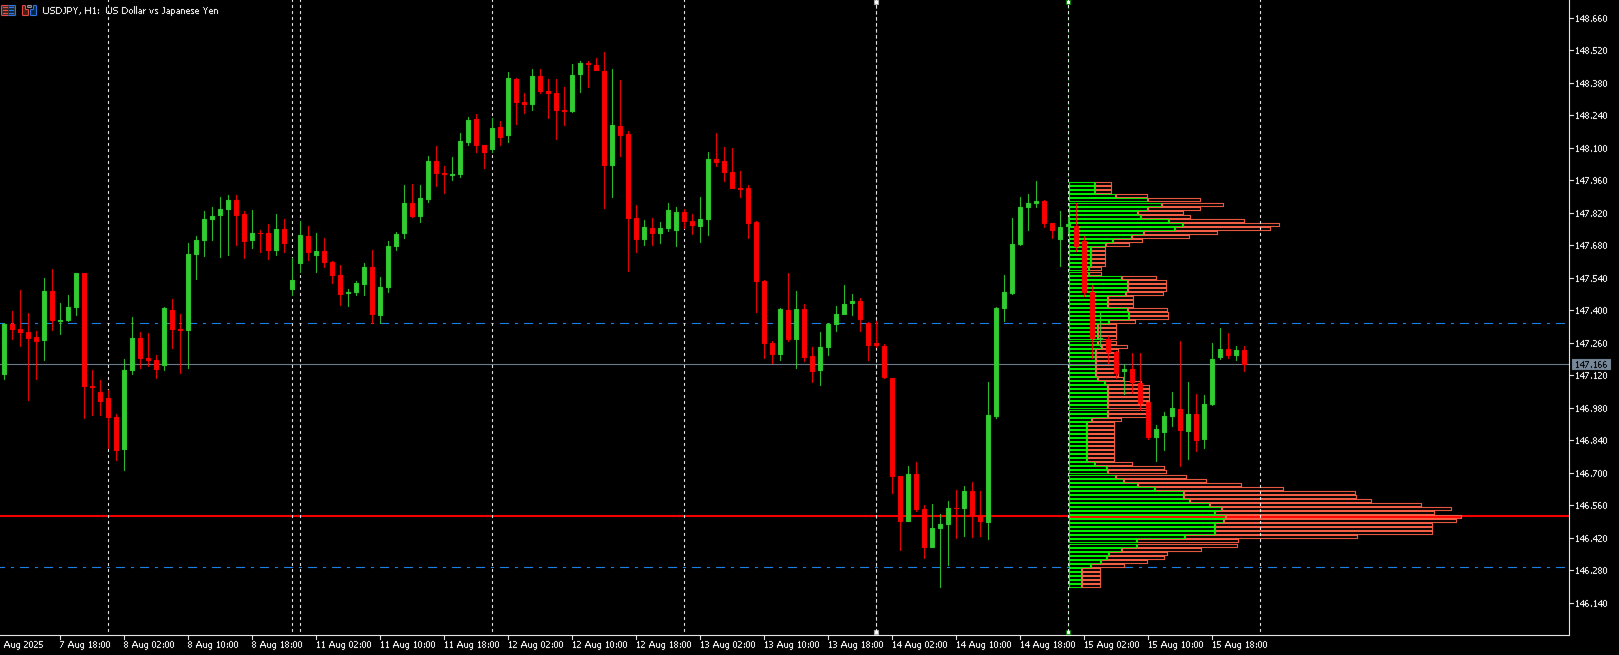
Institutional levels POC VAH VAL clearly drawn and constantly updated.
Optimized performance with tick data and smart fallback when trade ticks are not available.
Adaptive graphics with profile width proportional to the chart window for maximum readability.
How it works
Draw the two VLINEs named VP begin and VP finish to delimit the time range. The indicator aggregates volumes by price levels into a configurable number of vertical buckets. If available, it uses trade ticks to classify each transaction as buy or sell. Alternatively, it applies a bar-based distribution with configurable bias, ensuring consistent and informative results. POC is the price level with maximum volume, while VAH and VAL expand the value area around the POC up to the selected percentage.
What makes the visualization unique
Dual rectangles per level with buy on the left and sell on the right, normalized to the POC for immediate comparison between levels.
Dedicated colors for buy and sell, with a distinct highlight for the POC level.
Horizontal lines for POC, VAH, VAL drawn in the background to avoid covering price action.
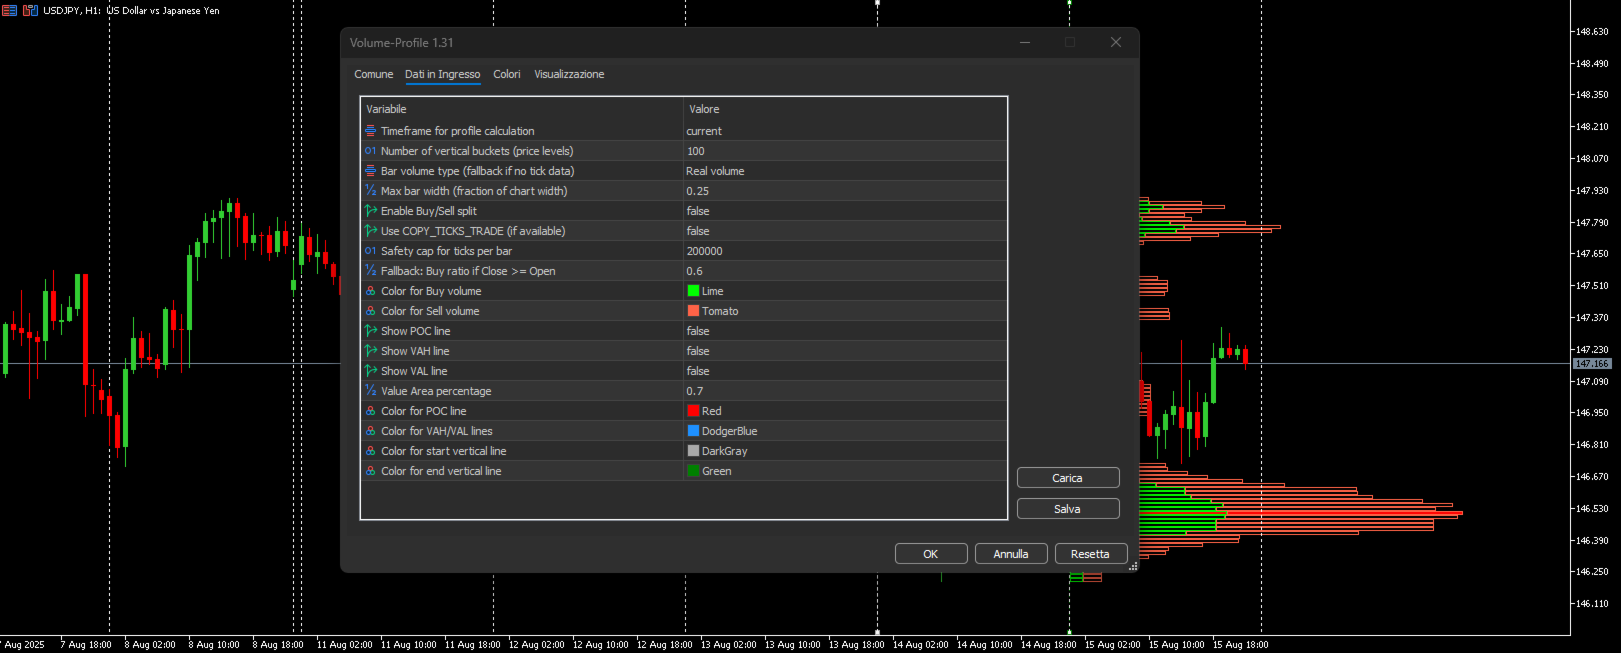
Main parameters
Calculation timeframe selectable or automatically set to the current one.
Level precision via the number of buckets to control profile granularity.
Volume type real or tick as fallback.
Maximum profile width as a fraction of the chart width to adapt the layout.
Buy/Sell split enabled with COPY_TICKS_TRADE when available.
Tick limit per bar for safety and performance.
Fallback bias to classify volumes when buy/sell flags are missing.
Value Area percentage to define the extension of the value area.
Customizable colors for buy, sell, POC and VA lines.
Trading tips
Confluence with price action using POC VAH VAL as reaction levels aligned with market structure.
Buy/Sell imbalance reading to detect absorption and possible reversals inside the value area.
Multi-timeframe approach calculate the profile on a higher timeframe while observing a lower one for precise execution.
Risk management using POC and value area boundaries to define entries, stops and targets with statistical logic.
Compatibility and data
Works on any symbol with standard chart. For the best Buy/Sell split accuracy, a broker with full trade tick history is recommended. If such data is not available, the fallback mode still provides a coherent and useful profile.
Suggested combination
To maximize trading effectiveness, combine with a candlestick pattern analyzer for timing and confirmation on volume profile levels.
Candlestick Pattern Analyzer: https://www.mql5.com/en/market/product/145419
volume profile, smart volume profile, poc, vah, val, order flow, buy sell split, delta volume, tick data, market profile, value area, vwap, support resistance, breakout, pullback, scalping, intraday, swing trading, multi timeframe, price action, volume analysis, auction market theory, poc rotation, value area, cluster volume, volume histogram, technical analysis, forex, futures, cfd


cool indicator