Watch the Market tutorial videos on YouTube
How to buy а trading robot or an indicator
Run your EA on
virtual hosting
virtual hosting
Test аn indicator/trading robot before buying
Want to earn in the Market?
How to present a product for a sell-through
Technical Indicators for MetaTrader 5 - 109

Summary
This indicator plots multiple pivot points (support and resistance levels) using various calculation methods, allows customization of their appearance, and can alert when price touches these levels. It works on different timeframes and can display historical levels or just the current ones.
Overview Purpose : Plots dynamic pivot levels (Pivot, S1-S4, R1-R4) on the chart to help identify potential price reversal zones. Key Features : Supports 7 calculation methods (Classic, Camarilla
Volonacci Indicator It is an indicator that combines Fibonacci and volume to determine the price direction This indicator helps you identify Fibonacci angles according to the strategy The Volonacci indicator is indeed an interesting combination of Fibonacci levels and volume. This indicator uses Fibonacci tools to identify potential support and resistance levels, and enhances this by using volume to confirm the strength behind the price action.
MT4 Version https://www.mql5.com/en/market/produ
VWAP Trend Pro (Volume Weighted Average Price) is a versatile trading tool that can be used effectively in several ways: This is an advanced Volume Weighted Average Price indicator that revolutionizes your trading experience by dynamically changing colors across scanned timeframes, providing real-time trend insights. The intuitive right corner scanner with three simple squares represents Monthly, Weekly, and Daily trends, each bordered by the current trend color and with background color indicat
The indicator generates entry signals for BINARY OPTIONS OR FOREX SCALPING, normally on the chart you see an arrow that can appear or disappear on the last candle, this is normal: the indicator is processing the data, and reads the conditions to send an entry signal. The conditions vary every second for this reason the signal appears and disappears. THIS IS PRACTICALLY A WARNING FOR THE TRADER TO BE READY because the conditions for a possible entry are forming. At the close of the candle, IF TH

very simple indicator to help with fast risk management during volatility.
~Displays: - stop loss in points of your choice. - take profit in points of your choice. - what lot size to risk on the trade relative percentage.
~Values that can be changed: - take profit points. - stop loss points. - risk in percentage. - color of lines. - width of lines. - linestyle. - buy / sell trade.
A simple Zig Zag indicator with added visualization of Higher High, Lower High, Higher Low, Lower Low. This indicator will be very helpful when working with support/resistance levels. The ZigZag indicator is a fundamental tool that will significantly help you navigate complex situations in the financial markets. By providing a clear visual representation of price movements and trends, it simplifies the analysis process and improves decision-making capabilities. Its role in identifying trends and
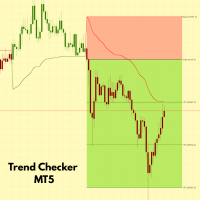
Trend Checker MT5 (GammaTrend) — Smart Indicator for Trend & Trade Levels Summary
Rule-based trend visualization with ATR-aware entries, adaptive stop-loss, and optional targets. What it does
GammaTrend analyzes price action together with the Average True Range (ATR) and selected market-closure conditions to highlight trend direction, suggest potential entry zones, and compute indicative stop-loss and target levels. It is a visual analysis tool ; it does not execute trades. Key features Trend

Simple Japanese candlestick indicator
Contains 3 patterns: - bearish engulfing - bullish engulfing - doji
Only contains these 3 because after rigorous testing and trading (data) these seem to be the most efficient. Also contains: - alerts if enabled
When japanese candlestick is detected it is colored with relevant color depending on bias, and also shows label next to it. Labels: - BEG = Bearish engulfing - BE = Bullish engulfing - DO = Doji
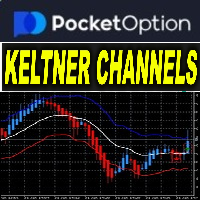
ocket Options Keltner Channel with MA v3.12 Indicator Name: Keltner Channel v3.12 – Advanced Trend and Signal Indicator
Version: 3.12
Release Date: 2024
Platform: MetaTrader 5 (MT5)
Category: Trend Indicators Overview
Keltner Channel v3.12 is a trend-following indicator that combines Keltner Channels with Moving Averages (MA1 and MA2) to identify breakouts, trend shifts, and momentum changes. This tool provides real-time buy and sell signals, visual markers, and alerts to assist traders in dec
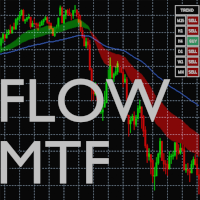
This indicator takes as parameters the periods for three moving averages (Short, Long, Very_Long) and displays them for the current timeframe: - in the form of a cloud (green if Short is greater than Long, red if Short is less than Long) - as a line for the Very_Long moving average. It also allows you to display the status (BUY or SELL) of these same moving averages but for the M15, H1, H4, W1 and MN1 timeframes. This information is summarized in the window titled "TREND", where, for each timefr

Trend Strength Visualizer A Simple Tool for Trend Analysis This indicator helps you quickly assess the strength of market trends using fast and slow moving averages. It’s designed to give you a clear visual representation of the trend, so you can make better trading decisions. ~Displays: Green Line : Strong uptrend (potential buying opportunities). Red Line : Strong downtrend (potential selling opportunities). ~Values That Can Be Changed: Fast MA period. Slow MA period. Line color for uptrend an
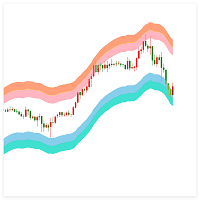
Indicator Introduction: The Volatility Range Indicator aims to help traders identify the current market's volatility range by analyzing historical price data. By calculating the upper and lower bounds of price fluctuations, traders can determine potential support and resistance levels, providing a foundation for subsequent trading decisions. This indicator is particularly suitable for ranging markets and high-volatility environments, as it can effectively assist traders in capturing price breako

One of the most accurate ways to predict price movements is to identify imbalances. When we identify significant price imbalances (aka fair value gaps or fvgs/ifvgs), it becomes relatively easy to place trades based on continuations and retracements. A moving average simply cannot give you anywhere near the precision we find when we observe the reaction of price to an imbalance. There are a few products on the market that claim to provide trading opportunities based on imbalances, but we believe

Checklist Indicator for MT5 Streamline your trading process with the Checklist Indicator —a powerful tool designed to keep you disciplined and organized. This indicator allows you to create and manage a personalized checklist directly on your chart, ensuring you follow your trading rules before entering a position. ️ Customize your own trading checklist
️ Stay consistent and avoid impulsive trades
️ Improve decision-making with structured analysis
️ Seamlessly integrates into your MT5 workfl
SAR Vision MTF – Multi-timeframe Parabolic SAR Indicator for MT5 SAR Vision MTF is a multi-timeframe technical analysis tool that displays Parabolic SAR values from higher timeframes directly on the current chart. It is designed to assist traders in analyzing broader market trends without switching between multiple charts. Key Features Multi-timeframe functionality – View Parabolic SAR signals from higher timeframes (e.g., M5, M15, H1, H4) on lower timeframe charts. Customizable appearance – Mo

Uncover the true hidden patterns of the market with the PREDATOR AURORA Trading System—the final boss of hybrid trading Indicators. See what others don't!
PREDATOR AURORA Trading System a powerhouse designed for those who refuse to cower in the shadows of mediocrity. This isn't just another indicator, it is the cheat code ; it is your unfair advantage , a sophisticated hybrid hunting system that tracks market movements with lethal precision in a jungle where only the strongest survive. Inspir

Utility of the Indicator Multifaceted Analysis : Allows for a comprehensive view of the market through different metrics (trend, volatility, momentum, risk, support/resistance). Trading Signals : Offers clear buy and sell signals, aiding traders in making entry and exit decisions. Risk Management : The risk buffer helps to assess when it is safe or risky to execute trading operations. Customizable Visualization : With multiple colors and chart styles, it becomes easy for the trader to interpre

AriMax – AI-Powered Trading Robot AriMax is a cutting-edge AI-powered trading robot designed to help traders maximize profits while minimizing risk. Utilizing advanced machine learning algorithms and real-time market analysis, AriMax identifies high-probability trade opportunities with precision and speed.
Key Features: AI-Driven Market Analysis – Analyzes market trends and patterns to make data-driven trading decisions.
Automated Execution – Places trades seamlessly with optimiz
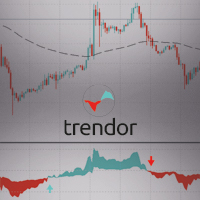
The TRENDOR 1.0 indicator is designed to identify and filter market trends using a combination of RSI and ATR indicators. This powerful trend detection system helps spot significant RSI crossovers while filtering out false signals using an ATR and an EMA (Exponential Moving Average). The purpose of this indicator is to provide clear and precise signals for optimal trading decision-making.
Main features:
Short and Long RSI: Combines the values of two RSIs (short and long) to detect market tr
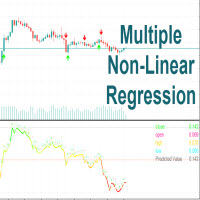
Multiple Non-Linear Regression This indicator is designed to perform multiple non-linear regression analysis using four independent variables: close, open, high, and low prices. Here's a components and functionalities: Inputs: Normalization Data Length: Length of data used for normalization. Learning Rate: Rate at which the algorithm learns from errors. Show data points: Show plotting of normalized input data(close, open, high, low) Smooth?: Option to smooth the output. Smooth Length: Length of

MTF Candles Overlay - Professional Multi-Timeframe Analysis Tool (Now with Yearly Y1 timeframe!) The MTF Candles Overlay is a powerful and visually intuitive indicator that allows traders to view candles from higher timeframes directly overlaid on their current chart. This eliminates the need to constantly switch between multiple timeframe charts, enabling faster analysis and better trading decisions. Key Features Complete Timeframe Coverage All Standard Timeframes : M1, M2, M3, M4, M5, M6, M1
Un order book, ou carnet est un outil numérique qui affiche en temps réel les ordres d'achat et de vente pour un actif financier spécifique, comme une action, une crypto-monnaie ou une paire de devises. Il permet aux traders de visualiser la profondeur du marché, c'est-à-dire la quantité d'ordres d'achat et de vente à différents prix. Voici une description des éléments clés d'un order book : Colonne d'achat (Bid): Affiche les ordres d'achat en attente pour un actif. Les prix d'achat sont classés

Trend indicators are one of the areas of technical analysis for use in trading on financial markets.
The Angular Trend Lines indicator comprehensively determines the trend direction and generates entry signals. In addition to smoothing the average direction of candles,
it also uses the slope of the trend lines. The principle of constructing Gann angles was taken as the basis for the slope angle.
The technical analysis indicator combines candlestick smoothing and chart geometry.
There are two ty
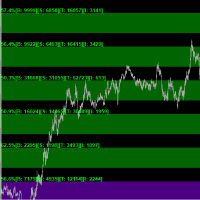
Key Features: • Multi-Zone Analysis: Track volume patterns across multiple customizable price zones • Real-Time Volume Tracking: Monitor buy/sell pressure as it develops • Dynamic Price Levels: Automatically adjusts zones around daily opening prices • Advanced Statistics: View detailed volume metrics and price action percentages
Technical Capabilities: • Volume Distribution Analysis - Buy/Sell volume ratios - Volume imbalance detection - Total trading activity monitoring - Price action directio

This isn't just an indicator; it's a top-tier market analysis tool that combines the power of various technical analysis techniques into one package. Perfect for traders seeking precision and clarity in their trading decisions. Key Features: HiLo Activator: Easily capture the essence of market trends. This component differentiates between bullish or bearish markets, helping you to be on the right side of the move. MACD (Moving Average Convergence Divergence): Quickly identify changes in market

Discover the Power of the QDOTRAXY Indicator: Your Key to Precise Trading Decisions! Have you ever imagined having a powerful ally that combines advanced technical analysis with real-time alerts to maximize your market operations? We introduce ULTRA ADVANCED, the indicator that revolutionizes how you make buy and sell decisions. Why Choose QDOTRAXY? Unmatched Accuracy: QDOTRAXY combines multiple technical indicators (MACD, Bollinger Bands, SAR, and Moving Average) to generate highly reliable si
In the dynamic world of forex trading, technical analysis is an essential tool for traders seeking to navigate the complexities of the currency markets. One key element of this analysis is the interpretation of candlestick patterns, particularly the phenomenon of consecutive one-sided candles. These candles, characterized by a uniform direction — either completely bullish or bearish — offer significant insight into market sentiment and potential future movements. Understanding the implications o
This indicator automatically identifies and plots key support/resistance (S/R) levels on price charts using a hybrid algorithm combining fractal detection , price touch validation , and dynamic level managemen. Key Features
Support and Resistance Levels: Support levels and Resistance levels are drawn in red . Fractal-Based Detection: Levels are identified based on fractal highs and lows. Efficient Memory Handling: The number of levels is limited to 100 to avoid clutter. Cleanup on Deletion: All
The Volume-Weighted RSI (VW-RSI) is a powerful technical analysis tool that combines the traditional Relative Strength Index (RSI) with volume data to provide a more nuanced view of market conditions. By incorporating volume into the RSI calculation, the VW-RSI offers a unique perspective on price momentum, helping traders identify potential reversals, confirm trends, and filter out false signals. Below is a detailed explanation of the VW-RSI, its features, and why it stands out as a unique indi

Solar Prediction – Indicator for Market Price Analysis Solar Prediction is a tool designed to analyze market price movements. The indicator processes market dynamics and helps identify potential entry and exit points. Market data analysis without additional indicators
Flexible application – works on different timeframes
Ease of use – suitable for both beginners and experienced traders
Adaptability to market conditions – tracks price movement changes Solar Prediction is a solution
Levels Plus Indicator Overview The Levels Plus Indicator is a sophisticated and highly effective tool designed for traders who seek to identify key price levels in the market. This indicator combines multiple key levels and Volume Profile Point of Control (POC) lines to provide a comprehensive view of the market structure. Whether you're a day trader, swing trader, or long-term investor, the Levels Plus Indicator offers valuable insights that can help you make informed trading decisions. Key Fe

Structure Levels (Highs & Lows) Indicator for MetaTrader 5
Decode Market DNA — Trade with Institutional Precision Description:
The Structure Levels (Highs & Lows) Indicator is your secret weapon to map the market’s hidden roadmap. Designed for traders who think in terms of price action and market structure, this tool automatically identifies critical swing highs and swing lows, transforming chaotic charts into a clear blueprint of support/resistance zones, breakout opportunities, and trend rev
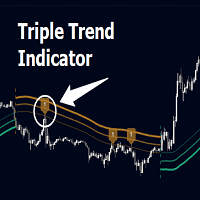
Triple Trend Indicator is a versatile trend-following tool designed to help traders identify trend strength and potential pullback levels using a three-band system. Each band represents a varying degree of price deviation from the mean, providing progressively stronger trend signals.
Key Features:
Three Adaptive Bands:
The indicator dynamically calculates three bands (1, 2, and 3) based on moving averages (SMA, EMA, WMA) and ATR multipliers.
Bands are positioned below the price in a
Panther Scalping Indicator – The Ultimate Trading Weapon for Gold, Forex & BTC! Dominate the Markets with Precision Buy & Sell Signals! We’ve designed the Panther Scalping Indicator to give you an unfair advantage in trading Gold (XAUUSD), Forex pairs, and BTC. This powerful tool is built on the proven Panther Scalping Strategy , ensuring you never miss a high-probability trade. How It Works:
Lime Up Arrow – A clear Buy Signal when market conditions align.
Red Down Arrow – A strong
Panther Scalping Indicator – Your Ultimate Trading Edge! Maximize Your Profits with the Panther Scalping Indicator! We’ve transformed the powerful Panther Scalping Strategy into an advanced indicator that gives you precise Buy and Sell signals on Deriv’s Synthetic Indices , including Volatility Indices, Step, Jump, and Drift Switching Indices. How It Works:
Lime Up Arrow – Clear Buy Signal when market conditions align.
Red Down Arrow – Strong Sell Signal to capitalize on downtrends

Initial Balance Indicator for MQL5 The Initial Balance Indicator is a powerful trading tool for the MetaTrader 5 (MT5) platform that helps traders analyze market structure by marking the Initial Balance (IB) range of a trading session. This range is typically formed during the first X minutes of a trading session (e.g., the first hour in futures markets) and acts as a key reference for potential price movements. Key Features: Customizable Time Period: Define the exact start and end time for the
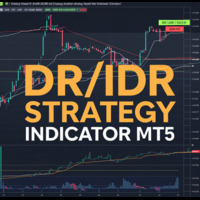
Unlock the full potential of your trading strategy with the DR IDR Indicator and the DR ODR Indicator for MT5. These powerful tools are designed to enhance your trading and increase your market performance, especially during high-volatility periods such as the opening of major stock indices like the DAX, DOW, NASDAQ, and S&P 500. DR / IDR Trading Strategy: Leverage Explosive Price Movements The Opening Range Breakout (ORB) Indicator is a must-have tool to capitalize on the explosive price moveme
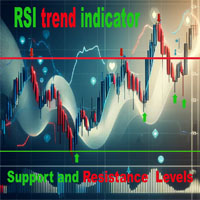
Индикатор RSI Уровни Поддержки/Сопротивления – это мощный инструмент технического анализа, который помогает трейдерам находить точки входа и выхода на основе сигналов RSI и ключевых уровней цены. Индикатор подтверждает зоны перепроданности и перекупленности с учетом исторических максимумов и минимумов. Основные особенности Сигналы на основе RSI: Покупка при перепроданности, продажа при перекупленности.
Динамические уровни: Автоматический расчет ключевых зон поддержки и сопротивления.
Визу

Este es un indicador que trabaja en indices BOOM 1000 y su equivalente en Weltrade Gain 1200. Basicamente trabaja en temporalidad de 15 minutos y su objetivo es cazar spikes. Se recomienda la temporalidad de 15 minutos por que genera un poco mas de precision. Se recomienda indices que general altos spikes, como el BOOM 1000. Lo interesante de cazar spikes es que se puede gestionar el riesgo. La configuracion ideal para BOOM 1000 y Gain 1200 es la que esta por defecto.
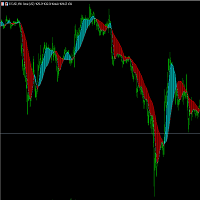
Trend Indicator Pro Use any currency and any time period you want For greater profitability use a risk return of at least 1:3 or 1:4 Entry Signal : Appears after the moving average crossover closes ️️
Histogram Flip : Signals important trend changes ️
Easy to use : Perfect for those who want fast, confident decisions!
Boost your accuracy : Find the best market entry moments with more confidence!
Get straight to the point and seize the best trend opportunities!
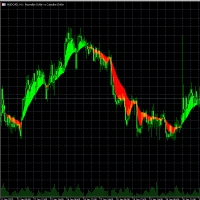
CrossMann is a simple and elegant indicator for MetaTrader 5, which represents the areas of intersection of moving averages.
This indicator displays two Exponential Moving Averages (EMA), with different periods, calculated by closing prices, and colors the ranges of their intersection in two colors - for buying and selling.
The indicator will work great on all trading instruments and timeframes in strategies where a similar principle is used.
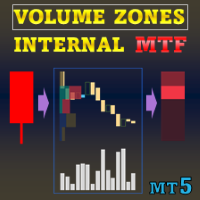
Special offer : ALL TOOLS , just $35 each! New tools will be $30 for the first week or the first 3 purchases ! Trading Tools Channel on MQL5 : Join my MQL5 channel to update the latest news from me Volume Zones Internal Visualizer Multi-Timeframe – The ultimate solution for gaining a detailed view of lower timeframe volume activity while trading on a higher timeframe chart. If you’re looking for a powerful and intuitive volume analysis tool that supports multi-timeframe functionali

Gaussian scalper indicator based off the same logic used in my gaussian scaler ea. Enjoy!!
The Gaussian Scalper is a precision scalping indicator designed for high-probability trend entries based on advanced filtering techniques. It utilizes a combination of Least Squares Moving Average (LSMA) and Gaussian filtering to detect trend direction and trade signals. The strategy is reinforced by ADX-based trend confirmation, MACD filtering, and a volume threshold for trade validation. Risk management
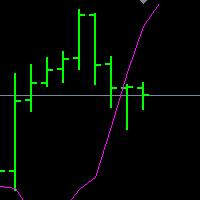
DINAPOLI,MACDP,DMP,XMP,MT5版本 帝纳波利主图MACD指标,国内又叫做:DMP,XMP,MACDP,DNMACDP。 是MACD主图化指标,参数为: FAST=8.3896 SLOW=17.5185 SIGNAL=9.0503 SHIFT=1; 主要作用: 趋势判断,动态压力辅助,SG识别。 是帝纳波利点位交易法不可缺少的指标工具。 1. 只使用 DiNapoliDMP 作为判定趋势的工具。不使用它作为判断超买 / 超卖或动量的指标。 2. 一个上升趋势信号在价格从下向上穿越DMP时被给出。一个下降趋势信号在价格从上向下穿越DMP时被给出。穿越时形成的角度非常重要,陡直的角度,接近于 90 度,往往决定了后续的趋势质量更高。 3. 正确的公式和数字的输入才能使这些研究有效。它们经历了时间的验证。
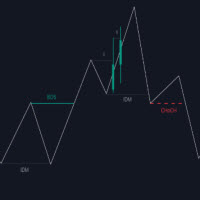
The Market Structure with Inducements & Sweeps indicator is a unique take on Smart Money Concepts related market structure labels that aims to give traders a more precise interpretation considering various factors. Compared to traditional market structure scripts that include Change of Character (CHoCH) & Break of Structures (BOS) -- this script also includes the detection of Inducements (IDM) & Sweeps which are major components of determining other structures labeled on the chart. SMC & price a
How Antabod Stochastic Works Antabod Stochastic is a cutting-edge technical indicator designed to analyze market momentum and identify overbought and oversold conditions with unparalleled precision. Here's a breakdown of how it works and what makes it a game-changer for traders: ________________________________________ 1. Core Concept At its heart, Antabod Stochastic is based on the stochastic oscillator principle, which measures the position of a current price relative to its range over a spec

This trend-following indicator calculates dynamic trailing stops using a modified (or unmodified) ATR method with a Wilder's moving average for smoothing. It displays separate bullish (green) and bearish (red) trailing stop lines that adjust as the market moves. recommended to be used in conjution with Gaussian Scalper XD indicator for trade entry with multiple confirmations. Gaussian Scalper XD: https://www.mql5.com/en/market/product/132204?source
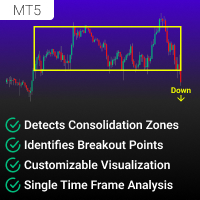
The Consolidation and Breakout Detector is an advanced single time frame MT5 indicator designed for traders who want to identify consolidation zones (ranging markets) and detect breakout opportunities . It automatically scans historical price action, identifies areas where the market is moving sideways, and alerts traders when a valid breakout occurs. This tool is useful for breakout traders , trend followers , and range traders , helping them make informed trading decisions based on price struc
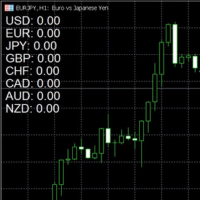
New Trading Tool: Optimize Your Trades! I’m excited to introduce a brand-new tool I’ve developed to help you make trades without second-guessing! Unlike traditional indicators, this tool doesn’t simply track price fluctuations. It deeply analyzes the correlations between currencies and helps you identify the perfect moments to enter the market. Here’s how it works: Zero = No Trade : As long as the indicator is at zero, it means market conditions are not favorable, so I stay out of the mark

ShoukatSRI is an advanced MQL5 indicator designed to help traders identify potential market trend changes before they fully develop. Using a combination of smoothing techniques and custom signal logic, the indicator processes market data to provide early alerts through clearly defined buy and sell signals. Key Features: • Early Trend Detection – The indicator employs advanced algorithms such as SuperSmoother, Gaussian filtering, and ALMA to smooth out market noise and highlight significant movem
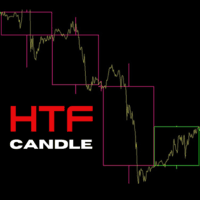
ICT Traders! Here's another cool Indicator that will allow to trade the HTF narrative while focus on price action on your entry timeframes. The following are the input for setup the indicator: Maximum Bar: The number of HTF bar you want to display Bullish Candle: The color of the bullish candle Bearish Candle: The color of the bearish candle Border Width: the width of the HTF candle drawn on the chart.

A Fair Value Gap (FVG) is a three-candle price imbalance where price moves aggressively in one direction, creating a gap between the wicks of the first and third candle.
How to Identify an FVG: The second candle must have a large body , showing strong displacement.
The wick of the third candle must not overlap with the wick of the first candle , leaving an inefficiency. The third candle should not close beyond the high (bullish) or low (bearish) of the second candle.
Usage: Internal Range
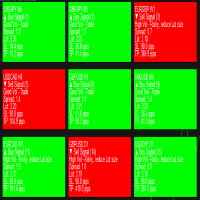
Introducing Telos Dashboard Indicator – Your Ultimate Trading Companion Optimized For Forex! Note: This is a dashboard indicator and won't work on the strategy tester. Demoing it there is a waste. Instead get the main indicator or, use the demo of DynamicCOG to see how it works with arrows, although Telos is a more refined and filtered version than the DynamicCOG indicator. Never Miss a Trading Opportunity Again!
Welcome to the future of trading with the Telos Dashboard Indicator ! Inspired
ADBIN BAND – Adaptive Channel Indicator for XAUUSD and DE30
Description:
The ADBIN BAND is a trading indicator designed for analysis of XAUUSD (Gold) and DE30 (German Stock Index) . It generates dynamic price channels using an Adaptive Moving Average (AMA) to reflect market volatility. Functionality: Dynamic Channels : Plots upper and lower bands around price, adjusting to volatility via AMA. Signal Generation : A green arrow appears when price closes above the upper band. A r

The indicator is designed to help in making a decision on the direction of trading (buy or sell). It is a history scanner that searches for matches of the current pattern (combination of several current bars) with historical data in percentage terms by the relative vertical position of candles relative to each other, the size of each candle, the size of the candle body and the candle shadows. In history, the matches found are indicated by vertical lines on the candle of the beginning of the soug
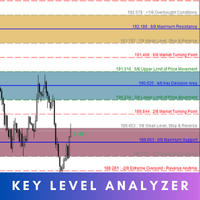
Key Level Analyzer – Know Better, Trade Smarter Key Level Analyzer is a powerful trading tool designed to provide precise market insights by identifying high-probability price zones , market turning points , and key decision areas . Unlike traditional indicators, it uses a smart algorithm to dynamically calculate support, resistance, and balance zones, helping traders make informed, data-driven decisions . MT4 Version - https://www.mql5.com/en/market/product/132809/ With real-ti

ATR Master – The Master of Volatility on Your Chart! ATR Master is a professional ATR indicator that instantly displays key data directly on the chart! It helps you analyze price movement range, determine the distance traveled and the remaining potential , as well as monitor the candle timer and current spread. Why Traders Choose ATR Master? Daily ATR Analysis – See the average price movement range for the day, with the selected period displayed in brackets.
ATR Passed – Track how

The "Setup Bivit" Indicator The "Setup Bivit" is an advanced technical indicator designed for MetaTrader 5, developed to provide a clear and comprehensive visual analysis of the financial market. Inspired by customized strategies, this indicator combines intuitive visual elements and decision-support tools, making it a powerful ally for traders looking to identify trends, support and resistance zones, and price patterns across different timeframes. With a rich and interactive graphical interface

Manyal trading system, CovEchoTrend Robot, focuses on reliability and flexibility. By employing statistical analysis methods to study the relationships between the base indicator and market patterns, the system enables a deeper understanding of market processes. Intelligent pattern analysis: The application of statistical data processing helps identify key trend reversal points more accurately, signaling significant market shifts. Informed decision-making is based on the intersection of indicato

Super Trend Indicator – Trend Following Tool
Description:
The Super Trend Indicator is a trend-following tool designed to assist traders in identifying market trends. Utilizing the Average True Range (ATR), it dynamically adjusts to market volatility and generates visual signals. The indicator plots lines directly on the chart, changing color based on trend direction. Crosses between the price and indicator line may suggest potential trend shifts. Key Features: Dynamic trend detection using ATR.
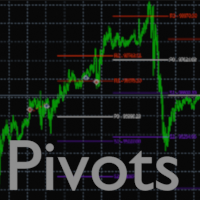
Pivots Points Indicator:
Displays the Pivots Points lines for the Daily, Weekly or Monthly periods
Several parameters are possible:
1 - Choice of calculation method:
- Classic
- Woodie
- Camarilla
- Fibonacci
2 - The choice of the period for calculating the pivot points ( Daily, Weekly or Monthly )
3 - The display or not of the price labels (to the right of each line) as well as the size of the associated font
4 - The number of pivot points (previous) that we want to display
5 - Po

TW Trend Scalper Indicator:
The TW Scalper Shoot brings you a unique trading experience by utilizing the latest trading strategies and artificial intelligence technology. This product meets the diverse needs of scalper traders by providing two distinct categories of signals:
Test this exceptional product today and start your unique experience toward becoming a trend scalper.
Signal Categories:
1. Long-term and Safe Signals: These signals are identified using price action strategies (smart m
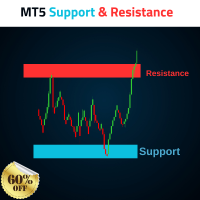
MT5 Support and Resistance Indicator Automatic Drawing of Multiple Supports and Resistances with levels. Supports As follow 1. Weak Support 2. Untested Support 3. Verified Support 4. Proven Support 5. Turncoat Support Resistances As follow 1. Weak Resistance 2. Untested Resistance 3. Verified Resistance 4. Proven Resistance 5. Turncoat Resistance Best Strategy to use 1. Identify Trend Direction on Daily Time Frame, Example Gold =
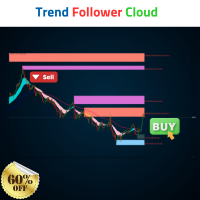
Trend Follower Cloud Trend is your freind. Advanced Indicator follow the trend, and gives a clear levels to buy and sell, and have Stop loss and Targets. Watch the Video to know how to use it combined with our Support and Resistance Indicator. Blue Trend Line Take a buy when we get a cloud intersection above the Bule line. Red Trend line Take a Sell when the Cloud drops below the Red line.

Market Session Asia Eu USA – Visualize Global Trading Sessions on Any Timeframe Market Session is a powerful MetaTrader 5 indicator that highlights the key trading sessions— Asian, European, and US —directly on your chart. It works across all timeframes , allowing traders to quickly identify market activity and volatility during different global trading hours. Features:
️ Displays session boundaries for Asia, Europe, and the US
️ Works on all timeframes for a flexible trading experience

Indicator Description: "Currency Strength Panel with Trend Analysis" This indicator is designed for analyzing the strength of currency pairs and determining their current trends, helping traders make more informed trading decisions. It displays a panel on the chart that shows the strength of each currency pair based on price movements across different timeframes (H1, H4, D1) and identifies whether the pair is in a trend or counter-trend. How to Use this Indicator: Currency Pair Strength Analysis

Indicador IPCPayroll – O Segredo dos Traders de Sucesso! Quer operar com mais confiança e precisão com os preços do dia da divulgação do Payroll e do IPC Americano ? O Indicador IPCPayroll foi desenvolvido para traders que querem acompanhar o impacto dessas notícias no mercado de forma estratégica e organizada. Marcação Automática das Notícias
O indicador insere automaticamente linhas horizontais no preço de abertura do candle de 5 minutos das datas de Payroll e IPC. Visualização Clar

This Indicator enhances the default Relative Strength Index (RSI) by introducing several improvements. First, it visually highlights overbought and oversold regions by changing the RSI color from white to red. Second, it includes additional reference lines at 20, 40, 50, 60, and 80, providing a clearer framework for assessing RSI values. The most notable feature is the use of the middle 50-line to indicate the current market cycle. The color of the 50-line dynamically reflects the cycle: green f

Smart Key Levels Indicator for MT5- Advanced Support & Resistance Tool The Smart Key Levels Indicator is a professional-grade tool for traders seeking precise support and resistance levels. Using advanced algorithms, it identifies key price levels with dynamic strength scoring, volume filtering, and higher timeframe confluence. Perfect for all trading styles and timeframes, this indicator provides clear visual signals with customizable settings. Available for both MT4 and MT5 platforms. Unlo
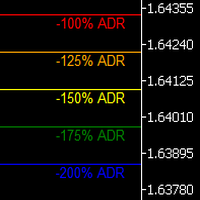
Uncover the market’s secret zones with the ADR Levels+ Indicator. This dynamic tool plots ADR extension levels at 100%, 125%, 150%, and 200% right on your chart. In most cases, price dances between these boundaries—but when it breaks out, it often signals a prime opportunity for a mean reversion trade or the start of an evolving trend. Plus, an integrated alarm system triggers as soon as these key levels are reached, ensuring you never miss a lucrative trading opportunity. Elevate your strategy
Learn how to purchase a trading robot from the MetaTrader Market, the store of application for the MetaTrader platform.
The MQL5.community Payment System supports transactions via PayPal, bank cards and popular payment systems. We strongly recommend that you test the trading robot before buying, for a better customer experience.
You are missing trading opportunities:
- Free trading apps
- Over 8,000 signals for copying
- Economic news for exploring financial markets
Registration
Log in
If you do not have an account, please register
Allow the use of cookies to log in to the MQL5.com website.
Please enable the necessary setting in your browser, otherwise you will not be able to log in.