Watch the Market tutorial videos on YouTube
How to buy а trading robot or an indicator
Run your EA on
virtual hosting
virtual hosting
Test аn indicator/trading robot before buying
Want to earn in the Market?
How to present a product for a sell-through
Technical Indicators for MetaTrader 5 - 114

Doctor Edge Strategy Pro – Range & Breakout Zones Doctor Edge Strategy Pro is a professional indicator designed to simplify market reading based on range and breakout zones. It combines concepts of Price Action, ICT, and Smart Money Concepts, providing an automated and precise approach for traders of synthetic indices, cryptocurrencies, and Forex pairs. How It Works Doctor Edge Strategy Pro automatically draws on the chart: The range zone (lateral accumulation); The upper breakout zone (gr

The Future Trend Channel is a dynamic and visually intuitive indicator designed to identify trend directions and inform potential price movements. Originally developed by ChartPrime for TradingView, this tool has been adapted for MetaTrader 5, offering traders a experience with similar functionality. Whether you're a swing trader, day trader, or long-term investor, the Future Trend Channel helps you visualize trend strength, anticipate reversals, and optimize entry/exit points.
Key Features Mu

Version: 1.0 Platform: MetaTrader 5 Type: Trend / Crossover Signal Indicator Overview
The Custom SMMA Indicator is a specialized trend-following tool designed for traders seeking early entry signals based on the interaction of two smoothed moving averages. Inspired by the principles of the Alligator indicator, this tool visualizes dynamic shifts in market direction through visual crossover signals on the chart. Key Features
Buy and Sell Signals: Clearly plotted arrow markers indicate potential
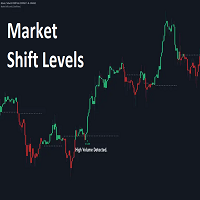
Market Shift Levels
This indicator detects trend shifts and visualizes key market structure turning points using Hull Moving Average logic. It highlights potential areas of support and resistance where price is likely to react, empowering traders to spot early trend transitions.
Market Shift Levels are horizontal zones that mark the moment of a directional change in market behavior. These shifts are based on crossovers between two smoothed Hull Moving Averages (HMA), allowing the indicator
KasTon Trend System: The Complete 2-in-1 Trading Strategy
Identify the Trend, Confirm the Signal, and Trade with Confidence! Do you suffer from confusion while trading? Do you find it difficult to determine the market's direction? Are you tired of losing money on false signals? The KasTon Trend System is here as an integrated solution to all these problems. This is not just an indicator; it is a complete trading strategy built on the synergy of two powerful, custom-built indicators. Our main g
KasTon Magic OSI: The Ultimate Trend Confirmation Oscillator Double-Confirm Your Trading Decisions and Enter the Market with Confidence! Are you tired of entering trades too early, only to see the market reverse on you? Do you struggle to determine if a new trend has real strength or if it's just market noise? To answer all these questions and take your trading to the next level, we have created the KasTon Magic OSI (Oscillator) . This is not just a simple oscillator; it is a powerful decision-
Universal Volatility Compass (UVC): Navigate Market Cycles with Confidence Across All Assets Since its introduction in 1993, the CBOE Volatility Index (VIX) has become the go-to measure for market risk and investor fear in the stock market. High VIX readings signal heightened volatility and often coincide with market bottoms, while low readings suggest complacency and market tops. But what about the vast universe beyond the S&P 500, Nasdaq, and Dow? Commodities, forex, cryptocurrencies, even ind

SmartEntry Signal is a custom indicator that provides accurate Buy and Sell signals based on dynamic market behavior. The indicator uses internal filters and price logic to detect potential entry points and marks them with visible arrows on the chart.
Features: - Buy/Sell arrows appear directly on the chart - Non-repainting signals - Designed for scalping and short-term trading - Works on any timeframe and symbol - Simple and intuitive interface
Recommended Use: - Timeframe: M15, M30 or
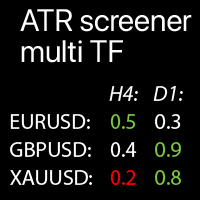
Multi-timeframe ATR values on the selected Symbols: compare the current market trends The indicator displays Average True Range values from all selected timeframes and Symbols in a single table , which allows you to quickly analyze current market price trends .
M ultifunctional trade manager : 66+ features | Contact me for any questions | MT4 version Each Symbol can be customized: removed / replaced. You can add up to 40 Symbols. The percentage of the current ATR deviation (compared

AI Trading Dashboard - Retracement Signal Indicator for BOOM & CRASH Plaese Leave Review OVERVIEW
Technical analysis indicator for BOOM, CRASH synthetic indices. Monitors daily trends and identifies retracement entry points based on configurable parameters.
KEY FEATURES
Signal Generation • BUY signals on BOOM indices during uptrend pullbacks • SELL signals on CRASH indices during downtrend bounces • Adjustable retracement threshold (default: 10 pips, can set to 20-30+ pips) • Signal cooldow

Bollinger Band Scanner Pro - Multi-Symbol Signal Detector Professional Trading Tool for MT5 Transform your trading with the most advanced Bollinger Band scanner available for MetaTrader 5! Key Features Intelligent Signal Detection Precision Algorithm : Advanced multi-phase signal detection that identifies extreme BB reversals Smart Filtering : Eliminates false signals using middle-line crossing analysis Trend-Aware : Detects BUY signals in downtrends and SELL signals in uptrends only Mu

Atlantis Pro Indicator — Precision Tick-by-Tick Market Insight with Portfolio Power Atlantis Pro Indicator is an advanced, multi-purpose tool that harnesses real-time tick-by-tick market data to detect key price levels and high-probability reversal zones with exceptional accuracy. By continuously analyzing each market tick, Atlantis Pro identifies critical shifts in buying and selling pressure, instantly displaying sharp Buy and Sell arrows directly on your chart — visible by default for immedi

Eye of the Sniper - Your Ally for Surgical Entries Transform your trading with an indicator designed to think like a sniper. "Eye of the Sniper" is not just another arrow indicator. It is an advanced market structure analysis tool, based on institutional concepts (SMC), that identifies high-probability entry zones with surgical precision. Stop guessing the market. Let "Eye of the Sniper" spot market manipulations and the optimal entry points that follow for you. The Strategy: A 3-Step Key Logic
A SmartTrendMA foi projetada para identificar melhor zonas de alta, baixa e consolidação, azul alta, vermelho baixa e branco consolidação, vai te auxiliar a identificar melhor a tendência. Em parâmetro regule melhor conforme sua preferência em grau pois cada par de moeda se adequa diferentemente a cor,mude também o período e se quiser mude exponencial ou simples.

CombinerPRO is a sophisticated MetaTrader 5 indicator designed for traders in binary options, OTC, synthetic markets, cryptocurrencies, and forex. It generates precise CALL and PUT signals using a combination of technical filters and supports integration with external indicators for enhanced strategy confluence. With a real-time statistics panel and backtesting capabilities, CombinerPRO empowers traders to optimize their strategies.
Key Features ️ Multi-Filter Signal Generation : Combines Mov
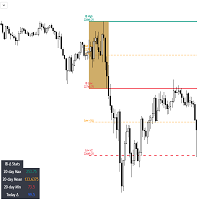
Initial Balance Wave Map – Powered by VWAP Wave
The Initial Balance Wave Map is your visual roadmap for navigating the first hour of trading like a pro. Built to align with the VWAP Wave System, this indicator automatically plots the Initial Balance (IB) high and low, calculates real-time IB extensions, and layers in key midpoints and volume-based structure to map out high-probability zones for both reversals and breakouts. This indicator enhancements and user-facing labels tailored for Auc
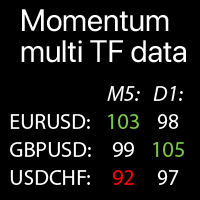
Multi-timeframe Momentum values on the selected Symbols: compare the current market trends The indicator displays Momentum indicator values from all selected timeframes and Symbols in a single table , which allows you to quickly analyze current market price trends .
Multifunctional trade manager : 66+ features | Contact me for any questions | MT4 version Each Symbol can be customized: removed / replaced. You can add up to 40 Symbols. Panel can be moved to any place of the chart (drag
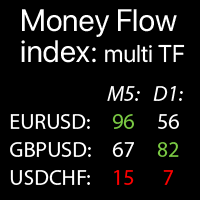
Multi-timeframe Money Flow Index: data on the selected Symbols: compare the current market trends The indicator displays MTF (Money Flow Index) indicator data from all selected timeframes and Symbols in a single table , which allows you to quickly analyze current market price trends .
My multifunctional utility : 66+ features | Contact me for any questions | MT4 version Each Symbol can be customized: removed / replaced. You can add up to 40 Symbols. Panel can be moved to any place o

Unlock powerful insights into market direction with this Volume Weighted Moving Average (VWMA) indicator for MetaTrader 5. Key Features:
Multi-Timeframe VWMA Analysis:
Quickly see if the price is above or below the Volume Weighted Moving Average on M5, M10, M15, M30, H1, and D1 timeframes , all in a single glance. Real-Time Cross Alerts:
Receive instant visual arrows and customizable sound notifications when price crosses above or below your chosen VWMA period. Precision Retest Detectio

OnTarget is a powerful tool for traders who operate based on price action, offering clear visual signals and high-potential opportunities. When combined with additional filters and good risk management, it can become an essential ally in your trading strategy. Ready to aim for the best trades? OnTarget could be your next step toward more precise trading!
O OnTarget é uma ferramenta poderosa para traders que operam com base em price action, oferecendo sinais visuais claros e oportunidades de

"THE MILLION-DOLLAR SECRET OF TRADING!" Everyone talks about knowledge. Everyone says: “Learn, study, analyze, and someday you’ll succeed.”
Sounds noble, doesn’t it? And yes — it’s true.
But here’s the reality most traders don’t want to admit: They don’t just want to learn — they want to see results. They want clarity, confidence, and growth now, not “someday.”
And that’s okay. Because in trading, you don’t have to spend years chasing the same mistakes. There’s a smarter way — a shortcut t

EngulfScanner is an MQL5 indicator designed to automatically and instantly detect Engulfing candle patterns—both bullish and bearish—on any timeframe and any instrument (Forex, indices, commodities, cryptocurrencies). With a highly customizable set of parameters, you can adapt it effortlessly to your trading style and integrate it into Expert Advisors without rewriting a single line of code. Main Features Live detection – Analyzes the forming bar to alert you ahead of potential reversals. Two se

DrMoxQuant EA Ultimate Version (MT5) How It Works:
The DrMoxQuant EA Ultimate Version does not execute trades automatically. Instead, it analyzes the market chart and provides clear buy or sell signals, showing exact price levels for entry, pullback, take profit, and stop loss. It works as a trend tracker to help you make more accurate trading decisions. Advantages of DrMoxQuant EA Ultimate Version: Clear signals: Visual buy and sell alerts with precise price levels to guide your decisions. Ful

How It Works DoctorEdge Asia-London-NY Buy & Sell Arrows Breakout is a professional indicator that identifies real breakout signals during the three most important trading sessions: Asia, London, and New York . The indicator automatically draws: Vertical lines showing the start and end of each session. Dashed horizontal lines marking the highs and lows formed within each session. Based on this session structure, it generates automatic BUY & SELL arrows , pointing to potential breakout zones ,

DoctorEdge X-MAN Intraday Vision The Smart Indicator for Catching Breakouts and Reversals with Precision How It Works DoctorEdge X-MAN Intraday Vision was designed to help intraday and scalping traders identify key price movements — especially true breakouts and potential false breakouts with reversal . When the price breaks above or below one of the indicator’s lines , the line automatically moves , following the new price direction. You can use this behavior as a kind of dynamic break-ev

DoctorEdge V-LINE (Pump it & Dump it) Strategy Pro Confirms trend direction using smart momentum logic and key price behavior How It Works DoctorEdge V-LINE is a smart visual indicator designed to detect trend impulses and confirm their strength based on how price reacts around certain dynamic zones. Buy Trend: When price reaches level -20 , the line turns green , signaling a potential buy . If price breaks above level 0 and the line stays green, the uptrend is confirmed . If price doe
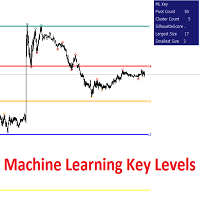
OVERVIEW
This script plots Machine Learning Key Levels on your chart by detecting historical pivot points and grouping them using agglomerative clustering to highlight price levels with the most past reactions. It combines a pivot detection, hierarchical clustering logic, and an optional silhouette method to automatically select the optimal number of key levels, giving you an adaptive way to visualize price zones where activity concentrated over time.
CONCEPTS
Agglomerative cluster

Smart Swing HH - LL Indikator ini dirancang untuk mendeteksi Swing High (HH) dan Swing Low (LL) secara cepat dan akurat pada grafik harga. Deteksi dilakukan berdasarkan analisa range ATR adaptif, konfirmasi pola candlestick (seperti pin bar dan engulfing), serta opsi tambahan menggunakan Fractal untuk validasi. Fitur utama: Deteksi otomatis titik Swing High dan Swing Low menggunakan ATR dan price action. Penyesuaian sensitivitas deteksi berdasarkan ATR multiplier dan range bar . Notifikasi real-

ICT Silver Bullet Indicator is designed to make trading the Silver Bullet strategy easier and more efficient. It combines all key parts of the ICT Silver Bullet method and highlights them on the chart, so you can focus on placing trades. Each feature is highly customizable, allowing you to adjust settings and visuals to match your trading style and preferences. The control panel lets you quickly hide or show specific tools for clearer analysis. The indicator also includes an alert system that n

Ritz Smart Support & Resistance Zones
Market Structure Based S/RT
his advanced indicator detects and displays high-probability support and resistance zones based on actual market structure (swing highs and lows). Using intelligent zone merging and ATR-based fuzz buffers, it ensures the zone blocks are aligned with real price extremes without gaps. Zones are classified by strength (Proven, Verified, Untested, Turncoat, Weak) and visually rendered using colored rectangles. Ideal for traders seeki
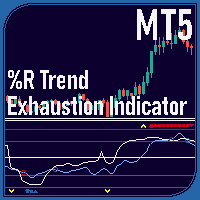
Overview The %R Trend Exhaustion Indicator is a versatile technical analysis tool for MetaTrader 5, adapted from a popular TradingView indicator. It is designed to help traders identify trend exhaustion points, potential reversals, and trend continuation signals across various market conditions. The indicator offers multiple display modes and customizable settings to suit different trading strategies, enhanced with additional features to improve its functionality in the MetaTrader 5 environment.

Double Fractal Entry generates precise entry signals based on smart fractal breakouts or rebounds. It visualizes market structure with dynamic channels and plots clear SL/TP levels. A powerful tool for trend and reversal traders. This product is also available for MetaTrader 4 => https://www.mql5.com/en/market/product/143602 The indicator generates entry points based on two configurable strategies: Fractal Breakout – when price breaks the last key fractal; Fractal Rebound – when price bounces

العربية ### الميزات الرئيسية للمؤشر المُجمّع:
1. **نظام زوايا جان**:
- يرسم خطوط الاتجاه من نقطة بداية بزوايا مختلفة (45 درجة، 90 درجة، إلخ.)
- يتضمن إشارات دخول وتنبيهات لمستويات الأسعار
- يعرض نقاط الارتكاز، ومستويات فيبوناتشي، ونقاط التأرجح
2. **نظام مربع التسعة**:
- يُنشئ مستويات دعم/مقاومة أفقية بناءً على مربعات الأسعار
- مستويات مُرمّزة بالألوان حسب الأهمية الزاوية (0 درجة، 45 درجة، 90 درجة، إلخ.)
- نظام تنبيه قابل للتخصيص لمستويات اللمس
3. **واجهة موحدة**:
- مُعاملات إدخال مُنظّمة

Watermark – Marca D'Água para MetaTrader 5 O Watermark é um indicador visual elegante e funcional projetado para exibir uma marca d'água centralizada no gráfico do MetaTrader 5. Ele mostra automaticamente: Símbolo atual (ex: EURUSD) Timeframe ativo (ex: H1) Nome completo do ativo (opcional) Ideal para traders que desejam personalizar visualmente seus gráficos com informações importantes, mantendo o espaço de negociação organizado e informativo. Principais Recursos: Marca d'água centralizada At
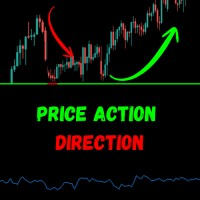
Smart trend detection meets real-time precision. One tool, multiple confirmations. The Price Action Trend Direction is a powerful, no-nonsense MetaTrader 5 indicator that combines dynamic trend logic with enhanced visual clarity and mobile alerts. Whether you're a scalper or swing trader, this tool is built to give you a clean, noise-free read of market direction and trend strength. Features & Benefits Price Action Slope Analysis
Accurately reads price momentum using EMA slope to detect t

MTF SuperTrend Confluence: Precision Trend Analysis Across Multiple Timeframes Tired of conflicting signals and market noise on a single timeframe? Gain a decisive trading edge by seeing the bigger picture. The MTF SuperTrend Confluence indicator is your all-in-one solution for high-probability trend analysis, meticulously engineered to filter out uncertainty and pinpoint powerful market movements. This powerful tool plots up to three fully customizable SuperTrend indicators from different timef
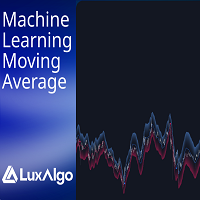
The Machine Learning Moving Average (MLMA) is a responsive moving average making use of the weighting function obtained Gaussian Process Regression method. Characteristic such as responsiveness and smoothness can be adjusted by the user from the settings.
The moving average also includes bands, used to highlight possible reversals.
USAGE Figure 2 The Machine Learning Moving Average smooths out noisy variations from the price, directly estimating the underlying trend in the price.

Advanced FVG & Order Block Detection System Transform Your Trading with Professional-Grade Market Structure Analysis What You Get: Three Powerful Trading Concepts in One Ultimate Indicator Fair Value Gaps (FVG) Detection: Automatically identifies price inefficiencies in the market Highlights areas where institutional traders may return to fill gaps Visual color-coded zones Real-time detection across any timeframe Order Block Identification: ️ Sophisticated algorithm detects instit
Pixel Minimalist Screener — Trade Smarter, Not Harder Clarity matters. In fast-moving markets, having a clean and focused workspace can make all the difference. The Pixel Minimalist Screener is built for traders who value precision, simplicity, and actionable information — all in one place. Key Features Multi-Timeframe Support
Monitor up to three customizable timeframes on a single screen. Whether you’re scalping, swing trading, or position trading, this screener helps you align with the b

The Trend Impulse Channels indicator is an advanced technical analysis tool that creates dynamic trend channels based on price impulses and volatility. It combines ATR (Average True Range) with adaptive algorithms to generate precise trend detection signals. Key Features: Adaptive Trend Line : Follows price with intelligent steps based on volatility Dynamic Channels : Upper and lower bands automatically adjust to market conditions Retest Signals : Triangle markers show important support/resistan
Important Reminder: If you find this tool helpful , please support the work by leaving a comment or rating .
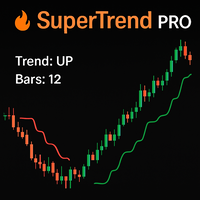
Avoid using it without showing support. Your feedback motivates further development! Trend Vision - SuperTrend PRO Take your trading to the next level with a powerful upgrade to one of the market’s most trusted trend-following indicators! SuperTrend PRO has been optimized to deliver precise signals based on the strength of the ATR, with smart alerts sent instantly to your phone wh
Opening Range Detection – Detects the opening range based on a configurable time period
Breakout Signals – Displays signals on breakouts of the OR levels
Targets – Calculates and shows target levels based on a percentage of the OR width
Daily Bias – Considers the daily trend for signal filtering
Moving Average – Optionally displays moving averages Important Adjustments for MQL5 :
Visualization : Line plots for ORH, ORL, and ORM (Opening Range High/Low/Middle) Graphical objects for targets, signa
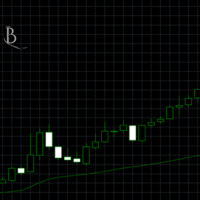
Indicator: VWAP Volume Weighted Average Price Platform: MetaTrader 5
Type: Custom Indicator
Display: Chart Window (Overlay) Functions: Calculates the Volume Weighted Average Price (VWAP) per trading day. Continuous VWAP calculation using the average of Open and Close prices and tick volume. Automatic reset of the VWAP calculation at the start of each new day. Limits data usage via the BufferSize parameter (number of candles stored in a circular buffer). Calculates the trend (slope) of the VWAP o

Periodic Volume Profile Platform: MetaTrader 5
Type: Custom Indicator
Display: Chart Window (Overlay) Functions: Calculates Point of Control (POC) , Value Area High (VAH) , and Value Area Low (VAL) continuously over a rolling buffer of candles. Uses tick volume and close price to update volume distribution in real-time. Keeps a fixed-length circular buffer ( CleanUpAfter ) to remove old price-volume data. Automatically adjusts the volume profile range if price moves outside the current bounds. V
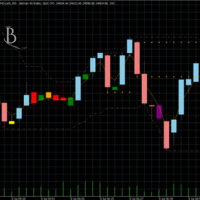
Key Candlepatterns Platform: MetaTrader 5
Type: Custom Indicator
Display: Chart Window (Candlestick Overlay) Functions: Detects and color-codes specific candlestick patterns based on candle shape, relative position, and ATR filters. Candles receive distinct colors depending on type (e.g. inside bar, outside bar, engulfing, hammer, shooting star, etc.). Visual patterns can help traders identify where buyers or sellers are likely active . Turning points (e.g., hammer followed by confirmation) are
"Blow It Up!" – The Trading Indicator That Questions Your Life Choices Tired of boring indicators? Meet your new market companion that delivers: "YOLO BUY!" arrows when you should probably panic
Explosive rectangle confetti (because why not?)
200+ soul-crushing quotes like "Your stop loss is imaginary" and "This isn’t trading, it’s donating to whales"
Random alerts that roast your strategy This Indicator is like Therapy – Because daytrading shouldn’t feel

Key Features:
Accurate Buy/Sell Signals (Blue = Buy, Red = Sell)
Advanced SSL Algorithm – Based on dynamic moving average crossovers
Visual Arrows + Colored Dot and Lines for quick decision making
Multi-timeframe compatibility – Works from 1M to Daily
No Repaint, No Delay – Reliable signals in real-time Enter the candle after Dot. Highly optimized & lightweight code for fast execution
Perfect For:
Scalping (1M–5M)
Intraday traders (15M–1H)
Swing trading (4H–D1)
Begin

Trend Hunter Beast MT5 Indicator Easy to follow the overall trend by looking at a higher timeframe. Simple entry when the arrow appears. Exits are made on the opposite arrow, or you can place a stop loss below the last low or high, and a stop loss as desired.
Applies to any Forex asset, although it is recommended to use pairs with low spreads.
You can also use it on crypto assets or indices such as the SP500, etc.
Check the trend on higher timeframes such as D1 and H1, and enter in the same d
The indicator to trade price consolidation is designed to identify price contraction and alerts us on formation. It does this by analyzing historical price data and identifying price action patterns. The algorithm then uses this information to mark the zone , potential targets and liquidity lines, giving us valuable insights into market behavior. Traders can adjust parameters such as colors ,alerts types and how many previously formed zones to display on chart . Furthermore, the indicator can
BBMA Indicator – Precision Trading Made Simple Experience powerful technical analysis trusted by traders worldwide. The BBMA Indicator combines two of the most effective concepts in trading: Bollinger Bands and Moving Averages . Through integrated algorithms, this indicator helps you identify: Optimal Entry & Exit Points → Spot precise trading opportunities based on price movement.
Trend Confirmation → Easily determine if the market is trending or ranging.
Potential Reversals → Receive ear
CycleTrackSwingPro for MetaTrader 5 ️ PLEASE CAREFULLY REVIEW THE ATTACHED IMAGE BEFORE READING THE DETAILED INFORMATION BELOW. I. General Overview The majority of losses in trading setups originate from a lack of understanding of the market’s CONTEXT and its latent ENERGY . CycleTrackSwingPro has been meticulously engineered with a robust FRAMEWORK to address these critical gaps. It aligns trading decisions with key categorical frameworks such as: Short-Term vs. Long-Term behavior Sharp Jerks

PEX ARROWS - PROFESSIONAL TRADING SIGNALS INDICATOR
GENERAL DESCRIPTION
Apex Arrows is a powerful technical indicator specifically designed for MetaTrader 5 that provides clear and reliable trading signals through visual arrow markers on your chart. The indicator combines multiple technical analysis components including trend analysis, momentum assessment, and volatility measurement to generate high-probability trading opportunities.
CORE FEATURES
Signal Generation - Buy signals displayed w
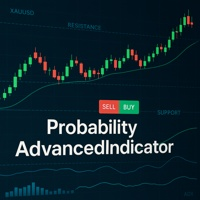
The ProbabilityAdvancedIndicator is a sophisticated trend probability analysis tool designed for scalping and day trading. It combines multiple technical indicators and multi-timeframe analysis to generate clear visual signals for buy/sell probabilities. The ProbabilityAdvancedIndicator is a comprehensive tool for traders looking for: Probability-based decision-making Consolidated technical analysis Flexibility for different trading styles Intuitive and customizable interface Pro Tip:
Oscillator Alerts MultiPanel All oscillator signals — in a single panel!
A professional multi-panel tool for market control, based on major oscillators with a flexible alert system and unique interactive management features. Description Oscillator Alerts MultiPanel is an innovative tool for traders that brings together multi-symbol and multi-timeframe analysis, flexible notifications, and the most convenient interactive control — all right on your chart. Key Advantages Interactive Oscillator Se

Zephir Power Indicator v1.30 — Breakout Signal & Statistics Tool for MetaTrader 5
Full strategy Guide on purchase - Trader with track record and 8 years of experience EXTRA COPY FOR TRADING VIEW FOR THIS INDICATOR
Zephir Power Indicator v1.30 is a high-performance breakout detection tool for MT5 that identifies precise bullish and bearish entry points based on candle body breakouts, ATR filters, and optional trend confirmation. Designed for professional traders, this indicator visuall
Trader Dynamic Index_Pro Signal Added
An enhanced version of the Traders Dynamic Index indicator with context-aware signal integration, multi-layer confirmation, and market rhythm alignment. Designed for professional use in both manual trading and Expert Advisor systems. YOU WILL FIND IT HARD TO IGNORE THIS INDICATOR — IT OUTPERFORMS MOST CURRENT OSCILLATORS WITH CONTEXTUAL ANALYSIS, TREND DETECTION, DYNAMIC OSCILLATION RANGES, DIVERGENCE IDENTIFICATION, AND ESPECIALLY THE INTEGRATION OF MARKE
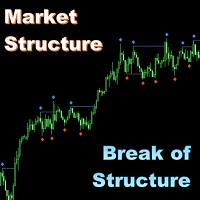
Market Structure - Break of Structure (MS-BOS) for MT5 Added simple dashboard in the right center of the chart - indicating direction of last cancelled BOS level for main set of Timeframes. This panel can be switched off in parameters
All my indicators work only at closed bars, they do not repaint any values (if it is not otherwise mentioned in the description). So that they are fully compatible with autotrading, and are ready for making qualitative technical analysis. Market Structure - Bre
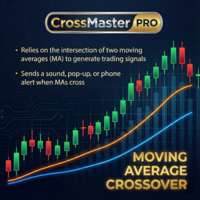
CrossMaster PRO – Where Trends Reveal Themselves CrossMaster PRO is a precision-built indicator designed to identify critical moments where market direction begins to shift. By monitoring the interaction between two moving averages, it delivers clear signals exactly when timing matters most. Built for traders who value clarity over noise, this tool transforms simple crossovers into actionable insights, supported by intelligent alerts and a clean visual structure. Core Advantages Real-time detec

### EMA Oscillator Analysis **Working Principle:** 1. **Main Line Calculation (BufferV):** - Computes price deviation from adaptive EMA. - Formula: `BufferV[i] = Close[i] - (alpha * Close[i] + (1-alpha) * BufferV[i-1])` - Where `alpha = 2/(ema_period+1)`.
2. **Volatility Bands:** - `BufferDev`/`BufferNegDev`: ±1 standard deviation. - `BufferDevLimit`/`BufferNegDevLimit`: ±2 standard deviations (multiplied by `limit_factor`). - Standard deviation is calculate
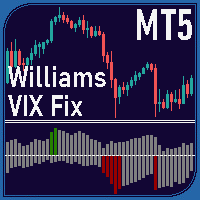
Overview The Williams VIX Fix Indicator is a MetaTrader 5 tool designed to help traders identify potential market tops and bottoms. By analyzing price extremes relative to recent highs and lows, it highlights overbought and oversold conditions using two histograms displayed in a separate window. The indicator combines the Williams VIX Fix calculation with Bollinger Bands and percentile-based thresholds to provide clear signals for potential reversals. Key Features Market Tops and Bottoms Market

Mantis Shrimp Convergence (MSC) A new way to see market momentum — no lag, no confusion.
What is MSC? Mantis Shrimp Convergence (MSC) is a powerful non-repainting oscillator, inspired by the logic of MACD but rebuilt for modern trading: zero lag, no false divergences, and dual-line precision. Designed for traders who demand clarity, speed, and reliability, MSC reveals momentum shifts with unmatched visual and structural accuracy.
How it Works MSC uses two signal lines — Fast and Slow,
ICONIC TRENDLINE for MetaTrader 5 Title: ICONIC TRENDLINE: Advanced Trend Indicator with MTF Panel & Alerts Short Description Tired of identifying trends too late and getting tricked by false signals in sideways markets? The ICONIC TRENDLINE indicator for MT5 is your solution. This advanced tool combines intelligent EMA logic with the power of the ADX to provide you with clear, early, and filtered trend signals. With a dynamic trendline, a multi-timeframe dashboard, and instant push notificatio
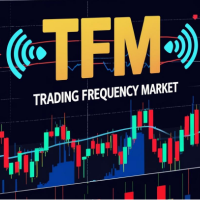
Trend Frequency Market MT5 Carry out analysis and backtest even before opening your orders, check the strategy's Winrate and stay in favor of the Trend and the strength of the movement.
The TFM indicator is specialized in providing you with the strength points of the movement, painting the candles GREEN or RED to report price aggression from the Players who are acting at the exact moment. Taking advantage of this detection, the indicator plots Arrow and Entry, Stop Loss and Take Profit levels

Multi-Timeframe Time Gap Analysis v4.00 Professional Multi-Timeframe Time Gap Detection Indicator PRODUCT DESCRIPTION Multi-Timeframe Time Gap Analysis is a revolutionary indicator for MetaTrader 5 that combines Time Gap analysis across multiple timeframes simultaneously. Based on Smart Money concepts and designed for professional traders who need comprehensive multi-timeframe market structure analysis. MULTI-TIMEFRAME TIME GAP CONCEPT Multi-TF Time Gap is a price zone where price spent mi

True Volume: See the Story Behind the Price
Recommended Experience Level: Intermediate to Advanced True Volume is not just another histogram; it is a forensic analysis engine for price action. While standard volume indicators only tell you how much was traded, True Volume tells you who traded it and who won . By combining Geometric Decomposition , VSA (Volume Spread Analysis) , and Anomaly Detection , this indicator dissects every bar to reveal the hidden battle between Bulls
Multi-Timeframe Moving Average Indicator Unlock a deeper understanding of market trends with the Multi-Timeframe Moving Average Indicator. This powerful MQL5 tool allows you to visualize moving averages from five different timeframes simultaneously on a single chart. Gain comprehensive insights into price dynamics across various perspectives without cluttering your workspace with multiple indicator instances. Key Features: Multi-Timeframe Analysis: Display up to five moving averages from differ
Multi-Timeframe RSI Indicator Unleash the Power of Multi-Timeframe Analysis with Our Intuitive RSI Indicator! Gain a comprehensive perspective on market momentum across various timeframes, all on a single chart. Our Multi-Timeframe RSI Indicator allows you to track the Relative Strength Index (RSI) with a consistent period across five customizable timeframes, empowering you to make more informed trading decisions. Key Features: Simultaneous Multi-Timeframe View: Monitor RSI for up to five differ
Dynamic Multi-Period S/R Indicator The Dynamic Multi-Period S/R is an advanced MetaTrader 5 indicator designed to automatically identify and display key Support and Resistance (S/R) levels across multiple timeframes directly on your chart. Unlike static indicators, this tool dynamically adjusts, providing you with relevant and up-to-date S/R zones from Hourly (H1), Daily (D1), and Weekly (W1) charts. This indicator goes beyond simple high/low analysis by incorporating Fractal patterns to refine

INDICATOR: GEN Smart Zone Developer: gedeegi General Description GEN Smart Zone is a MetaTrader 5 (MT5) indicator designed to automatically identify and visualize strong Support and Resistance (S/R) levels . It analyzes price movements on a higher timeframe to find significant S/R zones and then projects them onto the current chart. Its purpose is to provide traders with clear visual guidance on key areas that can be used for decision-making. Key Features Automatic S/R Zone Identification: The i

GoGo Breaker – The Master Candle Signal Smart Signals Based on Price Action with Advanced Filters GoGo Breaker is a powerful trading indicator that uses the "Master Candle" pattern to identify high-probability opportunities in real-time. Designed for traders seeking fast and precise entries , it is ideal for scalping, intraday, and swing trading . Automatically detects buy/sell signals with clear arrows. Works in all markets: Forex, indices, commodities, and cryptocurrencies. Flexible: Can be us
The MetaTrader Market is the only store where you can download a free demo trading robot for testing and optimization using historical data.
Read the application overview and reviews from other customers, download it right to your terminal and test a trading robot before you buy. Only on the MetaTrader Market you can test an application absolutely free of charge.
You are missing trading opportunities:
- Free trading apps
- Over 8,000 signals for copying
- Economic news for exploring financial markets
Registration
Log in
If you do not have an account, please register
Allow the use of cookies to log in to the MQL5.com website.
Please enable the necessary setting in your browser, otherwise you will not be able to log in.