Watch the Market tutorial videos on YouTube
How to buy а trading robot or an indicator
Run your EA on
virtual hosting
virtual hosting
Test аn indicator/trading robot before buying
Want to earn in the Market?
How to present a product for a sell-through
Technical Indicators for MetaTrader 5 - 4

The Moving Average Convergence Divergence (MACD) trading strategy is a popular technical analysis tool that is used to identify changes in momentum and trend direction. The MACD is calculated by subtracting the 26-period exponential moving average (EMA) from the 12-period EMA. A 9-period EMA, called the "signal line," is then plotted on top of the MACD to act as a trigger for buy and sell signals.
The MACD is considered to be in bullish territory when the MACD line is above the signal line and
FREE

Seconds Chart For MetaTrader 5 The Indicators allows you to create charts in the MetaTrader 5 terminal with a timeframe in seconds. The timeframe on such a chart is set in seconds, not in minutes or hours. Thus, you can create charts with a timeframe less than M1. For example, S15 is a timeframe with a period of 15 seconds. You can apply indicators, Expert Advisors and scripts to the resulting chart. You get a fully functional chart on which you can work just as well as on a regular chart. The t

The KT HalfTrend is a moving average-based trend indicator that draws zones. It marks a trend shift by drawing bearish and bullish invalidation zones on the chart. It also displays the trend buy-sell strength with arrows on the main chart. The indicator will be flat if no trend indicates accumulation, temporary price, or distribution zones. If there is a trend, there will be a slope in that direction. The trend signals are substantial if the slope is steep, either to the upside or the downside.

AI Forecasts MT5 Indicator: Future Prediction System with Artificial Intelligence and Deep Learning (AI + ML) _ Main Features: - Future vision up to 20 candles ahead based on dynamic data analysis - Suitable for scalping trading
-Multi-colored prediction charts reflecting confidence levels in forecasts with white pip counter next to current Buy/Sell status -Probability zones showing expected price paths with margin of probability changes and direction -Multi-variable analysis primarily based

PUMPING STATION – Your Personal All-inclusive strategy
Introducing PUMPING STATION — a revolutionary Forex indicator that will transform your trading into an exciting and effective activity! This indicator is not just an assistant but a full-fledged trading system with powerful algorithms that will help you start trading more stable! When you purchase this product, you also get FOR FREE: Exclusive Set Files: For automatic setup and maximum performance. Step-by-step video manual: Learn how to tr

MTF Trend Detector can detect the trend directions on any timeframe with real time sound and Pop-up alert when the trend changes its direction.
It needs a lot of historical data. When it's attached to a chart at the first time, you may need to way 2-3 minutes and refresh the chart to get all the trend directions on the table. It can be used in isolation or as a reliable filter of any trading system.
Input Parameters
Timeframe settings
Enable H1: Select true or false
Enable H2: Select true
FREE

Order Flow Pro: Synthetic Order Flow & Footprint Analysis Order Flow Pro is a comprehensive analysis suite designed to synthesize professional-grade Order Flow metrics using standard broker Tick Data. It combines Footprint Charts, Volume Profile, CVD, and VWAP into a single optimized indicator without requiring Level 2 data feeds. This tool allows scalpers and day traders to analyze aggressive buying/selling pressure, potential reversals, and market imbalances in real-time based on technical da
Indicator of time until the end of the candle. Shows the time until the end of the candle, as well as the server time. Text can display the trend or direction of the candle, sound notifications are built in Peculiarities:
Displays the time until the end of the current candle as well as other timeframes that can be adjusted or disabled if necessary AW Candle Time can select the direction of the current candle or trend with the AW Super Trend indicator The trend strategy is highlighted in the sele
FREE

Capture every opportunity: your go-to indicator for profitable trend trading Trend Trading is an indicator designed to profit as much as possible from trends taking place in the market, by timing pullbacks and breakouts. It finds trading opportunities by analyzing what the price is doing during established trends. [ Installation Guide | Update Guide | Troubleshooting | FAQ | All Products ]
Trade financial markets with confidence and efficiency Profit from established trends without getting whip
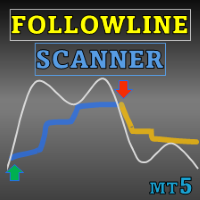
Special offer : ALL TOOLS , just $35 each! New tools will be $30 for the first week or the first 3 purchases ! Trading Tools Channel on MQL5 : Join my MQL5 channel to update the latest news from me Maximize your trading edge with Follow Line MT5 with Scanner, an advanced volatility-based indicator designed for serious traders. This tool combines the power of Bollinger Bands with customizable settings, offering precise insights into price movements. See more MT4 version at: Follow
FREE

Multi timeframe ZigZag indicator. It displays the support/resistance horizontal lines and their breakouts, as well as draws the current targets of the market. It can also display lines of the Fractals indicator and candles from other periods (up to Quarterly). So, you can actually see the supply and demand levels. Indicator – connects key lows and highs to show trend lines. You can also use it as indicator for the Break of Structure(BOS) & Market Structure Shift(MSS). The indicator redraws the
CLICK HERE TO SEE ALL MY FREE PRODUCTS
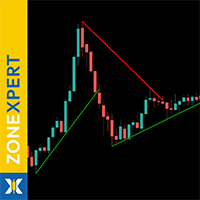
ZoneXpert is your visual market analyst for MetaTrader 5 - developed to automatically detect Support and Resistance zones , highlight them visually, and update them in real time. The indicator analyzes price structures, highs, lows and volume areas to show you exactly where the market reacts - and where it breaks through. With ZoneXpert you instantly see where market forces accumulate - and you trade where real decisions are made, not where randomness rul
FREE
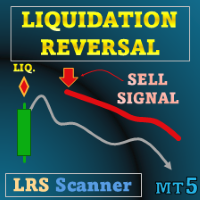
Special offer : ALL TOOLS , just $35 each! New tools will be $30 for the first week or the first 3 purchases ! Trading Tools Channel on MQL5 : Join my MQL5 channel to update the latest news from me Liquidation Reversal Signals is an indicator designed to mark directional liquidation phases and confirm reversal points by combining Z-score volume extremes with Supertrend state changes. Instead of printing an arrow whenever a trend simply “changes color,” this tool s

Introducing our exciting new Price Retest indicator! Get instant alerts when the price retests, giving you a powerful edge in your trading strategy. Remember to do your own analysis before making any moves in the market. MT4 Version - https://www.mql5.com/en/market/product/118031 Join To Learn Market Depth - https://www.mql5.com/en/channels/suvashishfx
Here’s a detailed explanation of how the Price Retest indicator works, its components, and how you can incorporate it into your trading strat
FREE

Forex Strategist is a powerful trading sustem for EURPLN H4 Timeframe only. We'll add more logic to trade more currency pairs gradually. Input Parameters:
Line setting:
Line Style: Default is Solid
Buy Color: Default is White
Sell Color: Default is White
Stop Loss Color: Default is White
Target Color: Default is Gold Panel Setting:
Corner: Default is Let upper chart corner
X Panel: Default is 10
Y Panel: Default is 20
BackGround1: Default is DarkBlue
BackGround 2: Default is 47,47,47
Text C
FREE

The "Haven Key Levels PDH PDL" indicator helps traders visualize key levels on the chart. It automatically marks the following levels: DO (Daily Open) — the daily open level. NYM (New York Midnight) — the New York midnight level. PDH (Previous Day High) — the previous day's high. PDL (Previous Day Low) — the previous day's low. WO (Weekly Open) — the weekly open level. MO (Monthly Open) — the monthly open level. PWH (Previous Week High) — the previous week's high. PWL (Previou
FREE

LIMITED TIME SALE - 30% OFF!
WAS $50 - NOW JUST $35! Profit from market structure changes as price reverses and pulls back. The market structure reversal alert indicator identifies when a trend or price move is approaching exhaustion and ready to reverse. It alerts you to changes in market structure which typically occur when a reversal or major pullback are about to happen. The indicator identifies breakouts and price momentum initially, every time a new high or low is formed near a po
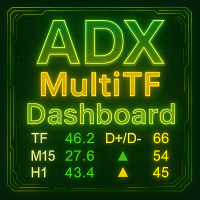
ADX MultiTF Dashboard Overview ADX MultiTF Dashboard is a multi-timeframe indicator that displays key information about trend strength and direction simultaneously across three selected timeframes. The indicator presents data in a compact dashboard format, showing ADX values, directional movement indicators, and RSI readings for comprehensive market analysis. The dashboard provides critical information for trading decisions including trend strength measured by ADX, trend direction determined by
FREE

=== What is Scalper Hunting? === Scalper Hunting is an MT5 indicator that automatically generates trading signals by combining overall market conditions with multiple technical indicators.
By stacking several indicators and applying multiple filters, it focuses on high-potential setups only , helping you trade with more clarity and less noise. It is designed not for a single lucky trade, but to support a long-term, sustainable approach , helping traders stay in the market longer with a structur

Expert Advisor Version
If you prefer automated trading instead of manual signals, you can find the Expert Advisor version of this indicator here:
https://www.mql5.com/en/market/product/148222
This indicator computes price reentry moments after a candle has pierced outside the Bollinger Bands , combining that signal with an RSI confirmation to reduce false positives.
A Buy ReEntry signal is detected when price had moved below the lower band and then returns inside, with the optional confirmati
FREE
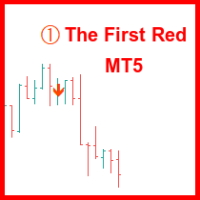
1. Introduction The “First Red” Indicator is a tool designed to pinpoint dynamic market turning points by combining local price extremes with signals from the MACD (Moving Average Convergence Divergence) oscillator. Based on Dariusz Dargo’s original concept, it marks specific candles on your chart that meet the conditions of the “First Red” setup or its related variants—“Second Red,” “First Green,” and “Second Green.” These classifications let traders see at a glance when momentum may be shifti

This indicator automatically identifies market structure and plots Fibonacci retracement levels in real time.
It detects key swing highs and lows to mark structural points such as higher highs, higher lows, lower highs, and lower lows, helping traders quickly understand trend direction and structural shifts.
Based on the detected structure, the indicator dynamically draws Fibonacci levels, allowing traders to easily spot potential retracement, pullback, and entry zones without manual drawing.

RSI divergence indicator finds divergences between price chart and RSI indicator and informs you with alerts (popup, mobile notification or email). Its main use is to find trend reversals in the chart. Always use the divergence indicators with other technical assets like support resistance zones, candlestick patterns and price action to have a higher possibility to find trend reversals. Three confirmation type for RSI divergences: RSI line cross 50 level Price returns to previous H/L C
FREE
Nadaraya Watson Envelope Multicurrency Scanner MT5 provides a streamlined way to monitor crucial reversal signals across multiple currency pairs and timeframes. Built on the popular TradingView indicator known for its accurate reversal calls, this scanner adapts the same core logic into an MT5-friendly format. It focuses on short-term opportunities in lower timeframes and strong trend signals in higher ones, helping traders stay alert to market turns. You can find the MT4 version here: Nadaraya
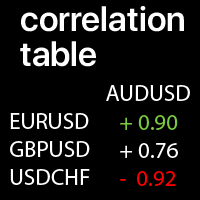
Correlation values between the selected Symbols: compare the current market trends A value of +1: means a complete positive correlation; A value of -1: means a complete inverse correlation; A value of 0: means there is no explicit correlation (prices do not depend on each other, or the correlation is random ); My #1 Utility : 66+ features | Contact me for any questions | MT4 version Each Symbol can be customized: removed / replaced. You can add up to 10 Symbols per Row / Co
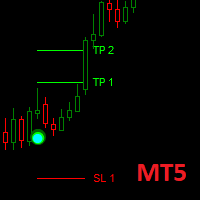
Dark Point is an Indicator for intraday trading. This Indicator is based on Trend Following strategy, also adopting the use of the atr to determine the right volatility. We can enter in good price with this Indicator, in order to follow the strong trend on the current instrument. If you love Dark Point, consider adding some power: Dark Power
Key benefits
Easily visible take profit/stop loss lines Intuitive directional points/arrows by colors Useful statistics , which indicate the wi
FREE
Advanced UT BOT ALERTS for MT5 Professional Multi-Filter Trend Detection System | Enhanced UT BOT Engine We only provide high-quality indicators. Advanced UT BOT is built for professional use, featuring a stable signal logic and secure calculation process that prevents any delays or false updates.
It does not repaint, redraw, remove, or modify past signals in any way.
All BUY and SELL signals are generated only after the candle has closed , ensuring consistent accuracy and reliability.
There is

MT4 version | Owl Smart Levels Indicator | Owl Smart Levels Strategy | FAQ
The Fractals Indicator is one of the elements of the author's trading strategy of Bill Williams . It is used to search for price reversal points on the price chart and, consequently, support and resistance levels. The Full Fractals Indicator is an improved Fractals which is available in the toolkit of almost all trading terminals. Its only difference is that to build a fractal we use 5 candles to the left
FREE

[ My Channel ] , [ My Products ]
This indicator shows the points where the bar’s trend changes due to an instant pressure while the overall trend is moving upward or downward. The arrow displayed by the indicator is drawn if the previous bar meets certain criteria. When building your strategy, you can interpret 3-4 consecutive arrows as a potential breakout signal. For example, when you see the 4th arrow, you may consider opening a trade. This provides a reliable tool to anticipate significant
FREE

Looking for MT4 version? The MACD Histogram Indicator is an enhanced version of the traditional MACD indicator, offering superior insights into market trends and momentum shifts. Unlike the default MACD in MT5, this version features a histogram , making it easier for traders to visualize and interpret market conditions. Advantages over the default MACD indicator: Enhanced Visuals: The histogram provides a bar chart representation of the difference between the MACD line and the signal line, mak

Crystal Volume Indicator – Smart Volume Analysis Tool for MT5 Overview
MT4 Version:- https://www.mql5.com/en/market/product/152098
Crystal Volume Indicator is an advanced yet user-friendly volume analysis tool for MetaTrader 5. It helps traders understand the hidden market dynamics behind price movement by combining price action with volume behavior. The indicator highlights critical events such as Buying Climax, Selling Climax, and Weak Candles, allowing traders to identify potential reversa
FREE

Sniper Delta Imbalance is a professional tool for deep delta analysis — the difference between buyer and seller volumes. It takes volume analysis to the next level, allowing traders to see in real time who controls the price — buyers or sellers — and to find precise entry points based on the actions of major market participants. This tool represents a unique style of analysis based on the ratio of demand and supply volumes and can be used to detect who holds control over price. At the core of

POC Delta Order Blocks is a rule-based order block and volume-delta indicator designed to help traders clearly understand where real trading activity happened and how price reacts around those zones . Instead of drawing generic candle-based blocks, this indicator uses a Point of Control (POC) approach to identify the most actively traded price level between a swing high/low and a confirmed Break of Structure (BOS). The order block is then anchored to the earliest valid candle that interacted wit

The indicator draws supply and demand zones. The zone timeframe can be set independently of the chart timeframe. For instance, it is possible to set M5 zones on an H4 chart. The importance of zones can be adjusted using the zone strength parameter. Demand zones are displayed if at least one candle in the range of the zone is entirely above the zone. Similarly, supply zones are displayed if at least one candle within the zone is entirely below the zone.

** NOTE: This indicator uses realtime data. Thus DO NOT download Demo version. If you still need demo version, please refer to trial version . Version for MT4: https://www.mql5.com/en/market/product/123597
Symbol Chart Changer is an indicator/utility that offers you the option to switch between symbols and timeframes.
You can choose any symbol and timeframe on the same chart with just a few clicks. In addition, this indicator also shows the profit of the symbol through the color of the butt
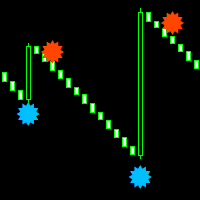
Boom and crash smasher free indicator that works on all timeframe from the one minute to the monthly timeframe. the indicator is 100% non-repaint. the indicator come with sound alerts and email push notification the indicator appears on the current candle stick for faster entries can be used on all charts and renko charts orange dot is your sell signal blue dot is your buy signal
FREE

Did You Have A Profitable Trade But Suddenly Reversed? In a solid strategy, exiting a trade is equally important as entering.
Exit EDGE helps maximize your current trade profit and avoid turning winning trades to losers.
Never Miss An Exit Signal Again
Monitor all pairs and timeframes in just 1 chart www.mql5.com/en/blogs/post/726558
How To Trade You can close your open trades as soon as you receive a signal
Close your Buy orders if you receive an Exit Buy Signal. Close your Sell orders if

Special limited-time offer. Important Note: The image shown in the screenshots includes two indicators: the “Suleiman Levels” indicator and the “RSI Trend V” indicator.
NEW UPDATE v 7.9: A remarkable and special update for Mode #3, which is dedicated to detecting levels. The Suleiman Levels indicator is a professional, advanced, and integrated analysis tool. With nearly 9,800 lines of code, it makes your analysis charts clearer than ever before. It is not just an indicator. Powerful features o
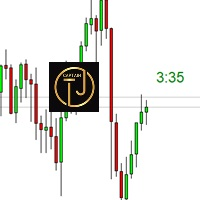
The CTJM Candle Timer Indicator is a robust tool developed for traders who use MetaTrader 5. Designed with precision, it displays the remaining time for the current candle on a trading chart, enabling traders to monitor the market more effectively and make timely decisions. With a customizable visual interface, users can adjust colors, font sizes, and positioning to suit their preferences. Some key features of this indicator include: Real-Time Candle Countdown: Keeps traders informed of the exa
FREE

SHOGUN Trade - 16年間の最適化されなかった衝撃的な真実。
将軍取引2月特別セール – たったの99ドル(通常価格は249ドル)! この特別オファーは 2月28 日まで 利用可能です。 さらなる製品開発と最適化 に取り組 むため、貴重なフィードバックと引き換えにこの割引を提供いたします。皆様の洞察は、次回のアップデートや機能強化に直接影響します。 価格: 99ドル(特別割引199ドルから) 要件: レビューを残し、あなたの体験を共有してください。 私たちの目標: 皆様のフィードバックを 活用して積極的な製品開発 を行い 、取引に最適なツールを提供することを確実にします。 SHOGUN TRADE PRO v3.82 ~ 騒音を切り裂いて。「司令官の目」を極めろ。究極のダウ理論市場構造スイート。~ MT4版はこちらをクリックしてください https://www.mql5.com/en/market/product/158467
1. はじめに:なぜほとんどのトレーダーは「森」で迷子になるのか? 1分チャートの雑音に常に振り回されて、感情的なエントリーで損をしていません

The Super Arrow Indicator provides non-repainting buy and sell signals with exceptional accuracy. Key Features No repainting – confirmed signals remain fixed Clear visual arrows: green for buy, red for sell Real-time alerts via pop-up, sound, and optional email Clean chart view with no unnecessary clutter Works on all markets: Forex, gold, oil, indices, crypto Adjustable Parameters TimeFrame Default: "current time frame" Function: Sets the time frame for indicator calculation Options: Can

The indicator identifies when a divergence occurs between price and an indicator or oscillator. It identifies both regular and hidden divergences. Combined with your own rules and techniques, this indicator will allow you to create (or enhance) your own powerful system. For higher probability setups I can recommend you to use my Supply Demand indicator and trade only if the divergence occurs inside a zone. Supply zone for bearish div and demand zone for bullish div. The optimal scenario is if it
FREE

The indicator draws trendlines on chart. This indicator has six inputs. User can specify alternative labels for both lines. If multiple instances of the indicator are used, the labels must differ. User can set width and color of the lines and depth which specifies what significant peaks should be used. For example, Depth=10 sets trendlines using the current peaks and valleys that have at least 10 bars to the right and to the left and that have highs/lows less/greater than the peak's high/low. In
FREE

This indicator converted from 5 min Buy and Sell Range Filter - guikroth version on TradingView Popularity of the Range Filter
The Range Filter is a very popular and effective indicator in its own right, with adjustments to the few simple settings it is possible to use the Range Filter for helping filter price movement, whether helping to determine trend direction or ranges, to timing breakout or even reversal entries. Its practical versatility makes it ideal for integrating it's signals into a
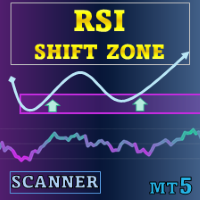
Special offer : ALL TOOLS , just $35 each! New tools will be $30 for the first week or the first 3 purchases ! Trading Tools Channel on MQL5 : Join my MQL5 channel to update the latest news from me RSI Shift Zone Scanner identifies moments when market sentiment may change by linking RSI signals with price action. Whenever the RSI moves above or below preset levels (default 70 for overbought, 30 for oversold), the indicator draws a channel directly on the chart. These channels mark

BUY and SELL smart The BUY and SELL Smart Indicator is a next-generation trading tool engineered for precision scalpers, intraday strategists, and professional analysts who demand both speed and clarity in market visualization. It seamlessly integrates smart candle-based analytics, adaptive ATR logic, and real-time economic event awareness — giving you a fully synchronized view of market volatility and momentum. Through an elegant and optimized interface, FlashScalp delivers instant signal fee

Market Structure CHoCH/BOS Indicator for MT5 Overview
The Market Structure CHoCH/BOS (Fractal) indicator identifies key shifts in market direction based on fractal-based structural analysis. It automatically detects Change of Character (CHoCH) and Break of Structure (BOS) signals, two essential concepts in modern price action and Smart Money trading. How It Works
The indicator analyzes swing highs and lows using a fractal algorithm defined by the Length parameter. When price crosses a previous

The indicator is intended for recognition and marking 1-2-3 buy and sell patterns on a chart. The indicator will help a trade to determine the starting and signal fractals, and to specify the possible entry points on all timeframes in МetaTrader 5. Fibonacci lines are drawn on the chart to indicate supposed targets of moving on the basis of the wave theory. The 1-2-3 formations appear to be especially important as divergences (convergences) are formed on price tops and bottoms. The indicator has
FREE

Multicurrency and multitimeframe modification of the indicator Moving Average (MA). On the dashboard you can see the current state of the indicator - breakouts and touches (by price) of the Fast MA and Slow MA, as well as the intersection of the MA lines between each other (moving average crossover) . In the parameters you can specify any desired currencies and timeframes. Also, the indicator can send notifications about the price touching the lines and about their crossing. By clicking on a c
** All Symbols x All Timeframes scan just by pressing scanner button ** *** Contact me to send you instruction and add you in "M W Scanner group" for sharing or seeing experiences with other users. Introduction: Double Top(M) and Double Bottom(W) is a very repetitive common type of price reversal patterns. Double Top resembles M pattern and indicates bearish reversal whereas Double Bottom resembles W pattern and indicates a bullish reversal that they have high win rate. The M W Scanne

The UzFx-Total TP'SL & Timer-MT5 indicator is designed to provide real-time tracking of total Take Profit (TP) and Stop Loss (SL) values across all open and pending trades. Additionally, it includes a candle countdown timer to indicate the remaining time for the current candle to close.
Key Features:
Automatically calculates the total expected profit and loss from all active trades and pending orders.
Displays the remaining time for the current candle to close, helping traders manage entries a
FREE
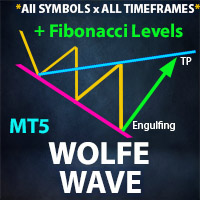
** All Symbols x All Timeframes scan just by pressing scanner button ** *** Contact me to send you instruction and add you in "Wolfe Wave Scanner group" for sharing or seeing experiences with other users.
Introduction: A Wolfe Wave is created with five-wave patterns in price. It shows supply and demand and a fight towards a balance price. T hese waves of price actions can help traders identify the boundaries of the trend . Also It helps forecast how the price will move in the near futur

Trendline Targets Dashboard MT5 Trendline Targets Dashboard MT5 is a MetaTrader 5 indicator that displays a complete visual trading plan: Signal , Entry , Stop Loss , and Take Profits automatically calculated in multiples of R (Risk). It does not place any orders. It is a visual analysis and management tool, not a trading robot. Launch Offer: Each purchase entitles you to 1 free indicator of your choice from my MQL5 profile. Exception: This bonus does not apply to Market Structure Order Block D

OrderFlow Bubbles Pro (OFB-Pro)( Order flow main force large order bubble monitoring indicator ) DEMO version,modleling must choose " Every tick based on real ticks" Peer into the Micro-World of Candlesticks Like an Institutional Trader。[The last two screenshots show scenarios where the Orderflow Smart Flip indicator is used in combination with other indicators.]
important note: on the strategy tester, when testing the indicator use either of the modes below Every Tick Every tick based on re

Gold Finger Buy Sell Arrows - Trend Trading Indicator with Moving Average Filter
Gold Finger is a powerful and versatile trend-following indicator designed for MetaTrader 5 (MT5) that combines the classic buy/sell signal logic with an optional Moving Average (MA) filter for enhanced accuracy. This indicator generates clear Buy and Sell signals with customizable arrow visuals and a robust alert system, including terminal alerts, mobile notifications, and email notifications. Perfect for trader

Advanced Fakeout Detection Indicator Professional Liquidity Sweep & Market Structure Analysis for MetaTrader 5 The Advanced Fakeout Detection Indicator is a sophisticated technical analysis tool designed to identify high-probability market reversal opportunities by detecting liquidity sweeps and structural breaks in price action.
What This Indicator Does This indicator automatically identifies and visualizes potential fakeout scenarios where price temporarily breaks through significant level

Half Trend TPSL Buy Sell Indicator calculates the open and close of the price bars over the selected period of time and applies its own calculation method to find an average line of the price movement. ATR based Take Profit and Stop Loss ATR is a measure of volatility over a specified period of time. The most common length is 14, which is also a common length for oscillators, such as the relative strength index (RSI) and stochastics. A higher ATR indicates a more volatile market, while a lowe

I present an indicator that identifies accumulation zones for buy and sell trades. This indicator is designed to automate complex trading strategies and works well even though it requires real volume, not tick volume, to function perfectly. However, after a little optimization, it shows good results even with this data.
The indicator's operating principle is seemingly simple: it analyzes the structure of movements, corrections, and volume. By analyzing this data, it finds important accumulatio

Full implementation of Directional Movement System for trading, originally developed by Welles Wilder, with modifications to improve profitability, to reduce the number of unfavorable signals, and with Stop Loss lines.
No re-paint
Features
Buy/sell signals displayed on the chart Stop levels visually indicated on the chart Profit-taking points presented in the indicator window Exit points for unfavorable positions presented in the indicator window Signal confirmation through high/low swing cros

Introducing the Adaptive Trend Finder , a cutting-edge Forex indicator that automatically identifies and draws trend lines with pinpoint accuracy. Designed to adapt to changing market conditions, this powerful tool helps traders uncover the most significant trends, enabling them to capitalize on emerging opportunities and confirm the strength of ongoing market movements. The Adaptive Trend Finder uses advanced algorithms to scan the market for pivotal price points, dynamically adjusting trend li
FREE

Gold Venamax - this is a best stock technical indicator. The indicator algorithm analyzes the price movement of an asset and reflects volatility and potential entry zones. Live Signal of manual trading >>> [ Click Here ] Indicator features: This is a super indicator with Magic and two Blocks of trend arrows for comfortable and profitable trading. Red Button for switching blocks is displayed on the chart. Magic is set in the indicator settings, so that you can install the indicator on two chart
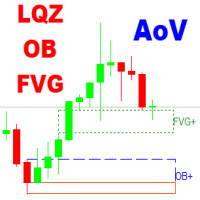
The Area of Value Detection indicator automatically identifies and highlights key institutional price zones, including Liquidity areas, Order Blocks, and Fair Value Gaps (FVG). It is designed to help traders visualize market imbalances and potential points of interest (POIs) used by smart money participants.
Main Features Liquidity Zones: Detects clusters of equal highs/lows and liquidity pools where stop orders are likely accumulated.
Order Blocks: Highlights potential bullish and bearish or
The Interactive RSI indicator can generate RSI divergence with the availability of user defined filters. It can generate voice alerts for RSI oversold and RSI Overbought situations. Moreover it can also generate voice alerts for RSI Divergneces as well as when price breaks above or breaks below the support and resistances created upon divergence ouccurence. The voice alerts are generated in a way that you will know which market has reached the oversold and overbought conditions as well as the r

The official release price is $65 only for the first 10 copies, the next price is $125 Gold Scalper System is a multifunctional trading system that combines a breakout strategy for key liquidity levels with confirmation and a built-in Smart DOM Pro module for market depth analysis. The system identifies zones of limit order accumulation, tracks activity at support and resistance levels, and generates signals at the moment of their breako
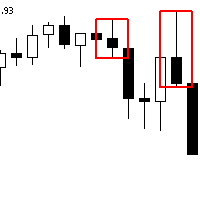
The Advanced Order Block Indicator for MetaTrader 5 is designed to enhance technical analysis by identifying significant order blocks that sweep liquidity and create Fair Value Gaps (FVG) when pushing away. This indicator is ideal for traders who focus on institutional trading concepts and wish to incorporate advanced order flow and price action strategies into their trading routine. Overview Order Block Identification : An order block represents a price area where a substantial number of orders
FREE

Easy Trend , as the name implies, is an indicator that easily shows the prevailing trend by bringing several indicators into one. The strategy is: when all indicators point in the same direction a signal is triggered. When red, is a signal to sell, when blue, signal to buy. It is that simple :) There are a total of 9 indicators: Moving Average, RSI, CCI, Parabolic SAR, William's Range, Stochastic, MACD, ADX and Heiken Ashi. It is possible to configure each of these indicators to suit your way of

Haven Stop Loss Hunter Indicator
Precise tool for analyzing key levels. Developed for traders seeking a deeper understanding of price dynamics and improvement in their trading decisions.
Other products -> HERE Key functions: Helps to quickly find important price extremes.
Identification of potential sweep levels
Identifies moments when the price attempts to break through a level but fails, signaling a possible reversal or trend continuation. Visual display of critical price points
Simplifies
FREE
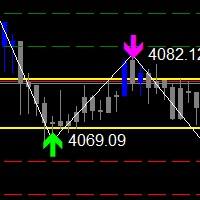
The Zigzag Price Arrow indicator is an enhanced version of the classic Zigzag indicator, combining the traditional zigzag pattern with advanced visual features. It not only identifies major market turning points but also provides clear trading signals through: • Directional arrows: Displays colored arrows (green for buy, magenta for sell) indicating potential trend directions.
• Price labels: Shows the exact price values at each pivot point directly on the chart.
• Improved visual clarity: Make
FREE

Setup Tabajara was created by a Brazilian trader known as "The OGRO of Wall Street" .
The idea of this setup is to indicate to the trader the current trend of prices and the type of operation should be looked for in the graph.
Operation
It does this through the positioning of the closing of the candles and the vwap until 10:40am and after by the arithmetic mean of 20 periods painting the candles in 4 possible colors: Green -> Price rising in upward trend (Search entry points for PURCHASE) B
FREE

This all-in-one trading indicator brings together breakout signals, high and low levels, and a trailing stop with alerts into a single, powerful tool. If you've ever felt overwhelmed by layering too many indicators on your chart, this one simplifies everything while giving you a sharp edge in the markets. It combines three essential elements into a clean, straightforward display that helps you spot entry opportunities, handle risk, and grasp the overall market flow right away. It's especially ha
FREE
Learn how to purchase a trading robot from the MetaTrader Market, the store of application for the MetaTrader platform.
The MQL5.community Payment System supports transactions via PayPal, bank cards and popular payment systems. We strongly recommend that you test the trading robot before buying, for a better customer experience.
You are missing trading opportunities:
- Free trading apps
- Over 8,000 signals for copying
- Economic news for exploring financial markets
Registration
Log in
If you do not have an account, please register
Allow the use of cookies to log in to the MQL5.com website.
Please enable the necessary setting in your browser, otherwise you will not be able to log in.