Watch the Market tutorial videos on YouTube
How to buy а trading robot or an indicator
Run your EA on
virtual hosting
virtual hosting
Test аn indicator/trading robot before buying
Want to earn in the Market?
How to present a product for a sell-through
Technical Indicators for MetaTrader 5 - 43

INDICATOR: GEN TARGET TREND Signal Developer: gedeegi General Description GEN TARGET TREND Signal is an advanced trend-following indicator, designed to identify potential trading signals and provide comprehensive target visualization. This indicator uses a combination of Simple Moving Average (SMA) and Average True Range (ATR) to detect trend changes, then generates clear BUY or SELL signals. This system enhances the trading experience with powerful visualization features, including a real-time

Highlights a specific candle after a designated time interval. This feature is particularly useful for evaluating the potential profitability of breakout strategies that are triggered at specific candle intervals. It allows traders to visually assess whether a breakout strategy, set to activate at a certain candle, would have been successful in past market conditions.
FREE

This indicator draws the high intraday price and the low intraday price of the first n minutes of the day. The chart shows the days with vertical lines and two horizontal lines to indicate the max and the min close price of the n first minutes of the day. The max/min lines start and end with the day calculated. With this indicator you can see how starts the day compared with the previous days. It is valid for any market inasmuch as the start time is calculated with the data received.
Parameter
FREE

GOLD CRASH - Gold Scalping Indicator for M1/M5 Gold Crash is a professional non-repainting scalping indicator specifically designed for XAUUSD trading on M1 and M5 timeframes. Features a modern dashboard with real-time gold trend analysis and precise entry signals. Key Features Non-Repainting - Signals confirmed on bar close only, never change Gold Optimized - Settings fine-tuned specifically for XAUUSD volatility Multi-Timeframe Analysis - M1/M5 with M15 higher timeframe confirmation Smart Fil

Introduction Excessive Momentum Indicator is the momentum indicator to measure the excessive momentum directly from raw price series. Hence, this is an extended price action and pattern trading. Excessive Momentum Indicator was originally developed by Young Ho Seo. This indicator demonstrates the concept of Equilibrium Fractal Wave and Practical Application at the same time. Excessive Momentum detects the market anomaly. Excessive momentum will give us a lot of clue about potential reversal and

The indicator calculates volume profiles dynamically and displays the result as VAL, VAH and POC curves.
Indicator features The indicator uses the historical data of the lower (relative to the current) timeframes for calculations: M1 - for timeframes up to H1, M5 - for timeframe H1, M15 - for timeframe H4, H1 - for timeframe D1, H4 - for timeframe W1, D1 - for timeframe MN. The color of the DPOC curve sections is determined by comparing the volume of the POC levels of all profiles that make up

FOTSI is an indicator that analyzes the relative strength of currencies in major Forex pairs. It aims to anticipate corrections in currency pairs following strong trends by identifying potential entry signals through overbought and oversold target areas. Theoretical Logic of Construction: Calculation of Individual Currency Momentum: FOTSI starts by calculating the momentum for each currency pair that includes a specific currency, then aggregates by the currency of interest (EUR, USD, GBP, CHF,

this indicator has the finality of show in graph the size of candle in formation to show the force of market in some moments of the day. This indicator is free and based on example disponible on the comunity. I'm disponibilizing here to anyone who don't know about programing. Please enjoy this indicator and leave a coment or a rate to help this indicator to other people who needs.
FREE
This is an indicator to assist a trader on trend detection of any market. This indicator is made up of a blend of moving averages for trend detection. I know no indicator is 100% accurate , but this might help you. I'm giving it for free and also , there are important settings on the last screenshot. This indicator should be on a separate window after you set it up on the chart.
FREE
SyncCrosshair – Synchronized & Snapped Crosshair Indicator
Overview: SyncCrosshair is a lightweight MQL5 indicator that replicates TradingView’s crosshair experience across multiple MT5 charts. Move your mouse or click on any synced chart, and watch the vertical + horizontal lines snap precisely to each candle’s opening time at the chart’s timeframe (5 min, 15 min, H1, H4, etc.).
Key Features:
• Multi-Chart Sync: Automatically mirrors crosshair position across all charts that have Sync
FREE

Enhance your trend-following strategy with UCS_RH_IRB (Rob Hoffman Inventory Retracement Bar) MT5 , a precision indicator identifying candles retracing 45% or more against the prevailing trend—highlighting points where institutional counter-trend activity typically subsides and the dominant move resumes. Based on Rob Hoffman’s well-known IRB methodology, this indicator offers clear visual confirmations for trend continuation setups after pullbacks, suitable for forex, indices, commoditi

This is a multi-timeframe indicator that detects and displays support and resistance (S&R) lines using the ZigZag indicator.
Features
The support and resistance lines are not redrawing. The indicator is capable of adding new support and resistance levels as they appear. Each S&R line has a tooltip that displays the price level and start time. Save time for multi-timeframe analysis on trades. All types of alerts (sound, pop-up, email, mobile push notification) are available. Working with all p
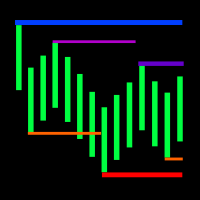
The indicator displays the fractal levels of one, two or three different higher timeframes starting beginning with the current one. When a new fractal appears, a new level is plotted. The indicator can be used for visual analysis of the current chart and applied in an EA. If more levels are needed, start a new instance of the indicator.
Features The indicator works on any timeframe and symbol. If a timeframe smaller than the current one is selected in the settings, the level of the current time

Coral trend is a trend-following indicator that is widely popular among FOREX traders . It is usually used as a confluence with other indicators. It uses combinations of moving averages with complex smoothing formulas! It has two configurable parameters: Coefficient - smoothing ratio (*)
Applied price Calculation: Coral = (-0.064) * B6 + 0.672 * B5 - 2.352 * B4 + 2.744 * B3
FREE

"Elder Ray" or "Ray" indicator is based on the Dr. Alexander Elder's oscillators: Bulls & Bears Power. Both of them works with an EMA. This indicator is used by traders to identify divergence, market directions and more... Dr. Elder's method generally uses a 13-day EMA Period but this can be modified based on your personal demand. The calculations are: Bulls Power= high candle - EMA close Bears Poder= low candle - EMA close Lime line represents Bulls Power and OrangeRed line, shows Bears Power
FREE

Description: The Custom Moving Averages indicator displays three different moving averages on the chart: a 10-period Simple Moving Average (SMA10) in lime, a 21-period Simple Moving Average (SMA21) in red, and a 200-period Exponential Moving Average (EMA200) in thicker white. This indicator helps traders identify trends and potential entry/exit points based on the behavior of these moving averages. Features: Three moving averages in different periods: SMA10, SMA21, and EMA200. Customizable color
FREE

AP Session Boxes — Asian / London / NY Range Overlay (MT5 Indicator) Clean session boxes on your chart.
This lightweight indicator draws the Asian , London , and New York time windows directly on the chart, including each box’s high and low as dashed lines. It’s perfect for quick context, breakout planning, and clean screenshots. Instant structure: See where the market ranged during key sessions. Breakout prep: Use the hi/lo lines as reference for pending orders or alerts fr
FREE
This is a custom MACD (Moving Average Convergence Divergence) indicator designed for MetaTrader 5 (MT5) . It replicates the TradingView MACD version , ensuring consistency for traders familiar with that platform. The default MACD in MT5 has differences in its calculation and visualization compared to TradingView. This indicator provides an identical structure, allowing for accurate technical analysis across different platforms. Features TradingView-Style MACD – Matches the histogram, signal lin
FREE

Highly configurable Momentum indicator.
Features: Highly customizable alert functions (at levels, crosses, direction changes via email, push, sound, popup) Multi timeframe ability Color customization (at levels, crosses, direction changes) Linear interpolation and histogram mode options Works on strategy tester in multi timeframe mode (at weekend without ticks also) Adjustable Levels Parameters:
Momentum Timeframe: You can set the lower/higher timeframes for Momentum. Momentum Bar Shift: Y
FREE

When prices breakout resistance levels are combined with momentum oscillator breaks out its historical resistance levels then probability emerges to record farther higher prices. It's strongly encouraged to confirm price breakout with oscillator breakout since they have comparable effects to price breaking support and resistance levels; certainly short trades will have the same perception. Concept is based on find swing levels which based on number of bars by each side to confirm peak or trough
FREE

** All Symbols x All Time frames scan just by pressing scanner button ** *** Contact me to send you instruction and add you in "Divergence group" for sharing or seeing experiences with other users. Introduction MACD divergence is a main technique used to determine trend reversing when it’s time to sell or buy because prices are likely to drop or pick in the charts. The MACD Divergence indicator can help you locate the top and bottom of the market. This indicator finds Regular divergence for pul

Pivots Points are significant levels traders can use to determine directional movement, support and resistance. Pivot Points use the prior period's high, low and close to formulate future support and resistance. In this regard, Pivot Points are predictive and leading indicators. Pivot Points were originally used by floor traders to set key levels. Floor traders are the original day traders. They deal in a very fast moving environment with a short-term focus. At the beginning of the trading day,
Supertrend with CCI Indicator for MQL5 – Short Description The Supertrend with CCI Indicator is a powerful trend-following tool that combines Supertrend for trend direction and CCI for momentum confirmation. This combination helps reduce false signals and improves trade accuracy. Supertrend identifies uptrends and downtrends based on volatility.
CCI Filter ensures signals align with market momentum.
Customizable Settings for ATR, CCI period, and alert options.
Alerts & Notifications via
FREE

This indicator allows you to visually identify with a different color the candlesticks that exceed a certain limit of the ATR.
Just drag and drop it on the chart.
The user must enter the value of the ATR period.
The user must enter the value of the ATR limit with which he wants to identify the candlesticks.
In the colors tab, the user can select the colors with which to repaint the candles.
It is recommended that the first color always be None.
The second color corresponds to bullish c
FREE

The Forex Gangster Indicator allows you to determine the current trend. If the Forex Gangster Indicator line has moved below the price and turned blue, then you should open deals for an increase. If the Forex Gangster Indicator line has appeared above the price and turned red, then you should open deals for a decrease: The indicator is suitable for any time frames, but it needs to be supplemented with filtering indicators, since by itself it is late and does not have time to give an accurate si
FREE

Initialize RSI with period 2 above the closing price. Initialize EMA with period 20 above the closing price. Buy condition: RSI < 15 (oversold). Closing price of 4 consecutive candles > EMA (uptrend). Place BUY signal at the bottom of the candle. Sell condition: RSI > 85 (oversold). Closing price of 4 consecutive candles < EMA (downtrend). Place SELL signal at the top of the candle
FREE

Trend Entropy – Adaptive Chaos & Order Detector
Entropy is the scientific measure of disorder or uncertainty in a system. In physics, it shows how energy disperses and why systems move toward chaos. In information theory, it measures unpredictability in data. Low entropy means order and predictability, while high entropy reflects randomness, complexity, and reduced clarity of outcomes.
Trend Entropy is a next‑generation trading indicator designed for MetaTrader 5. Unlike conventional oscillat
FREE

** All Symbols x All Time frames scan just by pressing scanner button ** *** Contact me to send you instruction and add you in "Harmonic Scanner group" for sharing or seeing experiences with other users. Introduction Harmonic Patterns are best used to predict turning point. Harmonic Patterns give you high win rate and high opportunities for trade in during one day. This indicator detects the best and successful patterns based on Harmonic Trading concepts . The Harmonic Patterns Scanner Sc

The currency strength momentum has a lot of similarities with currency strength meter presented in the previous page, but the difference are much more pronounced. You can try putting both in the same chart and see the difference in results. Currency strength momentum measures strength of a currency based on (you guess it) it's momentum relative to other currencies, while currency strength meter measures the strength of a currency based on pips it has moved in a certain direction.
FREE

Welcome to HiperCube DonChian Discount code for 20% off at Darwinex Zero: DWZ2328770MGM_20 This indicator provide you a so usefull info of price showing you whe the price will be probably go up or down. Features:
Indicator in main windows Custom your candles Colors Custom Period of indicator Set Off Set parameters How to interpretate:
Up trend: If some candles go up of upper band ,means that is possible that a bull run is comming. Donw trend: If some candles go down of lower band, means that is
FREE

"️ Your opinion matters! Share your comments and product rating to help us improve and make it better for everyone. " " Your feedback counts! Leave a comment and rating to help enhance the product and meet your needs. " In trading, timing is not an advantage — it is everything . The difference between a winning trade and a losing one often comes down to seconds .
Candle Sentinel gives you total control over time by showing you exactly how much life is left in the current candle — in real
FREE

Simple candle countdown - never again miss how much time is left to open a new bar!
This indicator doesn't plot any line on the chart - it uses only objects and calculates the time left to open a new bar.
You can set custom colors for the panel background and border and for the text color. Simple as that, the indicator is ready to use.
If you find any bugs, feel free to contact me.
FREE
Hello, traders! Welcome to the introduction of Multi Timeframe Analyzer v1.0 ! ( MT5 )
This is the Meta Trader 5 version of the "Market Meeter". Click here to Get MT4 version <<---
What is this indicator? Simply put, this indicator analyzes the market across eight different timeframes , from lower to higher, and predicts the next price direction along with an estimated continuation time. It does this by using volume, volatility, and price patterns in its calculations. Let's dive into the inf

Propfirm Risk Guard Dashboard — Prop‑firm P/L, Drawdown & Exposure Monitor for MT5 Propfirm Risk Guard Dashboard is a compact chart indicator that gives traders an instant, accurate view of their challenge-style limits and worst‑case exposure. Built for traders preparing or taking prop firm evaluations, it aggregates closed P/L, floating P/L, and estimated SL exposure (open + pending) and compares them to your configured daily drawdown, max loss (initial drawdown), and profit target — all in on
FREE

The Magic EMA indicator is of great help in determining trend direction. It can be an excellent addition to your existing strategy or the basis of a new one. We humans can make better decisions when we see better visually. So we designed it to show a different color for rising and falling trends. Everyone can customize this in the way that suits them best. By setting the Trend Period, we can optimize it for longer or shorter trends for our strategy. It is great for all time frames.
IF YOU NEED
FREE

The most sensitive indicator you've ever seen . . .
POscillator is a sensitive indicator to find each trend direction change in every timeframe. It shows price variations and reveals up or down trends. POscillator makes a price curve based on frequency filters. The procedure makes two price functions by using high-frequency and low-frequency filters separately. Then it adds them together to create a smoothed price curve. The final stage of the indicator converts this smoothed curve to an oscil
FREE
Session Bias & Trade Signals in one tool. Detects Asia, London & NY session trends, shows bias strength, alerts bias flips, and plots Entry/SL/TP levels with R:R. Simple dashboard for quick decisions. Simple but powerful trading assistant. This indicator automatically detects the market bias during the Asia, London, and New York sessions .
It helps traders stay on the right side of the trend, avoid neutral zones, and catch bias flips with alerts. Bias Detection – Shows session bias as Bullish

This indicator combines RSI(14) and ADX(14) to find out the signal that price moves strongly. When it appears signal (represent by the yellow dot), and price is going down, let consider to open a SELL order. Otherwise, let consider to open a BUY order. In this case, the strength of moving is strong (normally after sideway period), so we can set TP by 3 times of SL .
FREE
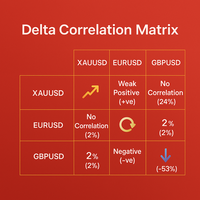
Discover Hidden Market Relationships with Delta Correlation Matrix This indicator is a professional tool designed to measure and visualize the correlation between three different symbols directly on your chart. Instead of relying on static or outdated methods, it dynamically calculates the strength and direction of correlations in real time, helping traders uncover hidden relationships that can influence market moves.
Its goal: to provide instant clarity on whether assets are moving together,
FREE

Hey guys.
This indicator will show you, in the volume histogram, if the candle was a Doji, a bullish candle, or a bearish candle.
The construction of this indicator was requested by a trader who uses other indicators from my catalog, and I decided to release it free to help traders who think that the indicator can contribute to their operations.
The parameters are:
Volume Type: Real Volume or Tick Volume. Color if the candle is bearish: select the color. Color if the candle is high: select
FREE
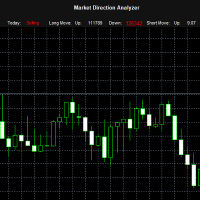
The "Market Direction Analyzer" is a technical indicator designed to provide traders with a comprehensive analysis of market trends, momentum, and potential reversals. By integrating multiple analytical tools, it offers a multi-dimensional perspective on market conditions, aiding in more informed trading decisions.
Using the Market Direction Analyzer in Trading: Trend Confirmation: By analyzing the aggregated sentiment score derived from its components, traders can confirm the prevailing market
FREE

The YK-SMART-EMA is an indicator that displays multiple Exponential Moving Average (EMA) lines on a price chart to help analyze price trends. This indicator features five EMA lines: EMA14 (red line): Calculated based on the closing prices of the last 14 candles. EMA30 (blue line): Calculated based on the closing prices of the last 30 candles. EMA50 (green line): Calculated based on the closing prices of the last 50 candles. EMA100 (orange line): Calculated based on the closing prices of the last
FREE
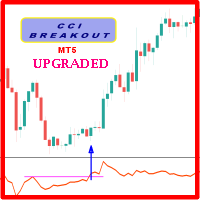
Probability emerges to record higher prices when CCi oscillator breaks out oscillator historical resistance level when exhibit overbought values. Since, oscillator breakout of support and resistance have similar effect as price breaks support and resistance levels, therefore, its highly advised to confirm price breakout with oscillator breakout; certainly, will have the same output in short trades. Concept is based on find swing levels which based on number of bars by each side of peak or troug
FREE

Recommended broker to use the indicator: https://tinyurl.com/5ftaha7c Indicator developed by Diogo Sawitzki Cansi to show possible trade points. Do not repaint. The results displayed in the past are exactly what happened. We also use it to hold trades longer and not get out on false reversal signals which are actually just a profit taking of trades and no one is trying to reverse the direction of the trend. Indicator Parameters: PERIOD: Period for analyzing the buying or selling force to fin
FREE

Overview The Multi Level ATR and Moving Average Band Indicator is a powerful tool for traders seeking to identify market trends, support, resistance levels, and volatility with clarity. This indicator combines multiple moving averages with ATR (Average True Range) multipliers to generate visually distinct bands around price movements. It helps traders spot potential reversal zones, trending conditions, and market consolidation areas. Features Multi-Band Display: Shows six dynamic bands derived f
FREE

Choose the best trading tool: The impact of news on the exchange rate of a currency pair! As a news source you can use: Terminal calendar or Investing.com website In the second case, you will additionally need the Get News5 utility. The indicator combines well with the Trade maker utility, providing multi-currency trading. Calculates: indices of the impact of current news on currency pairs, taking into account market expectations. actual trend directions for 5 customizable timeframes and levels

This indicator utilizes the Narrow Range 7 concept . This concept says that if the seventh candle is the one with the smallest range, that is, the smallest difference between maximum and minimum of all 7 candles. The indicator marks this candle with two markers and waits for a breakout to happens in the next 6 candles. It's called "timeframe" because if in the next 6 candles the breakout not happens, it will remove all marks on candle. If it exceeds 7 times the timeframe, it also will remove the
FREE

This indicator is designed to automatically identify and highlight Mother Bars and their corresponding Child Bars on a price chart using rectangles. A Mother Bar is defined as a significant candlestick that encompasses smaller candlesticks (Child Bars) within its range, commonly used in Price Action trading strategies. The indicator draws rectangles around the Mother Bar and the subsequent Child Bars, providing a clear visual representation for traders to spot potential patterns. Key features: A
FREE

Média Móvel que possui todos tipos de Cálculo comum: Simples Exponencial Suavizada Ponderada Conta com suporte para aplicação sob outros indicadores!
Seu principal diferencial é o esquema de cores em GRADIENTE que, de acordo com a mudança no ângulo da média, altera suas cores conforme demonstrado nas imagens abaixo. Com isso, espera-se que o usuário tenha uma percepção mais suavizada das pequenas alterações.
Bons trades!!
FREE

【SecMode Series】SecModeRSI – Optimized for Global Markets Overview SecModeRSI is part of the SecMode Series , a next‑generation suite of indicators designed to reveal the micro‑structure of price action at the tick/second level —a level of detail that traditional 1‑minute indicators simply cannot capture. While standard indicators refresh only once per minute, SecModeRSI uses a proprietary second‑level engine to: Update up to 60 times per minute (or at user‑defined intervals) Visualize mo
FREE

The BandsFill Indicator is a modified Bollinger Bands with a colored cloud. It has two adjustable parameters: Period Deviation The cloud is colored as follows: If the price crosses the upper band, the cloud is blue. If the price crosses the lower band, the cloud is pink. Thanks to this, the BandsFill Indicator provides traders with an easy opportunity to detect various features and patterns in price dynamics that are invisible to the naked eye. Based on this information, traders can predict
FREE

RSI Condition:
The Relative Strength Index (RSI) for the current period is below a specified low threshold (RsiLow). This indicates oversold conditions. Candlestick Pattern:
It checks for a specific candlestick pattern across three consecutive candles: The current candle (1) closes higher than it opens (bullish) The previous candle (2) closes lower than it opens (bearish) The current candle's close is below the high of the previous candle Price Action:
The alert also checks that the current
FREE

Fuzzy Trend MTF is a multitimeframe trend analysis indicator that uses fuzzy logic to provide a clear, intuitive, and reliable reading of market direction. Recommended for any volatile asset .
Fuzzy Logic + Multiple Timeframes By applying fuzzy logic rules across multiple, individually configurable timeframes, the indicator evaluates candle behavior and scores market trend strength on a scale from -100 to +100 : +100 indicates a strong uptrend, -100 indicates a strong downtrend, Values near 0 s
FREE
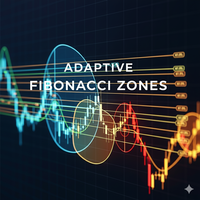
The Adaptive Fibonacci Zones is an enhanced, dynamic version of the classic MetaTrader 5 Fibonacci retracement. Its main difference from the native Fibonacci tool is that you don't need to manually draw the levels or subjectively decide where to measure the retracement from. The indicator does this work for you: it automatically detects relevant market swings (highs and lows) using fractals and an ATR-based volatility filter. This way, the Fibonacci adapts to the market in real time, displaying
FREE

Time and Price Fractal Studies is an indicator that will help you identify certain patterns that tend to repeat themseleves at certail times of the day or at certain prices. It is used to study Fractal Highs ad Lows in relation to time and price. You will get to answer certail questions like: At what time of day does this market usually turn around. At what price does the market turn. Is it at round numbers etc.
FREE
Hi Traders,
Simple, clear, and essential for every trader. It helps keep your chart clean and informative.
// In case you open multiple positions, your chart becomes crowded and messy. Then, you may want to hide "Trade levels" and only concern about the averaging buy or average sell level. // In case you want to know at which price your account would reach the broker’s stop-out threshold (i.e., the price at which your account would be “burned”). //You may also want to get your account's PnL an
FREE

Volatility Matrix is a professional-grade MetaTrader 5 indicator designed to give traders a clear and dynamic view of real-time market volatility.
It combines multiple adaptive volatility bands into a single analytical framework, allowing you to identify compression, expansion, and reversal zones across any timeframe or symbol. This tool goes far beyond standard volatility indicators.
It builds a complete volatility structure around price action, revealing when the market is preparing for moveme
FREE

Candle MAXIMUS RITZ Candle MAXIMUS adalah indikator visual cerdas yang menggabungkan kekuatan analisis tren berbasis Kaufman Adaptive Moving Average (KAMA) , informasi perubahan harian (Daily Change), perbandingan OHLC terhadap hari sebelumnya, serta panel dominasi bar multi-hari. Dirancang untuk semua pair dan semua timeframe, indikator ini menghadirkan tampilan modern, bersih, serta informatif dalam satu panel kompak di chart Anda. Fitur Utama Trend Candle Warna Adaptif (Color Candles) Warna
FREE
Daily Volatility Tracker is a practical and lightweight indicator designed to help traders monitor and analyze market volatility based on historical daily price movements. Whether you're a day trader, swing trader, or scalper, understanding how much a market moves per day is critical for: Choosing the right pairs to trade Setting accurate stop-loss and take-profit levels Adapting to changing market conditions MT4 Version - https://www.mql5.com/en/market/product/134958/ Join To Learn Market De
FREE
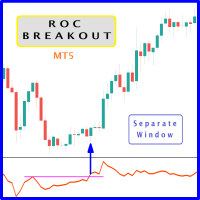
When prices breakout resistance levels are combined with Rate of Change oscillator "ROC" breaks out its historical resistance levels then higher chances emerges to record farther prices. It's strongly encouraged to confirm price breakout with oscillator breakout since they have comparable effects to price breaking support and resistance levels; certainly short trades will have the same perception. Concept is based on find swing levels which based on number of bars by each side to confirm peak or
FREE

Spread Indicator MT5 - NS Finanças. (http://www.nsfinancas.com.br) Auxiliary tool to give Spread visibility to all types of currency pairs and timeframes. The labels are well positioned in the upper right corner of the chart so as not to disturb the visualization during the trade, however it is also possible to drag the indicator to the best place on your screen. In addition to the current spread, this indicator also monitors the minimum, maximum and average spread of the selected currency pair
FREE
Multi-Timeframe Chart Overlay Indicator
The Timeframe Overlay indicator displays price action for multiple timeframes on a single chart, allowing you to quickly assess different timeframes from a single chart. The advantage is to observe and follow the correlations of price movements in real time to help you find potential trades at a glance.
---- Symbol 1 ----
Symbol = EURUSD
Correlation Inverse = false
Display = true
Ratio
FREE
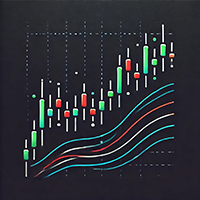
This is simple indicator for displaying Multi Moving Average line in chart, with one single Indicator. Just place the indicator in your chart, select how many MAs you want to display. And you are ready to go. Parameters can be changed on the fly by the control panel provided by the Indicator. And you can show/hide the Moving Average line just with check/unchecked in the Panel. This indicator are still in development, if you have any further feature request, please let me know in the comment.
FREE

The Advanced Pivot Point Indicator is a powerful tool designed to help traders identify key support and resistance levels in the market. This versatile indicator offers a customizable and user-friendly interface, allowing traders to select from five different pivot point calculation methods: Floor, Woodie, Camarilla, Tom DeMark, and Fibonacci. With its easy-to-read lines for pivot points (PP), support (S1, S2, S3, S4), and resistance (R1, R2, R3, R4) levels, the Advanced Pivot Point Indicator pr
FREE

Custom indicator take your MA to the next level allowing you to combine MA from up to 5 different symbols !
why? this way your decision making is based on the complimenting market example: you trade Nasdaq but want to have an eye on the Bitcoin and Russell 2000 at the same time to know market trend
or trading XRP but want to have the global view at your edge
now its possible
Make sure the symbols match your broker ist Case sensitive US100Cash or XAUEUR# and so on... depending on your broke
FREE

Description The Profit and Loss Indicator by Creative Tech Solutions is a robust and comprehensive tool designed to help traders monitor their trading performance in real-time. This indicator provides detailed metrics on profits and drawdowns, ensuring traders are always informed about their trading activities and performance. With customisable alerts and display settings, this indicator is an essential tool for any serious trader. Features Real-Time Metrics : Monitor profit and drawdown percent
FREE

VWAP Matrix Price Levels Pro: The Ultimate VWAP Indicator for MT5 with Dynamic Price Levels Dominate the Market with the Perfect Confluence of Multiple VWAPs and Percentage-Based Price Projections. The Precision Tool for Day Traders and Swing Traders on MetaTrader 5.
The VWAP Matrix Price Levels Pro is an elite indicator for MetaTrader 5, designed for traders who demand precision and a superior market view. Elevate your technical analysis by combining, in a single tool, the institutional power
FREE

- Chart Time Indicator is very simple and easy, but it can be very important to control the time before opening any manual trade. This indicator shows the time on the chart between 3 different options. Input Parameters: - Show Time : Select all the time options that you want to see. Local Time (Personal Computer Time), Server time (Broker Time) or GMT Time. Recommendations: - Use only one Chart Time Indicator for each Chart.
FREE

Trade Sentiment or trade assistant is a MT5 Indicatior. That show buy or sell signal of different indicator to assist to take trades. That will help you to take right trades or to get confirmation for your trade. You don't need to have this indicators. Including indicators like RSI , STOCH , CCI. And the signals are Based on different Timeframes like 5M , 15H , 1H and 4H.
FREE
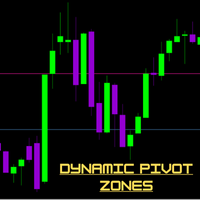
Dynamic Pivot Zones – Your Level Assistant on the Chart This indicator is a bit like a GPS for your trading . It shows you where the price likes to hang out, where it gets nervous, and where it flies through. No more calculating pivots by hand or guessing support and resistance levels. What it does: Automatically plots H1, H4, and D1 pivots . Shows support and resistance zones : R1, R2, S1, S2. Lines are colored and easy to read , so you can instantly see what’s hot or cold. Why you’ll love it:
FREE
The MetaTrader Market is a simple and convenient site where developers can sell their trading applications.
We will help you post your product and explain you how to prepare your product description for the Market. All applications on the Market are encryption-protected and can only be run on a buyer's computer. Illegal copying is impossible.
You are missing trading opportunities:
- Free trading apps
- Over 8,000 signals for copying
- Economic news for exploring financial markets
Registration
Log in
If you do not have an account, please register
Allow the use of cookies to log in to the MQL5.com website.
Please enable the necessary setting in your browser, otherwise you will not be able to log in.