Watch the Market tutorial videos on YouTube
How to buy а trading robot or an indicator
Run your EA on
virtual hosting
virtual hosting
Test аn indicator/trading robot before buying
Want to earn in the Market?
How to present a product for a sell-through
Technical Indicators for MetaTrader 5 - 28

TickFlow is a tool for tick-data analysis and visual highlighting of significant zones on the chart. The utility aggregates current and historical ticks, shows the buy/sell balance, and helps to identify support/resistance levels and cluster zones. This is the MetaTrader 4 version. How it works (brief) TickFlow collects tick data and aggregates it by price steps and candles. Based on the collected data the indicator builds visual layers: up/down tick counters, buy/sell ratio, historical levels
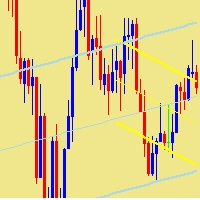
This indicator plots two linear regression channels on the chart for any currency pair or financial instrument, supporting the use of two different timeframes. The first channel uses a shorter period to identify local trends. The second channel uses a longer period to identify overall trends. Each channel displays a main regression line and two lines representing the deviation range. Users can adjust the period of each channel and select the desired timeframe. The indicator helps monitor price m
FREE

Thermo MAP is a multicurrency and multitimeframe indicator that display a smart heat map based on proprietary calculations. Watch how Forex market moved and is currently moving with a single dashboard and have a consistent and good idea of what is happening!
It can be suitable for both scalping or medium/long term, just select options that better fit your trading style Symbols list are automatically sorted based on the preferred column. There is the possibility to click on: First row, timeframe
FREE

Introducing the Professional Indicator ARKA – Candle Close Time
Do you want to always know the exact remaining time for the current candle to close? Or do you want to instantly see the real-time broker spread right on your chart without any extra calculations?
The ARKA – Candle Close Time indicator is designed exactly for this purpose: a simple yet extremely powerful tool for traders who value clarity, precision, and speed in their trading.
Key Features:
Displays the exact time re
FREE
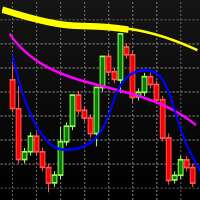
Baseado no indicador MIMA SAR, que é uma combinação dos indicadores MIMA Consolidação e MIMA Tendência, da metodologia Phicube. O indicador é composto pelos 8 fractais, 17,34.72.144.305,610.1292,2554. Sendo a tendência indicada pelas linhas finas e a consolidação pelas linhas mais espessas. Para usar o indicador de maneira adequada deve-se partir do princípio de que tudo na natureza segue o caminho que oferece menor resistência. Isso significa que para uma reversão da tendência ocorrer nesse mod
FREE

Volume-based Support and Resistance Zones Volume-based Support and Resistance Zones is a powerful and flexible indicator for MetaTrader 5 that helps traders identify key market levels formed by volume spikes at fractal highs and lows. This tool automatically plots support and resistance zones where price is most likely to react, helping you trade with greater confidence and clarity.
Key Features Volume-based logic : Zones are created when candles with significant volume occur at fractal highs o
FREE
Engulfing Zone Sniper MT5 — Multi-Timeframe Signal & Zone Indicator The Engulfing Zone Sniper MT5 is a technical analysis tool designed to highlight engulfing candlestick patterns in combination with adaptive support/resistance zones. It provides visual markers and optional alerts to assist traders in identifying market structure reactions across multiple timeframes. Key Features Multi-Timeframe Detection – Option to scan higher timeframe engulfing setups with lower timeframe confirmation. Su

This indicator calculates the average trading range (Daily Range) of the current symbol over a custom period and displays the essential data directly as a comment on your chart. Key Features: Custom Lookback Period: Choose exactly how many days (e.g. 50 days) you want to include in the average range calculation. Real-Time Analysis: Calculates the daily spread ( High - Low ) and provides a precise average value instantly. Clean Design: No cluttered charts! Information is displayed discreetl
FREE
Candle Pressure Index (CPI) is a powerful yet easy-to-use indicator designed to reveal the hidden buying and selling pressure behind every candle. Instead of simply showing whether the price moved up or down, CPI digs deeper into how strongly buyers or sellers controlled the market within each candle. This makes it a unique tool for identifying trend strength, spotting reversals early, and confirming entry or exit points with higher accuracy.
Unlike traditional oscillators that only react to p
FREE

AI SuperTrend Final – Adaptive Intelligence for Smarter Trading
The AI SuperTrend Final is not just another trend indicator—it is a next‑generation trading tool powered by adaptive intelligence. Designed for MetaTrader, this indicator combines the proven logic of SuperTrend with advanced filters such as Moving Average (MA), Average Directional Index (ADX), and a unique self‑learning mechanism. The result is a smart, evolving system that adapts to market conditions and continuously improves its
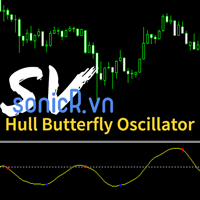
The Hull Butterfly Oscillator (HBO) is an oscillator constructed from the difference between a regular Hull Moving Average ( HMA ) and another with coefficients flipped horizontally . Levels are obtained from cumulative means of the absolute value of the oscillator. These are used to return dots indicating potential reversal points . This indicator draw line in separate window, plus blue dot (for buy signal) when hull oscillator is peak and red when sell signal. It also includes integrate

Special Offer ... It is totally free for all. New one coming soon...................
About This Indicator: RSI vs SMA Indicator: A Comprehensive Technical Analysis Tool for Better for Identify the Short and Long Signals.
The RSI vs SMA Indicator is a powerful technical analysis tool designed to understanding Market Price Fluctuation for Long or Short signals. This user-friendly Indicator good for both novice and experienced traders, providing valuable indication in price chart and separate wind
FREE

XE Forex Strengh Indicator MT5 displays visual information about direction and strength of a signal for current pair and chosen timeframes (M5, M15, M30 and H1). Calculations are based on multiple factors and results are shown as a colored panel with scale bar, numerical values and arrows. There are also displayed values of current price and spread on the pair. There can be activated an alert (as a mail or pop-up window with sound) for each available timeframes which send a message when the dir
FREE
The Strat Dashboard - Multi-Symbol Pattern Scanner for Rob Smith's Strat Strategy Transform Your Trading with Real-Time Multi-Symbol Strat Analysis The Strat Dashboard is a powerful, professional-grade indicator designed specifically for traders using Rob Smith's renowned "Strat" trading methodology. Monitor unlimited symbols across multiple timeframes simultaneously, identify high-probability setups instantly, and never miss another actionable pattern. MT4 Version :- https://www.mql5.com/en/m

FRONTIER PIVOTS - Geometric Levels Indicator This indicator plots support and resistance levels/ranges on the chart using mathematical calculations. It helps traders identify potential price reaction zones based on geometric patterns. Main Features: Automatically calculates and displays key price levels Plots both support and resistance lines Uses daily price data for level calculation Clean visual presentation with different colors for different level types No repainting - levels remain static

Identification of support and resistance areas
A useful indicator for traders
completely free
Can be used in all symbols
Can be used in all time frames
It has three different trends: short term, medium term, long term
Settings:
Clr1,2: You can change the color of the lines
Type Trend: You can determine the trend
Message me for questions, criticism and suggestions
FREE

introducing the Golden Sniper Indicator, a powerful MQL5 tool meticulously crafted for traders seeking to enhance their trading experience. Developed by a team of seasoned traders with over 6 years of expertise, this indicator offers a reliable method for identifying trading opportunities with remarkable accuracy.
Key Features : Alerts and Signal Arrows : The Golden Sniper Indicator provides timely alerts and visual signal arrows, helping you identify trend reversals. Risk Management : It sugg
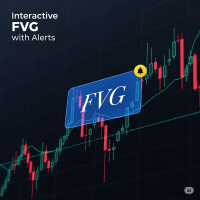
FVG Indicator with Alerts Description: This is a simple and effective indicator for identifying and displaying Fair Value Gaps (FVGs) on any timeframe. The indicator helps you see important price imbalances and provides powerful interactive tools for your analysis. Key Features: Detects FVGs: Clearly identifies and draws boxes around Bullish and Bearish Fair Value Gaps. Midline Level: Displays the 50% equilibrium level inside each FVG box, a critical point of interest. Complete Alert System: Rec
FREE

ATHENA Quantum v4.0.1 - Professional Trading Indicator MetaTrader 5 Indicator
Build: 2026-02-05 OVERVIEW ATHENA Quantum combines AI pattern recognition, institutional microstructure analysis, and Smart Money Concepts to generate high-probability trade signals with comprehensive risk management. KEY FEATURES AI-Powered Signals Prometheus genetic algorithm engine Ensemble prediction (3-10 pattern voting) Confidence-based filtering No repaint - signals finalize on bar close Institutional A
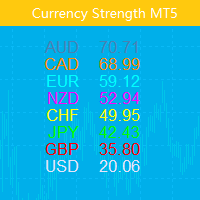
This indicator shows the relative strength of 8 major currencies: USD, EUR, GBP, AUD, NZD, CAD, CHF and JPY. The strength value is normalized to the range 0-100: The value above 60 means strong. The value below 40 means weak. The basic principle Given eight currencies, USD,EUR,GBP,AUD,NZD,CAD,CHF,JPY, where each pair of two can be combined, resulting in a total of 28 pairs, a reverse algorithm is used to extract the strength of the eight currencies from these 28 pairs EURUSD,GBPUSD,AUDUSD,NZDUS

This Indicator analyses the Trend and shows signals. When you open the Chart , Indicator shows you Buy or Sell Signal as Alert. Usage: Activate Algo Trading , Activate the Indicator and drag new currencies into chart. Indicator shows you Buy or Sell Signal as Alert.
Results
- Buy Signal
- Sell Signal
- No Signal For any question please don't hesitate to contact.
FREE
If you love this indicator, please leave a positive rating and comment, it will be a source of motivation to help me create more products <3 Key Takeaways StochRSI is an oscillator that measures the RSI level relative to its high-low range over a period of time. It is more sensitive than the traditional RSI and can highlight overbought or oversold conditions in the market. StochRSI is typically used to generate more frequent and timely trading signals compared with the traditional RSI. StochRSI
FREE

Value Chart indicator presents the Price evolution in a new form. This indicator, Price Momentum , was developed taking all the calculations presented in the book " Dynamic Trading Indicators " by Mark W. Helweg and David Stendahl (2002). The technique involves de-trended Prices from a user-defined Period of analysis and the addition of a Volatility index correction. The result is an Oscillator with 3 zones: Fair Price Value, Overbought/Oversold and Extremely Overbought/Oversold zones. Adding th
FREE

TrendPicoeur — the indicator is non-repainting. ParabolicSAR algorithm based on volatility. The indicator can be used for trailing stop, as a signal indicator, or a trend indicator. If you need to add an alert system (alert, sound, email, Telegram, WhatsApp), please reach out in the comments. It connects to an Expert Advisor via buffers. The indicator has two buffers: SetIndexBuffer(0, sarBuffer, INDICATOR_DATA); — Buffer (0) contains the price level for arrow placement on the chart. SetIndex
FREE

Bollinger Alerts is a classic Bollinger Bands indicator enhanced with an intelligent alert system, designed to help traders clearly identify overbought and oversold conditions. The indicator plots the three traditional bands: Upper Band
Middle Band (Moving Average)
Lower Band In addition, it features configurable alerts, allowing traders to be automatically notified whenever price reaches statistically extreme regions. Integrated Alert System Alerts are generated only at candle close, ensuring g
FREE
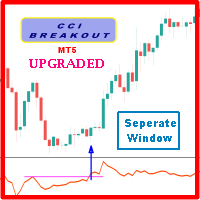
Probability emerges to record higher prices when Commodity Channel Index breaks out oscillator historical resistance level when exhibit overbought values. Since, oscillator breakout of support and resistance have similar effect as price breaks support and resistance levels, therefore, its highly advised to confirm price breakout with oscillator breakout; certainly, will have the same output in short trades. Concept is based on find swing levels which based on number of bars by each side of peak
FREE

The purpose of Impulse Release is to prevent trading in the wrong direction. While the Impulse System operates in a single timeframe, Impulse Release is based on two timeframes. It tracks both the longer and the shorter timeframes to find when the Impulse points in the same direction on both. Its color bar flashes several signals: If one timeframe is in a buy mode and the other in a sell mode, the signal is "No Trade Allowed", a black bar. If both are neutral, then any trades are allowed, showi

Highly configurable Bollinger Bands indicator. Features: Highly customizable alert functions (at levels, crosses, direction changes via email, push, sound, popup) Multi timeframe ability Color customization (at levels, crosses, direction changes) Linear interpolation option Works on strategy tester in multi timeframe mode (at weekend without ticks also) Parameters:
Bollinger Bands Timeframe: You can set the lower/higher timeframes for Bollinger Bands. Bollinger Bands Bar Shift: Y ou can set th
FREE

FVG Concept and Market Structure (MS) Indicator – Comprehensive Analysis with Interactive Control This is not just an indicator. It is a useful tool for market analysis. This indicator combines several analytical functions, making it one of the more complete solutions in its field. This tool represents a comprehensive solution for analyzing market behavior with the goal of forecasting the direction of price movement. The indicator is designed to assist the trader and not distract them with unnec
FREE
Pro MA 5 – The Professional Moving Average Suite The Most Complete Moving Average System for MetaTrader 5 Pro MA 5 revolutionizes technical analysis by offering a powerful, customizable, and efficient interface to detect trends with surgical precision . What is Pro MA 5? It's an advanced indicator that integrates up to 5 configurable moving averages with intelligent alerts , an interactive panel , and an optimized design for trading on any instrument or timeframe. It's an all-in-one solution
FREE

Account Dashboard Statistics
It is a tool that will help you have a focused view in order to know the profits and losses of your account , so you can keep track of it, it also brings a drawdown analysis to know the risk obtained as well After downloading and activating it in your account, you must attach it to any symbol for example EURUSD H1, then from this moment the tool will start to monitor your statistics, you can see my other free products here Mql5
the panel is completely advanced,
FREE

The indicator looks for the "Fifth dimension" trade signals and marks them on the chart. A detailed description of the chart patterns that generate the trade signals can be found in Chapter 8 "The Balance Line Trades" in the book Williams' "New Trading Dimensions". Signal levels with indication of the position entry or stop loss placement price are indicated directly on the chart. This feature creates additional convenience for the trader when placing pending orders. A solid horizontal line is d
FREE
If you like this product, please give it a 5 star rating as a token of appreciation.
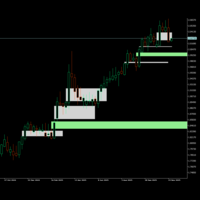
This indicator identifies and displays Fair Value Gaps (FVG) on price charts.
Fair Value Gaps are price zones where there's a significant imbalance between buying and selling pressure, creating "gaps" in price action. The indicator detects two types and when they are mitigated(touched):
Bullish FVG: When a candle's low is above the high of a candle two periods earlier.
Bearish FVG: When a candle's high is bel
FREE

This is a usefull utility for monitoring spread and also for recording informations to a file. (Files will be placed into "Common\Files\Spread Monitor"). There is the possibility to let the indicator calculate high/low into the past thanks to downloading ticks. (It's a slow and approsimate thing! The best way to use it is to attach to a chart and let it recording spread in real time). There is also a buffer with the average of spread in latest X periods.
Easy and effective.
FREE
Simple SuperTrend indicator, similar to that of TradingView's.
It has buffers for buy and sell signal, if you want to integrate this into an EA.
It helps traders easily identify trends by providing clear buy and sell signals based on price movements. Designed for simplicity, it’s easy to use and integrates well with various trading strategies, making it a great option for traders of all levels.
Happy trading!
FREE

Introduction
The RSI Plus is an innovative technical analysis tool designed to measure the strength and direction of the market trend. Unlike the traditional RSI indicator, the RSI Plus boasts a distinctive ability to adapt and respond to market volatility, while still minimizing the effects of minor, short-term market fluctuations.
Signal
Buy when the RSI plus has been in the oversold (red) zone some time and it crosses above the 20 level on previous candle close
Sell when the RSI plus ha
FREE

Hull Moving Average is more sensitive to the current price activity than a traditional Moving Average. It faster responds to trend change and more shows the price movement more accurately. This is a color version of the indicator. This indicator has been developed based in the original version created by Sergey <wizardserg@mail.ru>. Suitable for all timeframes.
Parameters Period - smoothing period, recommended values are 9 to 64. The larger the period, the softer the light. Method - smoothing m
FREE

The indicator displays divergence for any custom indicator. You only need to specify the indicator name; DeMarker is used by default. Additionally, you can opt for smoothing of values of the selected indicator and set levels whose crossing will trigger an alert. The custom indicator must be compiled (a file with ex5 extension) and located under MQL5/Indicators of the client terminal or in one of the subdirectories. It uses zero bar of the selected indicator with default parameters.
Input parame
FREE

Clock GMT Live has everything you need to know more about our broker, many times you will have wondered what gmt I am on or what gmt my broker is working on, well with this tool you will be able to know in real time both the GMT time offset of the broker and of your local time, you will also constantly know the ping of the broker Just by placing it at a time of day you can get the information
The price increases for each acquisition, with this we will protect so that few can have my unique str
FREE
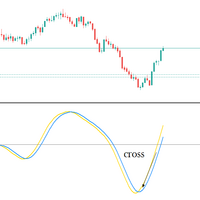
Big promotion on the Robos, Get yours now Robos Indicator The ROBOS indicator is a multi timeframe oscillator that targets the overbought and oversold regions of a price chart, a signal is indicated by the two lines crossing, compatible with all tradable instruments
Latest Release
The latest release is the version 4.0
#What's new in version 4.0 ?
Features
Extreme oversold and overbought levels
ROBOS version 4.0 comes with cool new feature , the ability to target only extrem
If you like this product, please give it a 5 star rating as a token of appreciation.
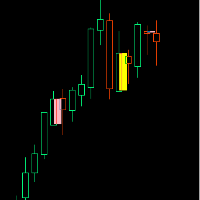
Inside Bar: A candle that is completely contained within the high-low range of the previous candle
Outside Bar: A candle that completely engulfs the high-low range of the previous candle (also called an "Engulfing Bar")
Inside Bars Consolidation Signals : Indicates market indecision/compression Breakout Setup : Often precedes significant price moves Continuation Patterns : Can signal pause in trend before con
FREE

Welcome to a new era of trading with the AI Moving Average indicator, an advanced MetaTrader 5 indicator designed to provide traders with predictive insights into market movements. This tool combines the power of AI with the reliability of a zero-lag exponential moving average to deliver precise and timely predictions of future price trends. Innovative Linear Regression Model The AI Moving Average leverages a linear regression machine learning model to analyze historical price data, enabling it
FREE

FX Correlation Matrix is a powerful multi-timeframe dashboard that helps traders analyze real-time currency correlations of up to 28 symbols at a glance. With customizable settings, sleek design, and manual symbol selection option, it enhances trade accuracy, reduces risk, and identifies profitable correlation-based opportunities. Setup & Guide: Download MT4 Version here. Follow our MQL5 channel for daily market insights, chart, indicator updates and offers! Join here.
Read the product des

One of the best tools for analyzing volume,
Weis Wave was idelized by David Weis, to facilitate the reading of directional flow. For the VSA method disciples it is an evolution of the practices created by Richard Wycoff, facilitating a predictive reading of the market, always seeking an accumulation and distribution of the negotiated contracts.
Cumulative wave volume Range of wave ( removed) Average Wave volume Ref "Tim Ord lectures" ( removed)
FREE

The daily custom period seperator indicator allows you to draw period seperators for your lower time frame charts H1 and below. The period seperator gives you options to set different colors for: Weekend - saturday/sunday Monday and Friday Midweek - Tuesday to Thursday.
By default the indicator plots the period seperator line at 00:00 hours for the last 10 days.
Use Cases: The indicator can be used as a colourful alternative period seperator to the default MT5 period seperator. For those tha
FREE

AI Adaptive Market Holographic System Indicator Based on Microstructure and Field Theory Abstract: This paper aims to explore the construction principles and implementation mechanism of a novel financial market analysis tool—the Micro gravity regression AIselfregulation system. This system fuses Market Microstructure theory, classical mechanics (elasticity and gravity models), information entropy theory, and adaptive AI algorithms. By aggregating Tick-level data in real-time, physically modeling

Channels indicator does not repaint as its based on projecting the falling and raising channels. As a trader you need a path to be able to place your buy and sell trades such as: Supply and Demand , Falling & raising channels. Falling and raising channels can be in any time frame and also can be in all time frames at the same time and the price always flows within these channels. Experienced trades will draw the key levels and channels around the time frames. But, they will not be able to draw
FREE

StopLevel The meter controls the STOPLEVEL level. When the level changes, it signals with an alert. STOPLEVEL - the minimum offset in points from the current closing price for placing Stop orders, or the minimum allowable stop loss / take profit level in points. A zero value of STOPLEVEL means either the absence of a restriction on the minimum distance for stop loss / take profit, or the fact that the trading server uses external mechanisms for dynamic level control that cannot be transmitte
FREE
[ MT4 Version ] Order Block Indicator MT5 — Precision Trading Made Simple
Order Block Indicator MT5 is designed to help traders spot powerful reversal zones effortlessly — without cluttered charts or guesswork.
Built for scalping , swing trading , and smart intraday decisions , it highlights active order blocks across multiple timeframes with precision, speed, and full customization. Trade with clarity, save valuable time, and react instantly to market structure changes — even across Forex

Do you want to see the most relevant supports and resistances at a glance? Tired of tracing the levels by hand? Multi Levels Detector is an indicator for MetaTrader that will draw supports and resistances according to the parameters entered, and also offers the possibility of executing an alert every time the price reaches any of its levels.
SETTINGS UsePercentage: Allows you to configure whether the distances between levels will be measured in points, or by a percentage of the asset.
TimeFram
FREE

ATR Moving Average draws a moving average of the standard Average True Range( ATR ) in the same window.
Settings Name Description ATR period
Set Price per iod for ATR calculation
ATR level Set ATR value for thresholding( only whole number, ignore leading zeros e.g. 0.00089 = 89 ) MA Period Set moving Average Period MA Method Set moving average method( Simple, Exponential, Smoothed and Linear Weighted ) MA Shift
Set moving average shift
Enable Alerts ? Generate Alert when ATR crosses Moving
FREE

BTMM Continuation Sessions + Re-Entry Indicator (MT5) is a chart visualization tool designed to make continuation trading clearer and faster.
It draws session boxes (Asian, London, New York) and marks continuation entry + re-entry opportunities during active sessions.
Works on Forex pairs and XAUUSD (depending on broker symbols).
This is an indicator (not an EA). It does not place trades automatically.
Key Features
Session Boxes Asian, London, New York boxes Custom colors, opacity,
FREE

The Monthly Weekly Open Line is an indicator that plots: The current month open line that will extend till the last week on the month. Weekly lines that span the look back days period that you have set . Each line will extend from the respective weekly Monday zero GMT till friday of the respective week. Monthly and Weekly open lines can be used to build very powerfull anc consistent trading strategies. They act as natural S/R price barriers.
FREE

This is an exclusive candlestick closing monitor with audio alerts for the MT5 platform, designed to deliver precise reminders for the closing moments of candlesticks on your specified timeframe. Equipped with a visual global switch, independent dual-mode alerts and real-time data display, it features easy operation and full compatibility with all MT5 trading timeframes. It effectively prevents missing key trading opportunities and serves as a practical auxiliary tool for trading chart monitori
FREE

The Round Number Calculator is a indicator that automatically plots psychologically significant price levels on your chart. Unlike basic tools, this indicator intelligently distinguishes between Forex pairs (Pips) and Indices/Metals/Crypto (Points) to deliver the perfect grid every time. Why Round Number Calculator Pro? Institutional traders and algorithms often place their orders at "round" numbers. This tool helps you instantly identify these liquidity zones without cluttering your chart manua
FREE

N/B: All our product purchase comes with our free ‘’DAILY SCALPER EA’’ - bit.ly/4qlFLNh Whatsapp Developer for yours after successful purchase
Eternal Spike Detector Pro - M5 Mastery System
HOW TO TRADE THIS SYSTEM
TRADING RULES
For CRASH 500/900/1000:
SELL SETUP:
· Wait for RED DOWN ARROW to appear · Enter SELL at the close of the M5 candle where arrow appears · Stop Loss: 1.5x ATR above the entry high · Take Profit: 2-3x ATR below entry · Only trade maximum 7 signals per day

The Price Action Finder Multi indicator is an indicator of entry points that searches for and displays Price Action system patterns on dozens of trading instruments and on all standard time frames: (m1, m5, m15, m30, H1, H4, D1, Wk, Mn). The indicator places the found patterns in a table at the bottom of the screen. By clicking on the pattern names in the table, you can move to the chart where this pattern is located. Manual (Be sure to read before purchasing) | Version for MT4 Advantages
1. Pat

'Naturu' is a manual indicator that uses nature’s symmetry as its algorithm.
Master the market with a simple strategy and hidden wisdom! This is a manual indicator and contains features that are not supported by the MetaTrader testing environment
When you load the indicator, you’ll see two lines—Top and Bottom. Click once on a line to activate it. To move it, simply click on the candlestick where you want it placed.
You define a high point and a low point, and the indicator then calculates

Unveil Trading Insights with Auto Anchored VWAPs: Auto Anchored VWAPs serve as your guiding companion in the world of trading. These indicators pinpoint crucial market turning points and illustrate them on your chart using VWAP lines. This is a game-changer for traders who employ anchored VWAP strategies. How Does It Work? Identifying High Points: If the highest price of the current candle is lower than the highest price of the previous one, And the previous high is higher than the one before it

Auto Optimized RSI is a smart and easy-to-use arrow indicator designed for precision trading. It automatically finds the most effective RSI Buy and Sell levels for your selected symbol and timeframe using real historical data simulations. The indicator can be used as a standalone system or as part of your existing trading strategy. It is especially useful for intraday trading. Unlike traditional RSI indicators that rely on fixed 70/30 levels, Auto Optimized RSI dynamically adjusts its lev

This indicator provides the ability to recognize the SMC pattern, essentially a condensed version of the Wyckoff model. Once the pattern is confirmed by RTO, it represents a significant investment opportunity. There are numerous indicators related to SMC beyond the market, but this is the first indicator to leverage patterns to identify specific actions of BigBoy to navigate the market. The SMC (Smart Money Concept) pattern is a market analysis method used to understand the behavior of "smart

If you are (or were) a fan of the RSI indicator will love Tushar Chande's Dynamic Momentum Index indicator, that simply put is a dynamic variable lenght RSI, so it is more powerful. The DMI indicator internally uses a variable number of bars in its calculations, taking into consideration the volatility levels of the current market you are analyzing. This way, the DMI indicator will use more bars as volatility decreases and less bars when volatility increases, giving you a more powerfull analysis
FREE
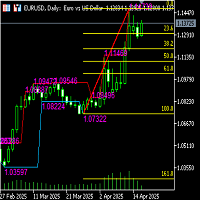
Functional description of automatic Fibonacci line indicator (including high and low channel lines) Indicator name Automatic Fibonacci retracement line + high and low channel auxiliary
Functional introduction This indicator combines the automatically identified high and low points of the band, automatically draws the Fibonacci retracement/extension line, and draws the highest and lowest price channel lines of the current analysis interval to provide traders with clearer support/resistance refe
FREE

O Indicador valida a força da tendência utilizando o volume negociado. Os candles são mostrados na cor verde indicando força compradora e cor vermelha na força vendedora. O movimento é encerrado pelo SAR parabólico. Vantagens: Filtra distorções de preço sem volume financeiro; Filtra consolidações e movimentos laterais; Filtra divergências de volume pelo indicador Money Flow. Desvantagens: Não filtra todos os falsos rompimentos, visto que rompimentos importantes geram altos volumes financeiros; N
FREE
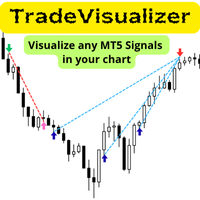
The Trade Visualizer indicator brings your trading data to life by plotting complete trade histories directly onto your MT5 charts. Whether you’re analyzing your own performance or exploring signals from MQL5 traders, this tool transforms raw trade data into clear, intuitive visuals. Each trade is represented by entry and exit arrows, connected lines, and detailed tooltips showing prices, profit, volume, and pips — allowing you to instantly understand the behavior and performance of any trading
FREE

Strifor Pivot + ATR Target
Pivot Levels Indicator with ATR-Based Targets and Analytics Panel
for MetaTrader 5 Strifor Pivot + ATR Target is a tool for intraday and medium-term trading that combines classic pivot levels with dynamic ATR targets and an informational analytics panel. The indicator helps you assess the trading range in advance, identify likely price reaction zones, and estimate movement potential — eliminating manual calculations and subjective assumptions. Key Features Automatic c
FREE

Mostra a média móvel quando ADX > 20 e pinta de verde ou vermelho quando os valores de ADX estão subindo indicando tendência. Quando o ADX é menor que 20 indica movimento lateral consolidado. O indicador não define pontos de entrada, somente mostra a média colorida quando a tendência está se fortalecendo. Faz parte do grupo de indicadores do Indicador Tavim.
FREE

Synthetic Reverse Bar is an evolution of Reverse Bar indicator. It is well-known that candlestick patterns work best at higher timeframes (H1, H4). However, candlesticks at such timeframes may form differently at different brokers due to dissimilarities in the terminal time on the single symbol, while the history of quotes on M1 and M5 remains the same! As a result, successful patterns are often not formed at higher timeframes! Synthetic Reverse Bar solves that problem! The indicator works on M5
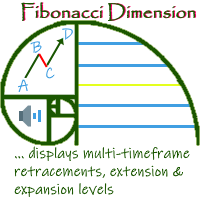
'Fibonacci Dimension' indicator allows display of preset or user-defined multi-timeframe Fibonacci levels. It automatically takes the previous high and low for two user-defined timeframes and calculates their Fibonacci retracement levels. It also considers the retraced level to draw the expansions on every change of price. A complete visual dimension in multiple timeframes allows deriving profitable strategies for execution. Enhanced functionality to view and customize the default Fibonacci Rang
FREE

This Indicator represents the standard Heikin Ashi Candle converter from normal candles. They are applied on a different chart, so you can identify easily both prices. You can also change candles to your favourite colours. If you want to, you can use this indicator into an iCostum, so you can apply other indicators over this on, because there are excellent indicators combined with this type of candles
FREE
The MetaTrader Market is the best place to sell trading robots and technical indicators.
You only need to develop an application for the MetaTrader platform with an attractive design and a good description. We will explain you how to publish your product on the Market to offer it to millions of MetaTrader users.
You are missing trading opportunities:
- Free trading apps
- Over 8,000 signals for copying
- Economic news for exploring financial markets
Registration
Log in
If you do not have an account, please register
Allow the use of cookies to log in to the MQL5.com website.
Please enable the necessary setting in your browser, otherwise you will not be able to log in.