Watch the Market tutorial videos on YouTube
How to buy а trading robot or an indicator
Run your EA on
virtual hosting
virtual hosting
Test аn indicator/trading robot before buying
Want to earn in the Market?
How to present a product for a sell-through
Technical Indicators for MetaTrader 5 - 6
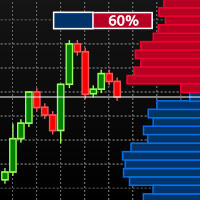
Visual Book on Chart is an indicator designed specially for stocks and futures market. To check if you can use the tool with your Broker open the MT5 Depth Of Market on your terminal and check if there are price and volume data available. Learn more about the MT5 Depth Of Market in the oficial page. The indicator shows the depth of market data on the chart window and use gradient based on the market data to colorize the histogram bars. The indicator is formed by two components: The panel, whic
FREE

This all-in-one trading indicator brings together breakout signals, high and low levels, and a trailing stop with alerts into a single, powerful tool. If you've ever felt overwhelmed by layering too many indicators on your chart, this one simplifies everything while giving you a sharp edge in the markets. It combines three essential elements into a clean, straightforward display that helps you spot entry opportunities, handle risk, and grasp the overall market flow right away. It's especially ha
FREE

Adaptive Volatility Range [AVR] - is a powerful tool for identifying key trend reversals. AVR - accurately displays the Average True Volatility Range taking into account the Volume Weighted Average price. The indicator allows you to adapt to absolutely any market volatility by calculating the average volatility over a certain period of time - this provides a stable indicator of positive transactions. Thanks to this , Adaptive Volatility Range has a high Winrate of 95% There are two ways t

The Anchored VWAP Bands is an advanced precision tool designed to calculate the Volume Weighted Average Price (VWAP) from any specific point on the chart, utilizing a dynamic point-and-click anchoring logic . The Advantage: Precision Anchoring (Click-Point Detection) Unlike standard VWAPs, this indicator detects exactly where you click relative to the candle to define the price calculation base: Click at the Top (HIGH): Anchoring focused on the Maximum Price. Ideal for measuring the average cost
FREE

Order Flow Lite is a technical analysis utility designed to visualize synthetic Order Flow, Footprint Charts, and Tick Analysis using standard broker data. It assists traders in analyzing Delta logic and Volume Profiling based on recent price action. Key Features: Synthetic Footprint: Visualizes volume data for the most recent 3 closed candles, offering a clear view of immediate market sentiment. Tick Delta: Displays basic Buy/Sell delta visualization to identify potential reversals. Volume Pro
FREE

Gold Trend - this is a good stock technical indicator. The indicator algorithm analyzes the price movement of an asset and reflects volatility and potential entry zones. Live Signal of manual trading >>> [ Click Here ] The best indicator signals: For SELL = red histogram + red SHORT pointer + yellow signal arrow in the same direction + red trend direction arrow . For BUY = blue histogram + blue LONG pointer + aqua signal arrow in the same direction + blue trend direction arrow . Benefits of th
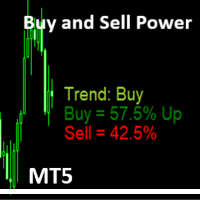
Simple Indicator that shows the Buy and Sell volume in percent. The Buy and Sell Power indicator for MetaTrader 5 calculates and displays estimated buy/sell volume percentages over a user-defined period (default: 14 bars) using tick volume data. It overlays text labels on the chart showing Buy % (with "Up" if >51%), Sell % (with "Dn" if >51%), and a trend signal based on thresholds: Neutral (<55%), Trend: Buy/Sell (55%+), Trend: Strong Buy/Sell (62%+), Trend Max UP/Down (65%+), or Trend change s
FREE
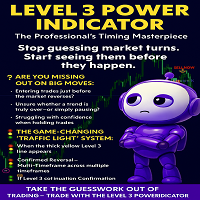
LEVEL 3 POWER INDICATOR
The Professional’s Timing Masterpiece
Stop guessing market turns. Start seeing them before they happen.
---
Are You Missing Out on Big Moves?
Entering trades just before the market reverses?
Unsure whether a trend is truly over—or simply pausing?
Struggling with confidence when holding trades?
You’re not alone. Most traders wrestle with these exact challenges… until they discover the Level 3 Power Indicator.
---
The Game-Changing “Traffic Light” Syst
FREE

Necessary for traders: tools and indicators Waves automatically calculate indicators, channel trend trading Perfect trend-wave automatic calculation channel calculation , MT4 Perfect trend-wave automatic calculation channel calculation , MT5 Local Trading copying Easy And Fast Copy , MT4 Easy And Fast Copy , MT5 Local Trading copying For DEMO Easy And Fast Copy , MT4 DEMO Easy And Fast Copy , MT5
DEMO
砖图 Renko PRO->>>
The display of the brick map on the main map.
The Renko chart ideally r
FREE

YOU CAN NOW DOWNLOAD FREE VERSIONS OF OUR PAID INDICATORS . IT'S OUR WAY OF GIVING BACK TO THE COMMUNITY ! >>> GO HERE TO DOWNLOAD
This system is an Heiken Ashi system based on RSI calculations . The system is a free open source script originally published on TradingView by JayRogers . We have taken the liberty of converting the pine script to Mq4 indicator . We have also added a new feature which enables to filter signals and reduces noise on the arrow signals.
Background
HEIKEN ASHI
Th
FREE

Stop calculating lot sizes manually. Stop guessing your Risk/Reward ratio. The Risk Reward Tool brings the intuitive, visual trading style of TradingView directly to your MetaTrader 5 charts. It is designed for traders who value speed, precision, and visual clarity. Whether you trade Forex, Indices (DAX, US30), or Commodities (Gold, Oil), this tool handles the math for you. Simply click "Long" or "Short," drag the lines to your levels, and the tool instantly tells you exactly how many lots to t

Was: $99 Now: $49 Blahtech Daily Range indicator displays the average daily range alongside the individual session ranges. Using the daily open price as a reference the indicator shows fixed range and dynamic range targets as lines on the charts. These lines clearly show when the average range has been exhausted. Daily and session ranges can be useful for confirming entries or setting targets and is an excellent odds enhancer for many trading systems. Links [ Documentation | Install | U

Dark Breakout is an Indicator for intraday trading. This Indicator is based on Trend Following strategy, providing an entry signal on the breakout. The signal is provided by the arrow, which confirms the breaking of the level. We can enter in good price with this Indicator, in order to follow the main trend on the current instrument. It is advised to use low spread ECN brokers. This Indicator does Not repaint and N ot lag . Recommended timeframes are M5, M15 and H1. Recommended working pairs

Smart Structure Concepts MT5 is an all-in-one Smart Money Concepts indicator created to help traders visually read institutional structure and understand why each movement occurs. Unlike most indicators on the Market, this system does not only draw patterns or zones. It teaches.
Every visual element (BOS, CHoCH, OB, FVG, EQH, EQL, PDH, PDL, etc.) includes educational tooltips that explain the concept and the suggested trader action (buy, sell, or wait).
These on-chart explanations make it perfe
FREE

Synthetic Trend AI—a smart trend indicator powered by artificial intelligence The Synthetic Trend AI indicator is a powerful technical analysis tool that combines the classic SuperTrend formula with artificial intelligence algorithms (k-Nearest Neighbors, KNN) and volume analysis. It is designed for those who want to see the market deeper and make more confident decisions.
What makes Synthetic Trend AI unique: AI trend forecasting: Uses the KNN algorithm to analyze historical data and predict
FREE

This is a Market Depth (DOM - Depth of Market) Indicator for MetaTrader 5 that displays real-time order book data in a visual ladder format. The DOM provides a comprehensive view of market depth with clear visual cues for volume imbalances, making it useful for both scalping and swing trading decisions This indicator provides traders with a professional-grade market depth visualization that can be customized to match individual trading preferences and strategies. You can easily switch betwe
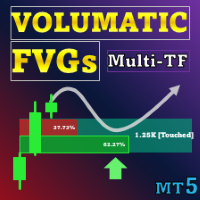
Special offer : ALL TOOLS , just $35 each! New tools will be $30 for the first week or the first 3 purchases ! Trading Tools Channel on MQL5 : Join my MQL5 channel to update the latest news from me Volumatic Fair Value Gaps (FVG) identifies and maintains meaningful price-imbalance zones and decomposes directional volume within each gap. Volume is sampled from a lower timeframe (default M1, user-selectable), split into Buy vs. Sell shares, and rendered as two percentage bars whose s

Special offer : ALL TOOLS , just $35 each! New tools will be $30 for the first week or the first 3 purchases ! Trading Tools Channel on MQL5 : Join my MQL5 channel to update the latest news from me This indicator plots breakout detection zones, referred to as “Smart Breakout Channels”, which are based on volatility-normalized price movement. These zones are shown as dynamic boxes with volume overlays. The tool detects temporary accumulation or distribution ranges using a custom nor

Trend BB MACD with ADX Filter The Trend BB MACD with ADX Filter is an advanced technical tool that combines Bollinger Bands (BB) , MACD , and the Average Directional Index (ADX) . It now incorporates a complete directional analysis system with +DI and -DI , as well as cross-confirmation options with MACD. This tool is designed to provide precise and filtered trading signals, optimized for scalping , intraday, and swing trading. It helps identify not only the direction but also the strength and r
FREE

The Magic Histogram MT5 indicator is a universal tool, suitable for scalping and medium-term trading. This indicator uses an innovative formula and allows you to determine the direction and strength of the trend. Magic Histogram MT5 is not redrawn, so you can evaluate its efficiency using history data. It is most suitable for M15, M30, H1 and H4. Magic Histogram for the MetaTrader 4 terminal : https://www.mql5.com/en/market/product/23610 Indicator Benefits Excellent indicator signals!

What is this indicator? This indicator is for comparing multiple charts and verifying the chart pattern. Synchronize each chart position with the common vertical line. By changing the chart mode, you can also display the chart like a real trade.
How to set up
1. Scroll the chart of the target currency pair to the end in the past direction and download all the historical data of that currency pair. 2. Install this indicator in the main window of each chart. 3. Customize each parameter on the In

The Breakout Finder (BF) is a powerful MetaTrader 5 indicator designed to detect potential breakout and breakdown opportunities in price action. By analyzing pivot highs and lows over a user-defined period, it identifies consolidation zones where price has repeatedly tested resistance or support levels within a narrow channel. When price breaks out of these zones with sufficient confirmation (based on the minimum number of tests and channel width threshold), the indicator visually highlights th
FREE

MTF WAD Simplified Indicator - Professional Trading Solution Overview The MTF WAD Simplified is a sophisticated multi-timeframe volume-based indicator designed to track smart money flow across financial markets. By monitoring the Williams Accumulation/Distribution (WAD) across 8 different timeframes, this tool provides traders with unprecedented insight into institutional accumulation and distribution patterns. Core Benefits for Traders 1. Smart Money Tracking - Detect Institutional

简介: 六彩神龙指标【MCD Hot Money】进是一种常用的技术指标,被广泛应用于股票交易中。它由六人不同的指标组成,包括均线、相对强弱指标井、移动平均收盘线等。这人指标可以有效地帮助投资者确定股票的买入和卖出时机。 六彩神龙用来看筹码了解庄家动向。看个股买卖少踩炕,少被套;跟庄吃肉,用于判断个股趋势!
指标设置 : hot_money_sensitivity = 0.7; // Hot Money Sensitivity hot_money_period = 40; // Hot Money Period hot_money_base = 30; // Hot Money Base banker_sensitivity = 1.5; // Banker Sensitivity banker_period = 50; // Banker Period banker_base = 50;

The MTF Candlestick Patterns Detector indicator is a comprehensive Momentum & Trend Intelligence System designed to strip away market noise and provide institutional-grade clarity for retail traders. It specializes in high-probability signal detection by merging price action geometry with temporal confluence. Here is why this tool is a game-changer for your trading desk: Core Functionalities · Automated Candlestick Pattern Recognition: The indicator scans for high-alpha patterns (like E

Gann 9+ Indicator Introduction The "Gann Matrix Chart" is the most simple and clear technical analysis in Gann theory, which is the calculation tool that Gann has always been committed to using. It is the essence of Gann's whole life. The Gann 9+ indicator uses the matrix chart to find the future high or low points of stocks or futures. Indicator Input: The base and step size can be set as 1 by default; When the multiple is -1, the multiple will be automatically obtained, or it can be filled in

Step into the world of Forex trading with confidence, clarity, and precision using Gold Indicator a next-generation tool engineered to take your trading performance to the next level. Whether you’re a seasoned professional or just beginning your journey in the currency markets, Gold Indicator equips you with powerful insights and help you trade smarter, not harder. Built on the proven synergy of three advanced indicators, Gold Indicator focuses exclusively on medium and long-term trends elimina

INSTRUCTIONS RUS / INSTRUCTIONS ENG - Version MT4 Main functions: Displays active zones of sellers and buyers! The indicator displays all the correct first impulse levels/zones for purchases and sales. When these levels/zones are activated, where the search for entry points begins, the levels change color and are filled with certain colors. Arrows also appear for a more intuitive perception of the situation. LOGIC AI - Display of zones (circles) for searching entry points when acti

Overview The Smart Money Structure Markup Indicator for MetaTrader 5 is a powerful tool designed to help traders identify key market structures based on popular Smart Money Concepts (SMC) strategies. This indicator detects micro-market structures, providing insights into price movements and potential trend changes. It highlights important elements such as valid Break of Structure (BOS), Change of Character (CHoCH), and Inducement (IDM), helping traders to make informed decisions. Key Features Ma
FREE

This indicator provides several drawing tools to assist in various methods of chart analysis.
The drawings will keep their proportions (according to their handle trendline) across different chart scales, update in real time, and multiple drawings are supported.
#
Drawing Option
Description
1 Grid box draggable boxed grid, user defines rows x colums, diagonal ray option 2 Grid partial or fullscreen grid, sized by handle line 3 Grid flex a diagonal grid, sized and sloped by handle line
4 Cyc

Opening‑Range Sessions (GMT‑Aware) is a lightweight indicator that automatically draws the opening range — high, low, and a color‑filled box — for the main FX liquidity windows: Sydney, Tokyo, London and New York .
The indicator detects your broker‑server time‑zone on the fly, so every session starts at the correct local moment, no matter where the server (or the trader) is located. Key features Automatic Time‑Zone Detection – Uses the server’s GMT offset; no manual time adjustment required when
FREE

Market makers' tool. The indicator analyzes volume from every point and calculates exhaustion market levels for that volume. ( This is a manual indicator and contains features that may not supported by the MetaTrader current testing environment ) Meravith main lines:
- Bullish volume exhaustion line - serves as a target.
- Bearish volume exhaustion line - serve as a target.
- A line indicating the market trend. It changes color depending on whether the market is bullish or bearish and serves

The Quantum VPOC indicator has been developed to expand the two dimensional study of volume and price, to a three dimensional one which embraces time. The volume/price/time relationship then provides real insight to the inner workings of the market and the heartbeat of sentiment and risk which drives the price action accordingly. The Quantum VPOC indicator displays several key pieces of information on the chart as follows: Volume Profile - this appears as a histogram of volume on the vertical pr

ZenTrend — Adaptive Trend Indicator for MetaTrader 5 ZenTrend is an innovative trend indicator for MetaTrader 5 that plots a flexible and informative trend line on the chart, based on adaptive moving average calculations. This tool is ideal for traders seeking precise and timely identification of trend direction on any financial market: forex, stocks, indices, cryptocurrencies, and commodities. Key Features of ZenTrend 1. Four Types of Moving Averages Supported
ZenTrend allows you to choose fro

Overview
The Volume SuperTrend AI is an advanced technical indicator used to predict trends in price movements by utilizing a combination of traditional SuperTrend calculation and AI techniques, particularly the k-nearest neighbors (KNN) algorithm.
The Volume SuperTrend AI is designed to provide traders with insights into potential market trends, using both volume-weighted moving averages (VWMA) and the k-nearest neighbors (KNN) algorithm. By combining these approaches, the indicator

Haven HTF Candle — The Power of the Higher Timeframe on Your Chart Introducing Haven HTF Candle — a powerful tool that displays candles from a higher timeframe (HTF) directly on your main chart. Stop constantly switching between windows and start seeing the true market context, which is the foundation for making well-informed trading decisions. Other products -> HERE . Key Features and the "Power of 3" Concept Analysis based on the "Power of 3" (AMD) concept: The indicator clearly displays the
FREE

Institutional Tick Engine Lite: Tick Velocity & Reversal Tool Institutional Tick Engine Lite is a technical indicator designed to analyze market velocity and micro-structure logic using raw tick data. As the entry-level version of the professional market analysis suite, it processes real-time tick data to provide metrics for scalping and day trading, offering an alternative to traditional lagging indicators. Included Features Tick Velocity Monitor: Real-time histogram displaying "Ticks Per Secon
FREE

For those who struggle with overbloated Volume Profile/Market Profile indicators, here is a solution that contains only the Point of Control (POC) information. Super-fast and reliable, the Mini POC indicator presents this vital information visually within your chart. Totally customizable in splittable timeframes, type of Volume, calculation method, and how many days back you need.
SETTINGS Timeframe to split the POCs within the day. Volume type to use: Ticks or Real Volume. Calculation method .
FREE

Candle Time CountDown By BokaroTraderFx The Candle Timer Countdown Indicator is a versatile tool designed for the MetaTrader 5 (MT5) trading platform. It provides traders with a visual countdown of the remaining time for the current candle on a chart. The key features include:
Customizable Position: Place the countdown timer in any corner of the chart for optimal visibility. Default Text Color: Set to red for clear visibility, with options for further customization. Minimal Display: Shows only
FREE

Why Most RSI Divergence Indicators Are Either Delayed or Repainting If you have tested enough divergence indicators, you ’ ve probably seen one of these two problems: Either the divergence appears very late, or the divergence suddenly disappears. This is not because an indicator is “ poorly coded ” . It comes from a fundamental trade-off in how divergence itself is calculated. If you want divergence signals to appear immediately, you usually have to accept repainting. If you want absolu
FREE

Entry Point M5 — a complete trading system. Entry Point M5 is a powerful indicator designed as a fully functional trading system suitable for any currency pair. It analyzes the price structure, identifying key moments of market reversals and the emergence of new impulses. The indicator can adapt to different market phases — from strong trending movements to sideways ranges — providing visually clear signals without the need for additional filters or auxiliary tools. Trading with this system is e

trend,trend analysis,trend following,signals,alerts,trading panel,dashboard,market context,scalping,day trading,intraday,swing trading,non repaint,no repainting,risk management,risk reward,support resistance,supply demand,buy sell pressure,forex,crypto,multi timeframe
QuantumTrade Panel is an advanced indicator for MetaTrader 5 designed to provide complete real-time market context, bringing together essential information such as trend direction, equilibrium zones, buying and selling pressure, a
FREE
Day Direction Scanner is an indicator that uses the direction of the current candlestick on the 1-Day, 4-Hour, 1-Hour, 15-Minute, and 5-Minute periods to determine the market's direction. When all the candlesticks converge in a single direction, the indicator indicates whether the day is bullish or bearish, or if there is no clear direction. It is useful for easily getting an idea of the market's direction during the day.
Features:
- Works on all currency pairs, indices, and commodities.
- F
FREE

Welcome to our Price Wave Pattern MT5 --(ABCD Pattern)-- The ABCD pattern is a powerful and widely used trading pattern in the world of technical analysis.
It is a harmonic price pattern that traders use to identify potential buy and sell opportunities in the market.
With the ABCD pattern, traders can anticipate potential price movements and make informed decisions on when to enter and exit trades. EA Version: Price Wave EA MT5
MT4 Version : Price Wave Pattern MT4
Features :
Automatic
FREE

The Clean Trading Sessions indicator shows the most significant trading sessions for the Forex market, such as London, New York, Tokyo. The Clean Trading Sessions indicator is a simple and, at the same time, quite functional Forex sessions indicator, developed for the MT5 terminal. It is available to download for free.
How is this Forex market session indicator used? Traders normally use trading sessions to determine the volatile hours throughout the day, since the trading activities vary
FREE
Enhance your price action trading with the Higher Highs and Lows MT5 indicator, a robust tool that leverages fractal analysis to pinpoint key swing points and identify trend-defining patterns like Higher Highs (HH), Lower Highs (LH), Lower Lows (LL), and Higher Lows (HL) for clear insights into market direction. Drawing from foundational price action principles rooted in Dow Theory from the early 1900s and popularized in modern trading by experts like Al Brooks in his "Trading Price Action" seri
FREE

Multi-Timeframe Trend Analysis Tool Want to track trends across multiple timeframes without constantly switching charts? Smart Trend Consensus MT5 is a technical analysis tool that consolidates data from 7 timeframes simultaneously (M1, M5, M15, M30, H1, H4, D1). The indicator uses 7 technical criteria to evaluate trend status on each timeframe and displays all information on a visual dashboard. A multi-dimensional analysis tool that helps traders save time monitoring markets. User Gui

non-repaint free MT5 technical indicator works on all timeframes 1 minute to the monthly timeframe the trade vision buy and sell arrow is a multi currency and synthetic indicator Trade vision buy and sell arrow comes with Push Alerts purple arrow look for selling opportunities white arrow look for buying opportunities. wait for candle to close and arrow to appear before taking any trades.
FREE

Royal Scalping Indicator is an advanced price adaptive indicator designed to generate high-quality trading signals. Built-in multi-timeframe and multi-currency capabilities make it even more powerful to have configurations based on different symbols and timeframes. This indicator is perfect for scalp trades as well as swing trades. Royal Scalping is not just an indicator, but a trading strategy itself. Features Price Adaptive Trend Detector Algorithm Multi-Timeframe and Multi-Currency Trend Low
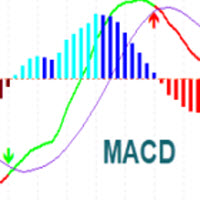
MACD Indicator It has MACD line, Signal line, and Histogram. The Histogram has 4 colors based on Direction Above and Below the Zero Line, showing its movement direction as simple as possible. Allows Show MACD & Signal Line, Show Change In color of MACD Line based on cross of Signal Line. Show Dots at Cross of MacD and Signal Line, Turn on and off Histogram. Enjoy your trading experience, and feel free to share your comments and reviews.
If you are interested in this indicator, you might be i
FREE

Pivot Points Indicator that calculates essential support and resistance levels for day traders and swing traders. Ideal for identifying reversal points, setting targets, and managing risk on any timeframe. For Day Traders
Identifies key levels for entries and exits Defines stop-loss and target levels Recognizes potential intraday reversals For Swing Traders
Identifies weekly/monthly support and resistance zones Plans medium-term positions Complements trend analysis For Scalpers
Fast reference
FREE
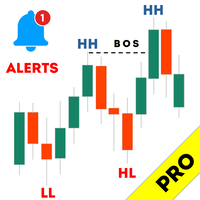
Haven Market Structure PRO - Your Professional Market Analyst Introducing Haven Market Structure PRO – this is not just an indicator, but a complete system for automating the analysis of price movement, based on the key concepts of Price Action and Smart Money. This PRO version was created for traders who want to gain maximum control over the chart and see the full market picture. Other products -> HERE . Understanding market structure is the foundation of profitable trading. The indicator a
+++++++++++++++++++++++++++++++++++++++++++++++++++++++++++++++++++++++++++++++++++++++++++++++++ +++ Link to EURUSD Only Free Version --> https://www.mql5.com/en/market/product/156904?source=Unknown +++++++++++++++++++++++++++++++++++++++++++++++++++++++++++++++++++++++++++++++++++++++++++++++++ Hallo Trader, This is a traditional GANN & FIBONACCI strategy based on detection of an impulsive move in the opposite direction. This is called a Breakout. At the moment of Breakout, the indicator draw

SmartScalp M1 – Fast Scalping with Accurate Trends and Clean Signals SmartScalp M1 is a high-speed scalping indicator optimized specifically for the M1 timeframe. It combines Supertrend and Heiken Ashi to identify clear trend reversals and effectively filter market noise. BUY and SELL signals are generated when the Supertrend flips and are confirmed by Heiken Ashi candle colors, significantly reducing false signals in choppy market conditions. The indicator performs best on high-volatility ins

Most “Instant RSI Divergence” Signals Are Wrong If you have used RSI divergence indicators before, you have probably experienced this:
a divergence appears in real time, looks convincing at first,
and then disappears a few candles later.
When you look back at the chart, the historical signals no longer match what you originally saw. This is not a user error.
It is a logical problem. Divergence that is not based on confirmed swing highs or swing lows is inherently unstable. If you are looking for
FREE

Trend Line Map indicator is an addons for Trend Screener Indicator . It's working as a scanner for all signals generated by Trend screener ( Trend Line Signals ) . It's a Trend Line Scanner based on Trend Screener Indicator. If you don't have Trend Screener Pro Indicator, the Trend Line Map Pro will not work. LIMITED TIME OFFER : Trend Line Map Indicator is available for only 50 $ and lifetime. ( Original price 125$ )
By accessing to our MQL5 Blog, you can find all our premium indicat
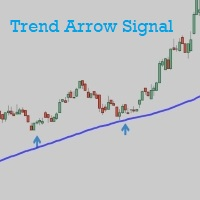
Trend Arrow Signal gives buy/sell signals and alerts with up and down arrow at potential reversal of a pullback or a trend continuation pattern. As the name indicated, this is an indicator which gives signals based on trend => It works best in trend market with the principle is to ride on the trend not trade against the trend. The main trend is determined by EMA 50 and can be changed manually to suit your preference. Trend arrow signal can work on all time frames. It gives signal at close of th
FREE

L'indicatore "Heikin Ashi" è stato progettato per migliorare l'analisi dei grafici finanziari con un sistema di candele Heikin Ashi. Le candele Heikin Ashi sono un metodo avanzato per visualizzare il prezzo, che aiuta a filtrare il rumore del mercato, rendendo più chiara l'interpretazione dei trend e migliorando la qualità delle decisioni di trading. Questo indicatore consente di visualizzare le candele Heikin Ashi al posto delle candele giapponesi tradizionali, rendendo l'analisi grafica più pu
FREE
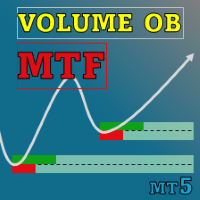
Special offer : ALL TOOLS , just $35 each! New tools will be $30 for the first week or the first 3 purchases ! Trading Tools Channel on MQL5 : Join my MQL5 channel to update the latest news from me The Volumetric Order Blocks Multi Timeframe indicator is a powerful tool designed for traders who seek deeper insights into market behavior by identifying key price areas where significant market participants accumulate orders. These areas, known as Volumetric Order Blocks, can serve as

If you like this free tool, check out my EA which is currently on a Launch Sale for only $39 ! https://www.mql5.com/zh/market/product/159451?source=Site Short Description: A specialized technical indicator designed for Gold (XAUUSD) trading. It automatically identifies market swings, plots key 0.382 and 0.618 Fibonacci retracement levels, and sen mobile push nothiations not sat 面紙 面 面 面面 筆/內托are detected. 【Key Features】 Dual Monitoring Mode: Simultaneously tracks the 0.382 (Shallow Retracement)
FREE
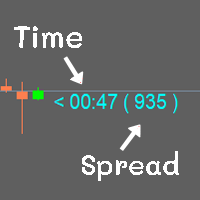
Show the time of candlesticks and spread. All data will be displayed in a rod. Can change color Can fix the size as needed
MT4 : Link https://www.mql5.com/en/market/product/102742 MT5 : Link https://www.mql5.com/en/market/product/102834
Most free code on various websites I didn't write it myself. I only do a little bit.
If you like it, please give 5 stars with it. Thank you.
FREE

MACD divergence indicator finds divergences between price chart and MACD indicator and informs you with alerts (popup, mobile notification or email) . Its main use is to find trend reversals in the chart. Always use the divergence indicators with other technical assets like support resistance zones, candlestick patterns and price action to have a higher possibility to find trend reversals. Three confirmation type for MACD divergences: MACD line cross zero level Price returns to previous H/L Crea
FREE

Was: $69 Now: $49 Blahtech VWAP - Volume Weighted Average Price (VWAP) is the ratio of price to total volume. It provides an average price over a specified time interval. Links [ Install | Update | Documentation ] Feature Highlights
Configurable VWAP Line Sessions, intervals, anchored or continuous Previous day settlement line Standard Deviation bands Alerts at bar close or real time Automatic Broker or Tick volumes Significantly reduced CPU usage
Input Parameters
Expert Advisor Mo

This indicator automatically identifies market structure and plots Fibonacci retracement levels in real time.
It detects key swing highs and lows to mark structural points such as higher highs, higher lows, lower highs, and lower lows, helping traders quickly understand trend direction and structural shifts.
Based on the detected structure, the indicator dynamically draws Fibonacci levels, allowing traders to easily spot potential retracement, pullback, and entry zones without manual drawing.
Orderflow Scalp Pro v2.4 delivers institutional-grade trading intelligence through advanced volume analysis, dynamic VWAP calculations, real-time aggressive score monitoring, and precision arrow signals. This complete trading system transforms complex market data into clear, actionable signals for consistent profitability on 3-4 minute timeframes.
Full Documentation: [Download PDF] Four Powerful Components in One System Volume Profile HeatMap with POC/VAH/VAL Transform your charts into inst

Improved version of the free HMA Trend indicator (for MetaTrader 4) with statistical analysis. HMA Trend is a trend indicator based on the Hull Moving Average (HMA) with two periods. HMA with a slow period identifies the trend, while HMA with a fast period determines the short-term movements and signals in the trend direction.
The main differences from the free version: Ability to predict the probability of a trend reversal using analysis of history data. Plotting statistical charts for analyzi

Smart Money Breakout Channels Indicator
The Smart Money Breakout Channels indicator is a powerful technical analysis tool designed to identify potential breakout opportunities in financial markets by detecting consolidation channels based on price volatility. Built for MetaTrader 5 (MT5), it overlays dynamic channels on the price chart, highlighting areas of low volatility that often precede significant price movements. This indicator is inspired by smart money concepts, focusing on institution
FREE
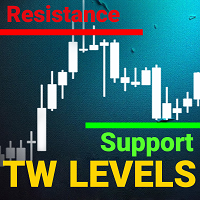
support resistance levels indicator mt5: This tool is a multi-timeframe indicator that identifies and plots support and resistance lines, as well as Fibonacci levels, on a chart with the same accuracy as the human eye. TW support and resistance levels for forex has complex algorithm that scans the chart to identify previous levels of price stabilization and rebounds, recording the number of touches.
Are you tired of manually drawing support and resistance levels and Fibonacci retracements? Che

Introduction
Reversal Candles is a cutting-edge non-repainting forex indicator designed to predict price reversals with remarkable accuracy through a sophisticated combination of signals.
Signal Buy when the last closed candle has a darker color (customizable) and an up arrow is painted below it Sell when the last closed candle has a darker color (customizable) and a down arrow is painted above it
FREE

A top-quality implementation of the famous Super Trend indicator, which needs no introduction. It is completely loyal to the original algorithm, and implements many other useful features such as a multi-timeframe dashboard. [ Installation Guide | Update Guide | Troubleshooting | FAQ | All Products ] Easy to trade It implements alerts of all kinds It implements a multi-timeframe dashboard It is non-repainting and non-backpainting Input Parameters
ATR Period - This is the average true range peri
FREE
The MetaTrader Market is the best place to sell trading robots and technical indicators.
You only need to develop an application for the MetaTrader platform with an attractive design and a good description. We will explain you how to publish your product on the Market to offer it to millions of MetaTrader users.
You are missing trading opportunities:
- Free trading apps
- Over 8,000 signals for copying
- Economic news for exploring financial markets
Registration
Log in
If you do not have an account, please register
Allow the use of cookies to log in to the MQL5.com website.
Please enable the necessary setting in your browser, otherwise you will not be able to log in.