Watch the Market tutorial videos on YouTube
How to buy а trading robot or an indicator
Run your EA on
virtual hosting
virtual hosting
Test аn indicator/trading robot before buying
Want to earn in the Market?
How to present a product for a sell-through
Technical Indicators for MetaTrader 5 - 41
A comprehensive MT5 trading performance indicator designed to provide real-time analytics of your trading activity on chart.
Key Features: - Dual tracking modes: Chart Symbol or Magic Numbers - Customizable display with toggle options for each metric - Adjustable font size for better visibility - Real-time updates with color-coded results
Performance Metrics: - Total Profit/Loss: Track overall performance - Total Trades: Monitor trading frequency - Win Rate: Measure trading success percentage
FREE

Probability emerges to record higher prices when RVi breaks out oscillator historical resistance level. It's strongly encouraged to confirm price breakout with oscillator breakout since they have comparable effects to price breaking support and resistance levels; surely, short trades will have the same perception. As advantage, a lot of times oscillator breakout precedes price breakout as early alert to upcoming event as illustrated by last screenshot. Furthermore, divergence is confirmed in
FREE
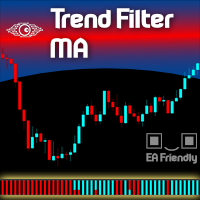
One of the best tools category for an Expert Advisor is the Filtering System . Using a filter on your entries will take your metrics to the good side. And even when you trade manually a filtering system is more than welcome. Let us present a commonly used filtering system based on Exponential Moving Averages - in fact, you can choose the type of the MAs as you wish and also mix them all up - we called this indicator Filter Trend MA . We present this indicator as a colored strip you can use at th

This indicator shows ratios between extremes on the chart. You can specify your own ratios (e.g. Fibonacci).
Parameters Most important Density - how much in details to search ratios in extremes. Bigger number means less details, smaller number means more details. Base unit is 1 bar on the chart. History - how far to go in history while searching. When you set -1, the indicator processes all bars from history. Base unit is 1 bar on the chart. Range - how far search ratios from given extreme. Bas
FREE
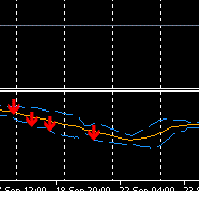
How the Sell Signal Works 1. Bollinger Band condition The current candle must close at or above the Upper Bollinger Band . This signals potential overbought conditions. 2. OBV confirmation (On Balance Volume) OBV must be falling → OBV_now < OBV_prev . Stronger confirmation: OBV decreasing for 2–3 consecutive bars. This shows that buying pressure is weakening . 3. ATR filter (Average True Range) Current ATR must be below its moving average (e.g., ATR_now < ATR_SMA(14) * 1.2 ). Purpose: avoid ente
FREE
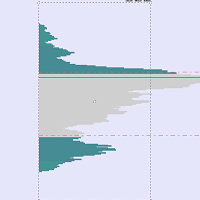
IMPORTANT NOTICE – LICENSE & ACTIVATION REQUIRED
Activation Instructions:
Upon completing your purchase, please contact us immediately to receive your license key, password, or activation details . Without these, the software will not function. We are here to ensure a seamless activation process and assist you with any questions. Multilingual Customization
To enhance your trading experience, we offer full customization of the software in multiple languages. Our team can provide tra
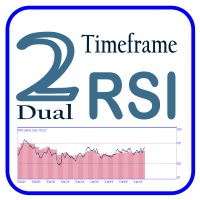
Dual Time Frame RSI with Custom Alerts & Visuals Dual Time Frame RSI is an advanced RSI (Relative Strength Index) indicator designed for traders who want to monitor multiple timeframes simultaneously and customize alerts and visuals for better trading decisions. This tool allows you to combine two RSI readings from different timeframes, helping you identify stronger trends and overbought/oversold conditions across multiple time horizons. Key Features: Two Timeframes : The lower timeframe is alwa
FREE

AliPivot Points is a Meta Trader 5 Indicator that draws you the latest pivot points. You can choose from timeframes ranging from 1 Minute to 1 Month. Calculation methods for pivot points includes: Classic Pivot Points Camarilla Pivot Points Fibonacci Pivot Points Woodie Pivot Points You can personalize the line colors, style, and width to suit your preference. The indicator displays values on the right side of the chart. AliPivot Points values can also be utilized by developers for creating Expe
FREE

The DailyWeeklyMarkers indicator helps traders visualize trading weeks by clearly marking the start of each day and week on the chart. It draws vertical separator lines for each day (including weekends if enabled) and highlights the beginning of new trading weeks with double lines for better clarity. This makes it easier to analyze price action within daily and weekly contexts. Who Is This Indicator For? Swing Traders – Helps identify weekly opening gaps and key levels. Day Traders – Vis
FREE

CandleCountdown Indicator — Overview This indicator displays a live countdown timer for the current candle on your chart, updating every second. It’s designed to be visually intuitive, resilient across timeframes, and smartly formatted for clarity.
Core Features • Real-Time Countdown Shows how much time remains until the current candle closes, updating once per second. • Smart Time Formatting Adapts the display based on remaining time: • → shows just seconds (e.g., ) • → shows (e.g., ) •
FREE

ATLogic Indicator: A Versatile Tool for All Trading Instruments
ATLogic is a comprehensive and user-friendly technical analysis tool designed for a wide range of financial instruments, including all currency pairs, indices, and cryptocurrencies. This versatile indicator offers traders powerful insights across various markets:
Leave a massage after purchase and receive a special bonus gift.
"DM me to connect with my AI tutor and learn how to use this indicator more effectively!"
Key Feature

Highly configurable OBV indicator.
Features: Highly customizable alert functions (at levels, crosses, direction changes via email, push, sound, popup) Multi timeframe ability Color customization (at levels, crosses, direction changes) Linear interpolation and histogram mode options Works on strategy tester in multi timeframe mode (at weekend without ticks also) Adjustable Levels Parameters:
OBV Timeframe: You can set the lower/higher timeframes for OBV. OBV Bar Shift: Y ou can set the offset
FREE

With this indicator user can determine not just pivot like turning points. User able to spot trading ranges boundaries and support-resistance levels. In a strong trend the reverse signals also gives us excellent entry points. Recommended user settings: In the Attis volume: look back period : 1 or (3) MA_Lenght 99. ( of course one can play with the settings and get tailored signals... as you need)
FREE

Phoenix Moving Average Meter (MT5) Professional moving average trend analysis and visualization tool for MetaTrader 5. Combines intelligent slope analysis, cloud width measurement, and regime classification into a clean, real-time dashboard. Overview Phoenix Moving Average Meter analyzes the relationship between a fast and slow moving average to determine trend direction, strength, and maturity. The indicator continuously monitors MA slope angle, cloud width expansion or contraction, and time s
FREE

TrendView — Clear Trend Visualization for Confident Trading
TrendView is a free trend indicator designed to give traders a clean and reliable view of market direction. It displays clear trendlines in three colors, making it easy to identify bullish, bearish, and neutral phases without cluttering the chart with unnecessary elements. Whether you are monitoring long-term market structure or short-term price action, TrendView helps you keep your focus on the bigger picture. For traders who also w
FREE

Necessary for traders: tools and indicators Waves automatically calculate indicators, channel trend trading Perfect trend-wave automatic calculation channel calculation , MT4 Perfect trend-wave automatic calculation channel calculation , MT5 Local Trading copying Easy And Fast Copy , MT4 Easy And Fast Copy , MT5 Local Trading copying For DEMO Easy And Fast Copy , MT4 DEMO Easy And Fast Copy , MT5 DEMO
Strongly recommend trend indicators, automatic calculation of wave standard and MT5 ver
FREE
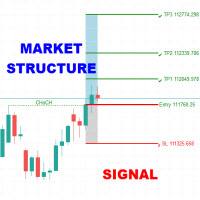
The Market Structure Signal indicator is designed to detect Change of Character (CHoCH) and Break of Structure (BOS) in price action, helping traders identify potential trend reversals or continuations. It combines market structure analysis with volatility (ATR) to highlight possible risk/reward zones, while also supporting multi-channel alerts so that no trading signal is missed. Interpretation Trend Analysis : The indicator’s trend coloring, combined with BOS and CHoCH detection, provides an i

Стратегия форекс «Гора» основана на одном довольно сложном индикаторе. С его помощью генерируются вполне неплохие сигналы и, в принципе, автор указывал возможность торговли и на остальных инструментах, однако, мы решили взять изначальный вариант — торговлю только по GBP/USD. Так же следует сказать, что по ходу развития тренда торговая стратегия пропускает большое количество неплохих точек входа, но это только на первый взгляд. Фильтрация сигналов показала себя достаточно неплохо и в итоге торгов
FREE

Simple indicator used in technical strategies to analyze tops, bottoms and reversal or continuation points. Developer information:
Line values and colors:
Buffer 0 : ZigZag line value;
Buffer 1 : ZigZag color value;
Buffer 2 : Median line value;
Buffer 3 : Median color value; Buffer to get the values of each top and bottom. Buffer 4 : Top value;
Buffer 5 : Bottoms value;
Buffer that returns the type of the last direction.
Buffer 9: 0 = Not updated, 1 = High, -1 = Low;
This indic
FREE

If you love this indicator, please leave a positive rating and comment, it will be a source of motivation to help me create more products <3 Key Takeaways Bulls Bears Eyes is another version of Laguerre RSI. Use Bull/Bear Power to calculate. One use of the Bulls Bears Eyes is to identify trends. This is done by looking for sustained periods when the indicator is above or below the 0.5 line. Also, a buy signal is generated when the Bulls Bears Eyes line crosses above the 0.15 level, while a s
FREE

Highly configurable Demarker indicator.
Features: Highly customizable alert functions (at levels, crosses, direction changes via email, push, sound, popup) Multi timeframe ability Color customization (at levels, crosses, direction changes) Linear interpolation and histogram mode options Works on strategy tester in multi timeframe mode (at weekend without ticks also) Adjustable Levels Parameters:
Demarker Timeframe: You can set the lower/higher timeframes for Demarker. Demarker Bar Shift: Y ou
FREE

ToolBot Advisor Indicator (RSI, ATR, ADX, OBV) FREE An effective indicator for your negotiations
The toolbot indicator and advisor brings leading (OBV) and lagging (RSI, ATR, ADX) indicators so that you have more security in your negotiations. In addition, it informs you of possible up and down trends as well as providing you with incredible advisors who will give you information about trading opportunities.
With this indicator you will have more security and speed in your decision making of
FREE

The indicator highlights in color the places on the chart where the price moves in one direction continuously from the selected number of candles.
You can specify the number of points from the beginning of the movement to select only movements from this amount.
It can be useful for looking for reversals or sharp impulses.
I also recommend purchasing this utility to determine local weekly / monthly trends and support and resistance lines. https://www.mql5.com/en/market/product/61401
FREE

The Oscar, one of my favorite indicators. This is my enhanced Version of it with more options and better visuals. Many different averaging methods Oscar changes color on signal cross, but not too volatile (3% extra threshold) Adaptable Divisor, higher numbers lead to more signals, due to higher fluctuations. Its a fast but quite accurate trend direction indicator. Play around with the settings and make it match to your setup. GL trading Please follow me on Twitter https://twitter.com/semager and
FREE
Welcome to order block indicator – your complete solution for identifying high-probability zones using order blocks , BOS (Break of Structure) , and CHOCH (Change of Character) .
Designed for precision and speed, this tool gives you the edge in spotting potential reversal and continuation zones just like the pros.
Features : Automatic Order Block Detection: Effortlessly identifies valid bullish and bearish order blocks based on price structure and market behavior. BOS & CHOCH Detection: Buil

TrendMaster Dashboard: Your Comprehensive Trend Analysis Tool The TrendMaster Dashboard is an advanced Expert Advisor (EA) crafted for MetaTrader 5 (MT5), aimed at simplifying and enhancing your trading experience. This powerful tool consolidates multiple technical indicators and price action analysis into a single, user-friendly dashboard, offering clear Buy, Sell, and Reversal signals through a weighted scoring system. Whether you’re new to trading or a seasoned professional, the TrendMaster
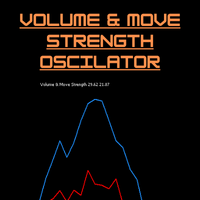
Volume & Move Strength (VMS) Indicator for MT5 The VMS Indicator displays the relationship between trading volume and price movement strength, helping traders assess how well market activity supports price action. How It Works: Measures tick volume as trading activity. Calculates move strength using a normalized True Range (%). Both values can be smoothed (default: 5) and optionally normalized (0–100) for consistency across markets. Plots two lines in a separate window: Blue (Volume) – trading a
FREE
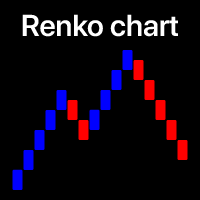
Filter out small price movements and focus on the larger trend . Renko chart indicator will help you to filter out a minor price movements so that you can focus on the overall trend. The price must move a specified amount to create a Renko brick. This makes it easy to spot the current trend direction in which the price is moving. Multifunctional utility : includes 66+ features | Contact me if you have any questions | MT4 version In the settings of the indicator, you can configure: Calcu

This indicator is a zero-lag indicator and displays strength of trend change . True Trend Oscillator Pro works best in combination with True Trend Moving Average Pro that displays exact trend as is. Oscillator value is exact price change in given direction of the trend.
True Trend Moving Average Pro: https://www.mql5.com/en/market/product/103586
If you set PERIOD input parameter to 1 this indicator becomes a sharpshooter for binary options.
Developers can use True Trend Oscillator in Exper
FREE
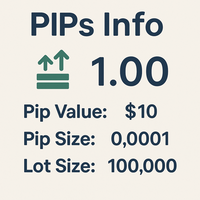
MultiPip Range Label v2 — Lightweight Daily/Weekly/Monthly Pip Stats
MultiPip_RangeLabel_v2 is a zero-plot, ultra-light indicator that prints a compact, draggable text panel with objective range statistics—perfect for order-flow and breakout traders who need quick context without clutter.
No backgrounds, no heavy drawing—just crisp labels you can park anywhere on the chart. The header is draggable; all lines move together.
What it shows
Today – current day’s range (high–low) in pips
Last D
FREE

The indicator displays trend slowdown or possible end of trend and price reversal. The indicator has no parameters. When red bars appear and when they become shorter, we can talk about the approaching end of the downtrend. When green bars become shorter, we can expect the approaching end of the uptrend.
FREE

Time and Price Fractal Studies is an indicator that will help you identify certain patterns that tend to repeat themseleves at certail times of the day or at certain prices. It is used to study Fractal Highs ad Lows in relation to time and price. You will get to answer certail questions like: At what time of day does this market usually turn around. At what price does the market turn. Is it at round numbers etc.
FREE
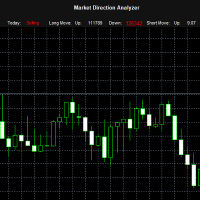
The "Market Direction Analyzer" is a technical indicator designed to provide traders with a comprehensive analysis of market trends, momentum, and potential reversals. By integrating multiple analytical tools, it offers a multi-dimensional perspective on market conditions, aiding in more informed trading decisions.
Using the Market Direction Analyzer in Trading: Trend Confirmation: By analyzing the aggregated sentiment score derived from its components, traders can confirm the prevailing market
FREE

Média Móvel que possui todos tipos de Cálculo comum: Simples Exponencial Suavizada Ponderada Conta com suporte para aplicação sob outros indicadores!
Seu principal diferencial é o esquema de cores em GRADIENTE que, de acordo com a mudança no ângulo da média, altera suas cores conforme demonstrado nas imagens abaixo. Com isso, espera-se que o usuário tenha uma percepção mais suavizada das pequenas alterações.
Bons trades!!
FREE

This indicator is designed based on the Moving Origin indicator
When the moving origin indicator breaks the price, this indicator gives a signal
It is useful for better viewing of signals and analysis on them
Attributes: Can be used in all symbols Can be used in all time frames Too many signals Simple and quick settings Easy way to work
Settings: period: like moving average settings alarmShow: If you want to receive an alert in Metatrader after receiving the signal, enable this setting
alarmS
FREE

This indicator displays the spread with extra options Simple and easy to use and fully customisable: View as Pips or Pipettes Chart symbol can be hidden Text display can be changed Change colour and text styles Add or hide a decimal point Spacing options between inputs Default screen positions Screen position inputs
Pro version includes: Drag and drop box on the screen Add an alert when the spread is too high Alert colours for text and text box changeable
How to use 1. Simply use the default
FREE

This is a derivative of John Carter's "TTM Squeeze" volatility indicator, as discussed in his book "Mastering the Trade" (chapter 11).
Black crosses on the midline show that the market just entered a squeeze ( Bollinger Bands are with in Keltner Channel). This signifies low volatility , market preparing itself for an explosive move (up or down). Gray crosses signify "Squeeze release".
Mr.Carter suggests waiting till the first gray after a black cross, and taking a position in th

Easy Indicators for MT5
A very simple tool to help visualize indicators more easily. Especially usefull if the reference indicator is very subtle or difficult to read.
In this blog you can read about the different types of indicator supported (indicators with color buffer are not available): Zero line crosses Two Line crosses Buffer activations Zero line crosses with filter Crosses with price (MAs) Crosses inside filter
FREE

Global Session 4X Indicator Global Session 4X is a visual indicator that displays active Forex trading sessions around the world in real time. Designed with precision and respect for market diversity, it covers financial hubs such as London, New York, Tokyo, Sydney, São Paulo, Istanbul, Riyadh, Toronto, and more. Each session is shown as a color-coded band highlighting the most traded currency pairs in that region. The layout is clean, modern, and fully customizable — traders can choose which se
FREE

Logarithmic chart in new window You can use both chart as half or full window All features are active in both arithmetic and logarithmic charts Magnet in arithmetic chart is standard metatrader magnet in logarithmic chart magnet have two modes: first mode only select high or low, if this mode is enabled, you can set how many candles will be search before and after to find the highest or lowest points second mode select the closest point of the candle to click, its choose between 4 points (High,
FREE

MT5 Alert Indicator Please add Ema moving averages 60/100/200 & Rsi period 10 levels 30/70 to your chart. This indicator alert on a trend reversal strategy were - ema 60 > 100&200 - ema 100 < 200 And the Rsi is below 30 FOR BUY SIGNAL
Use this strategy in confluence with a larger timeframe trend in the same direction. This strategy identifies great entry opportunities to enter an early trend.
FREE

The euro index (Euro Currency Index, EURX) is an average indicator of changes in the exchange rates of five currencies (US dollar, British pound, Japanese yen, Swiss franc and Swedish krona) against the euro. Displays a Eur X chart in a seperate window below the main chart. YOUR BROKER MUST HAVE THESE SYMBOLS FOR THE INDICATOR TO WORK Based on EUR/USD, EUR/JPY, EUR/GBP, EUR/CHF and EUR/SEK All these pairs must be added to Market Watch for the indicator to work correctly As this is calculated usi
FREE
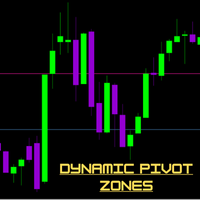
Dynamic Pivot Zones – Your Level Assistant on the Chart This indicator is a bit like a GPS for your trading . It shows you where the price likes to hang out, where it gets nervous, and where it flies through. No more calculating pivots by hand or guessing support and resistance levels. What it does: Automatically plots H1, H4, and D1 pivots . Shows support and resistance zones : R1, R2, S1, S2. Lines are colored and easy to read , so you can instantly see what’s hot or cold. Why you’ll love it:
FREE

Fibonacci Trend Indicator for MT5 Unlock the power of Fibonacci analysis on your MetaTrader 5 charts!
Our Fibonacci Trend Indicator automatically plots dynamic support and resistance levels so you can spot trends, reversals, and breakout opportunities at a glance. Features & Advantages Automatic Fibonacci Levels
Instantly displays seven key Fibonacci retracement levels based on the highest and lowest prices from your chosen lookback period — no manual work required. Dynamic Trend Adaptatio
FREE

The indicator ColorCandlesDaily draw candles with different colors depending on the day of the week.
FREE

This indicator is a very simple indicator that draws candlesticks on a chart. However, it is possible to draw not only on the main chart but also on several sub-charts. In addition,it is possible to draw different symbols and timeframes from the main chart. features. 1. any symbols 2. any timeframes 3. two candle type(normal and heikin ashi) 4. many candle colors(intersection with ma_1) 5. pivot line (ver1.2) In case of positive candle, FULL : change color if low is over ma_1 PARTIAL :
FREE

ATR is a measure of volatility introduced by market technician J. Welles Wilder Jr. in his book, "New Concepts in Technical Trading Systems". In general, traders are accustomed to seeing the ATR in the form of a sub-window indicator. What I am presenting here is a simplified version of ATR - just the current ATR number - very useful for monitoring just the very moment of the current chart. If you want to monitor several timeframes in the same chart, just add the ATR Monitor indicator several tim
FREE

The ICT Unicorn Model indicator highlights the presence of "unicorn" patterns on the user's chart which is derived from the lectures of "The Inner Circle Trader" (ICT) .
Detected patterns are followed by targets with a distance controlled by the user.
USAGE (image 2) At its core, the ICT Unicorn Model relies on two popular concepts, Fair Value Gaps and Breaker Blocks. This combination highlights a future area of support/resistance.
A Bullish Unicorn Pattern consists out of:

//////////////////////////////////////////////// //////////////////////////////////
An improved version of the standard Bulls Power and Bears Power indicators.
Now it's two in one.
The setup is simple - you just need to specify the period. It is also very easy to understand the readings of this indicator, a signal above zero is a buy, and below it is a sell.
//////////////////////////////////////////////// ///////////////////////////////////
I hope this indicator will be very useful to you
FREE
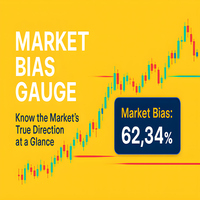
Measure Market Strength at a Glance – Instantly
The Momentum Percentage Label is a sleek, professional tool designed to give traders an instant, crystal-clear view of market momentum – directly on their chart. Forget complex setups or cluttered indicators. This tool delivers a single, powerful metric: the percentage of bullish vs. bearish movement over your chosen period.
Its purpose: to help you instantly gauge whether buyers or sellers are in control, so you can make faster, more confident
FREE

If you have difficulty determining the trend as well as entry points, stop loss points, and take profit points, "Ladder Heaven" will help you with that. The "Ladder Heaven" algorithm is operated on price depending on the parameters you input and will provide you with signals, trends, entry points, stop loss points, take profit points, support and resistance in the trend That direction.
Helps you easily identify trends, stop losses and take profits in your strategy! MT4 Version: Click here Fea
FREE

The indicator is based on the relationship between two sets of Stochastic lines. The first set consists of 6 Stochastic with periods: 5, 8, 10, 12, 14, 16. The second set consists of 6 Stochastic with periods: 34, 39, 44, 50, 55, 60. These periods are customizable. Input parameters Stochastic MA Method Method of calculation ===== Short-term ===== Stochastic #1 %K Period Stochastic #2 %K Period Stochastic #3 %K Period Stochastic #4 %K Period Stochastic #5 %K Period Stochastic #6 %K Period Short
FREE

The indicator draws a normal chart by coloring it in colors based on prices calculated by the Heiken Ashi indicator algorithm.
That is, the shape of the candles does not change.
In fact, this is the same Heiken Ashi that does not distort the price chart.
Then there will be a drawing of a cat, because there is nothing more to write about the indicator. .
FREE

Points of Inertia is a powerful tool for detecting critical points of price movement, based on the idea of calculating the inertia of price fluctuations.
_________________________________
How to use the indicator signals:
The indicator generates a signal after a new price bar appears. It is recommended to use the generated signal after the price breaks through the critical point in the specified direction. The indicator does not redraw its signals.
_________________________________
The in
FREE

This indicator implements the original “ Average True Range (ATR) ” developed by John Welles Wilder Jr. , as described in his book— New Concepts in Technical Trading Systems [1978] . It uses Wilder’s moving average , also known as the smoothed moving average (SMMA) , instead of a simple moving average (SMA) as used on MetaTrader’s built-in ATR indicator. The default period applied is 7, instead of 14, as per the description in his book.
FREE

BBTrend is a powerful trend analysis tool designed to provide a clear overview of market volatility and trends at a glance.
This indicator calculates the difference between two Bollinger Bands of different periods,
visually indicating the strength of upward or downward trends to traders. Clear Trend Visualization: The upward trend is represented in green, and the downward trend in red,
allowing traders to intuitively grasp the direction and strength of the trend. Standardized Percentage Disp
FREE
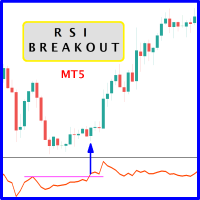
The likelihood of farther price movement increases when Relative Strength Index oscillator "RSI" breaks through its historical resistance levels in conjunction with prices breakout of resistance levels. It's strongly encouraged to confirm price breakout with oscillator breakout since they have comparable effects to price breaking support and resistance levels; similar perception is applied to short trades. Concept is based on find swing levels which based on number of bars by each side to confir
FREE

The indicator is designed for displaying the following price levels on the chart: Previous day's high and low. Previous week's high and low. Previous month's high and low. Each of the level types is customizable. In the indicator settings, you set line style, line color, enable or disable separate levels.
Configurations ----Day------------------------------------------------- DayLevels - enable/disable previous day's levels. WidthDayLines - line width of daily levels. ColorDayLines - line
FREE

Moving Average 4 TimeFrames
Display 4 moving averages of 4 different timeframes on the same chart. In order not to pollute the chart, the indicator will plot the complete average only in the current timeframe of one of the 4 registered averages, for the other timeframes of registered averages the indicator only displays a part of the average so that you know where it is at that time graphic.
Example:
Display on the 5-minute chart where the 200-period arithmetic moving average of the 5 minute
FREE

The idea behind this indicator is to find all currency pairs that are over-bought or over-sold according to the RSI indicator at one go.
The RSI uses the default period of 14 (this can be changed in the settings) and scans all symbols to find the RSI level you will have specified. Once currency pairs that meet the specification are found, the indicator will open those charts for you incase those charts aren't open and proceed to write the full list of currencies on the experts tab.
FREE

O Afastamento da Média Móvel, é uma poderosa ferramenta de análise técnica projetada para fornecer uma representação visual do afastamento entre o preço atual e uma média móvel específica. Este indicador, desenvolvido para o MetaTrader, oferece aos traders uma perspectiva clara das mudanças na dinâmica de preço em relação à tendência de médio prazo.
Versão MT4: https://www.mql5.com/pt/market/product/111705
FREE

Eldry extreme is an efficient oscillator that gives good entries points. Similar to stochastic but more powerful. Follow trends with high accuracy signals giving by crossover. Makes your tades positions with more confidence. Adaptable to all timeframes and charts.Just paste the file into MQL5/Indicators on mt5 and enjoy. Don't hesitate to contact me.
FREE

Trading setup could be a simple thing.
Triple Moving Average is a popular trading strategy to analyze market trends. It provides clear signals for identifying uptrends and downtrends based on the relative positioning and crossovers of short-term, medium-term, and long-term. Comparing Triple MA of two different time frame, provide a comprehensive look of price movement.
FREE

Overview? The **Pivot Points On Custom Timeframe** indicator for MetaTrader 5 calculates and displays traditional pivot levels (P, S1–S3, R1–R3) based on a higher timeframe of your choice, regardless of the current chart's timeframe. It is designed to help traders identify potential support and resistance zones using classic pivot formulas, calculated from user-defined periods such as D1, W1, H4, etc.
This indicator can optionally show price labels and trigger alerts when price crosses the piv
FREE

The Candle Smoother is an indicator for MetaTrader 5 that helps you see price movements more calmly and clearly. It removes unnecessary "market noise" and displays the true trend more effectively.
What does the "Candle Smoother Indicator" do?
It smooths the classic candlestick data (Open, High, Low, Close). This filters out chaotic, hectic candles. Additionally, an EMA line (Exponential Moving Average) is calculated based on the smoothed prices. This helps you better recognize where the market
FREE

The Bolliger Bands On-Off let you control the indicator using the keyboard or a button . You can choose if you want the indicator always shown or always hided while switching among different time frames or financial instruments . ---> This indicator is part of Combo Indicator OnOff
The Bollinger Bands identify the degree of real-time volatility for a financial instruments . A lower amplitude corresponds to a low volatility, conversely a greater bandwidth corresponds to high volatility.
FREE

Supply Demand Ribbon is an indicator with moving supply and demand lines that help you identify price zones more easily. The indicator helps you determine flexible entry, stop loss, and take profit areas. There are also strategies for algorithmically changing ribbon colors. From there you can come up with many trading strategies for yourself! You can explore many feature in Advanced version here !
MT4 Version: Click here! You can combine it with our indicators below to make your trading
FREE

This indicator is based on the Bollinger Bands indicator. It helps the user identifying whether to buy or sell. It comes with an alert that will sound whenever a new signal appears. It also features an email facility. Your email address and SMTP Server settings should be specified in the settings window of the "Mailbox" tab in your MetaTrader 5. Blue arrow up = Buy. Red arrow down = Sell. Line = Trailing Stop. You can use one of my Trailing Stop products that automatically move the Stop Loss and
FREE

Mini One for All Trend Scanner is a trend following multi-symbol indicator that can be used with any input: forex, stocks, commodities,... The panel shows three indicators and six symbols with the trend for every pair (symbol/indicator): up, down or no trend. The indicators are: Average Directional Movement Index (ADX) Moving Average Convergence Divergence (MACD) Relative Strength Index (RSI) You can change quickly the chart by clicking any one of the symbol button in the panel. This feature
FREE

Transform your financial chart analysis with our innovative Candle Coloring Indicator. This powerful tool allows you to instantly visualize market trends based on closing prices relative to a customized average. Customized Coloring: Choose colors that best suit your analysis style. Highlight candles above the average in a vibrant color of your choice and candles below the average in another distinctive color. Adjustable Average: Tailor the indicator to your trading strategies by setting the aver
FREE
The MetaTrader Market offers a convenient and secure venue to buy applications for the MetaTrader platform. Download free demo versions of Expert Advisors and indicators right from your terminal for testing in the Strategy Tester.
Test applications in different modes to monitor the performance and make a payment for the product you want using the MQL5.community Payment System.
You are missing trading opportunities:
- Free trading apps
- Over 8,000 signals for copying
- Economic news for exploring financial markets
Registration
Log in
If you do not have an account, please register
Allow the use of cookies to log in to the MQL5.com website.
Please enable the necessary setting in your browser, otherwise you will not be able to log in.