
Entry Points Pro for MT5
- Indicators
-
Yury Orlov
 Trading since 1999 — Forex, CME, Crypto. One model survived a quarter of a century: enter the trend after its correction completes — short stop, large potential.
 - Version: 10.1
- Updated: 14 July 2026
- Activations: 20
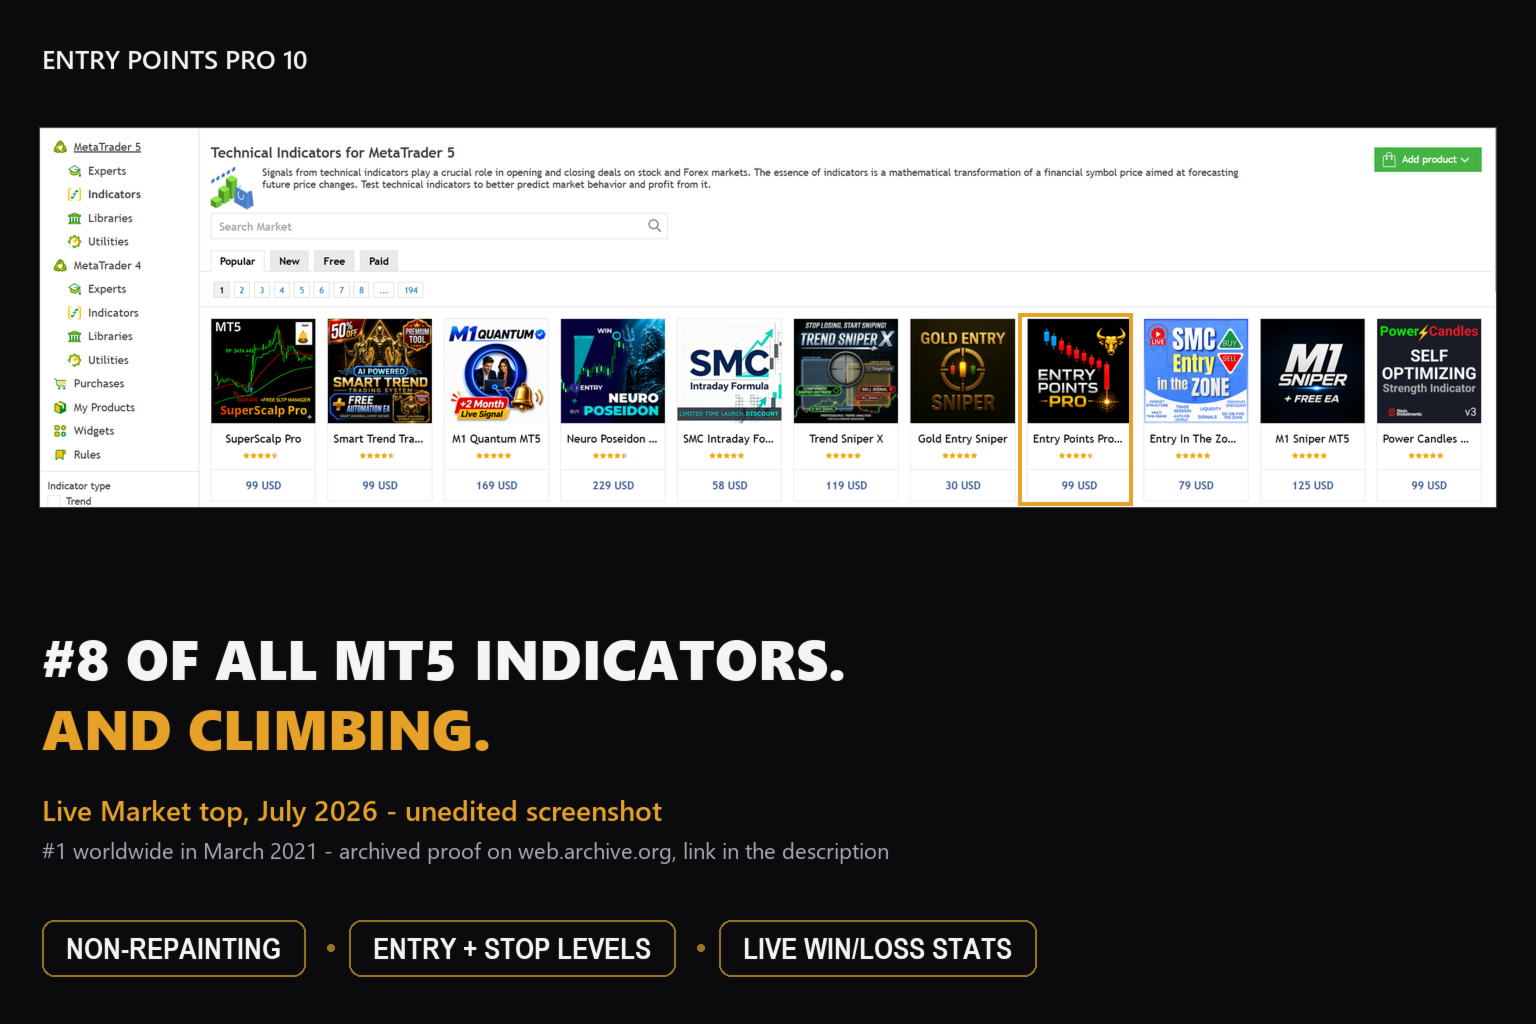
The legend is back! Entry Points Pro 10. A relaunch of the legendary indicator that held a Top-3 spot on the MQL5 Market for 3 years. Hundreds of rave reviews (589 across two versions), thousands of traders use it every day, 31,000+ demo downloads across MT4 + MT5. I have read every one of your reviews from the past five years — and instead of promises, I built the answers into version 10. From an author who has been in the market since 1999 and values honesty, his reputation and his clients.
The starting price of $99 applies only to the first 10 copies. As soon as they are sold, the price will be raised to $149 — and will keep rising as sales continue.
Rent from $59/month.
Entry Points Pro gives trade entry signals strictly WITHOUT REPAINTING. And for the first time this is not just the author's word — it is a verifiable fact: a confirmed signal is placed only on candle close, and an automated test recorded zero repaints (2,486,568 invariant checks on EURUSD, XAUUSD and BTCUSD — 0 violations). The method is open — you can reproduce it yourself in the Strategy Tester.
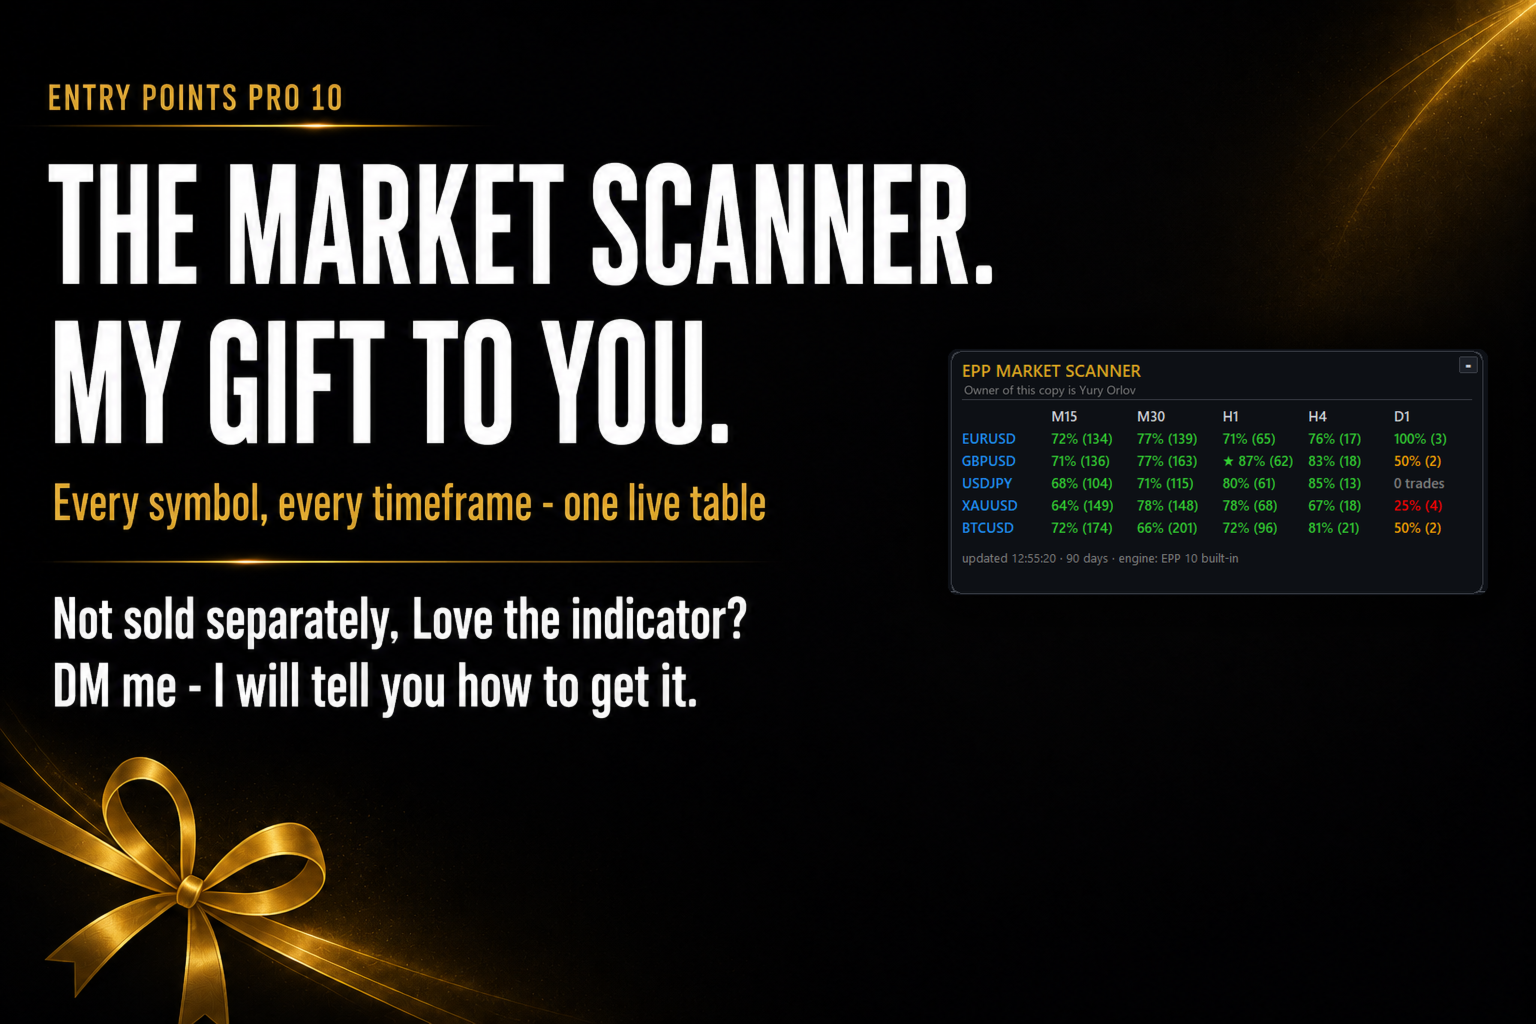
Be sure to send me a private message right after your purchase. I will send you the extended manual, the “Trader’s Bible” — a complete guide to trading with the indicator — and explain how to get a free bonus: a market scanner that analyzes many assets and timeframes at once and shows on a single screen where Entry Points Pro is trading best right now.
I am not asking you to take my word for it. Check it yourself — for free
- The demo = the full version. Nothing is hidden or disabled.
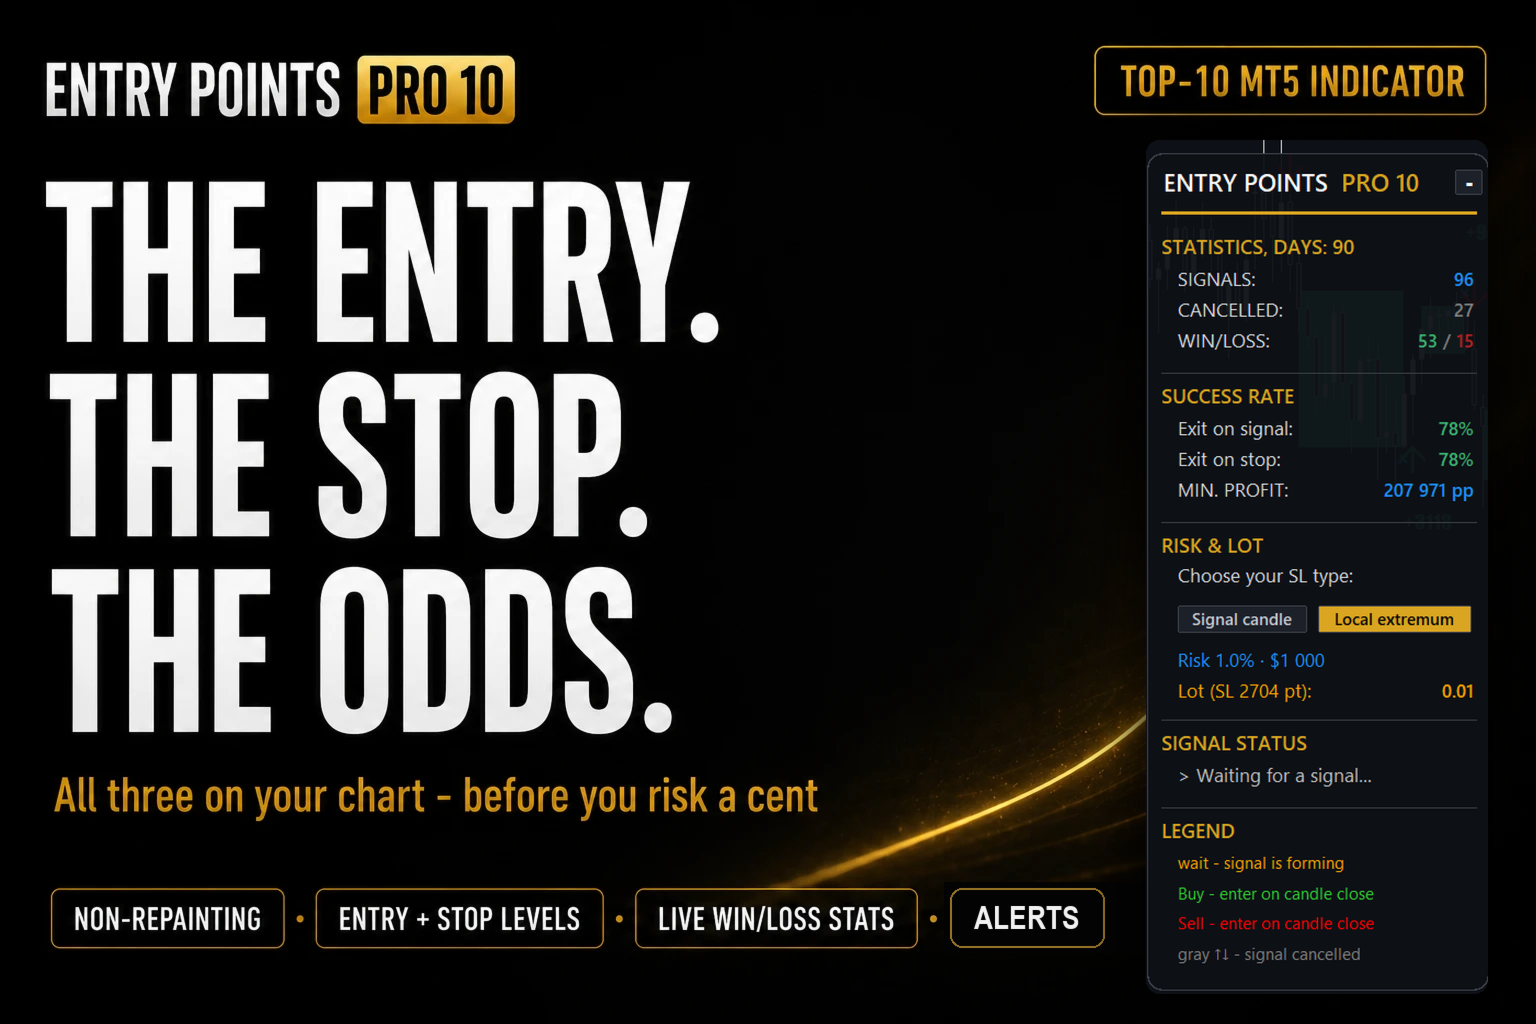
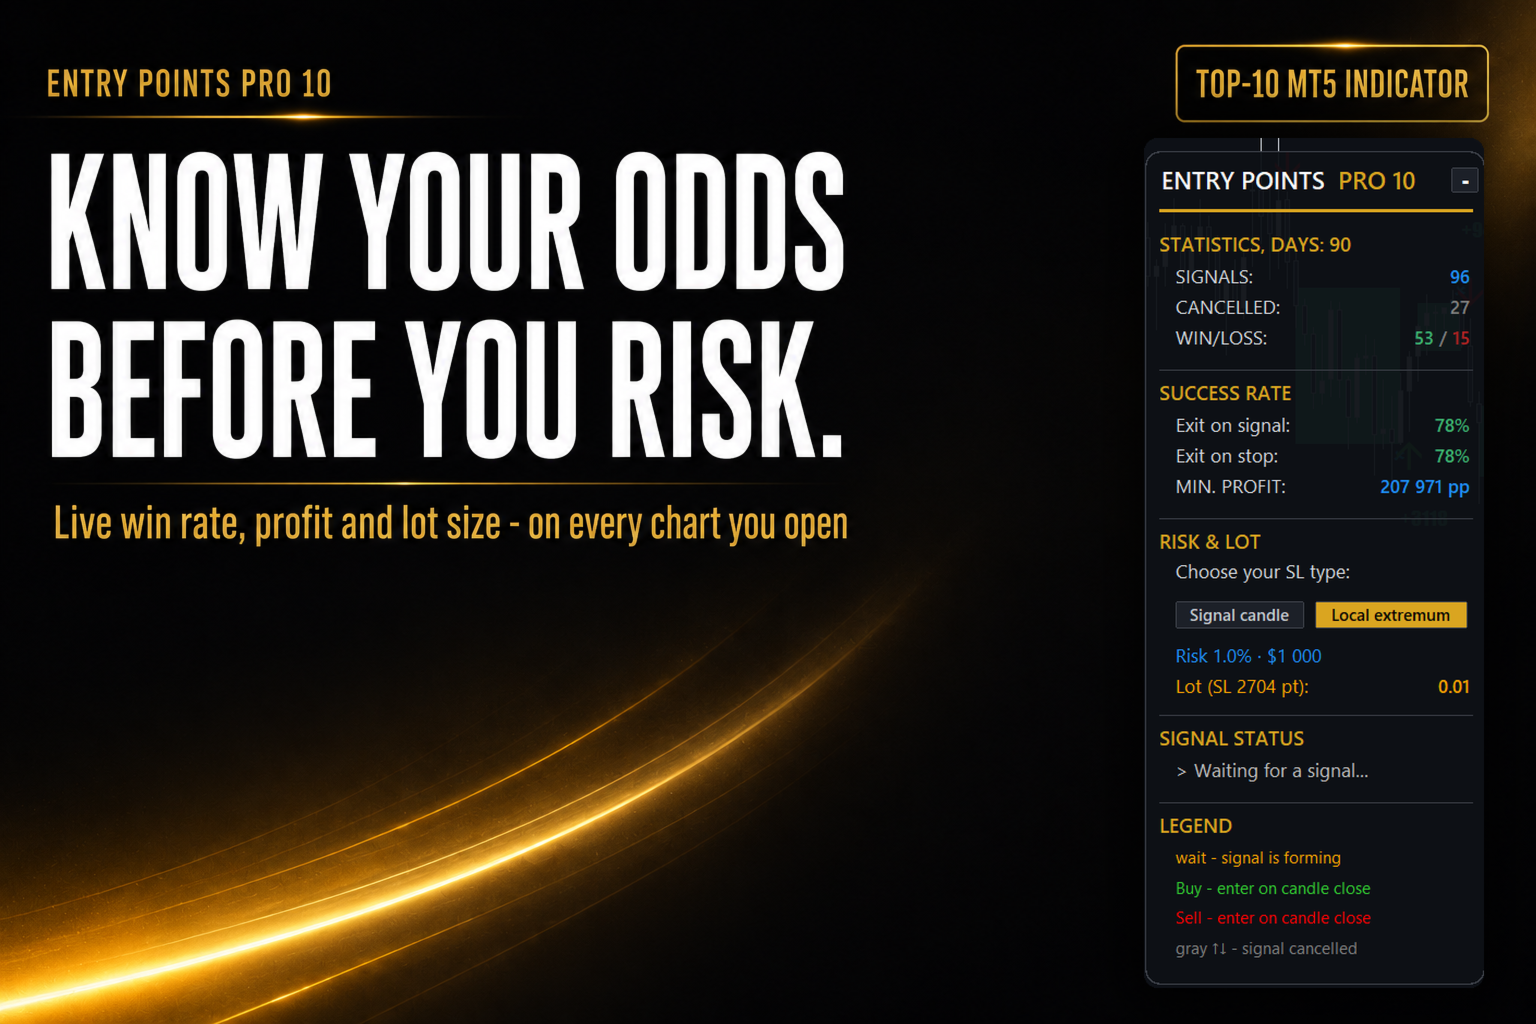
- Live statistics on your chart. The panel calculates the result of every signal on your symbol and timeframe: the success rate when exiting on the opposite signal and when exiting on a stop, plus the net total in points. Not the seller's screenshots — your numbers on your data.
- Compare us with any competitor. Try to find another indicator that is not afraid to show its own statistics right on your chart.
- Pick your timeframe in a minute. Step through M5–H4 — the panel will instantly show where your instrument has the best rate and enough signals. The past does not guarantee the future, but it gives an excellent reference point — all the more so because EPP relies on basic properties of the market: the market itself would sooner disappear than these properties stop working.
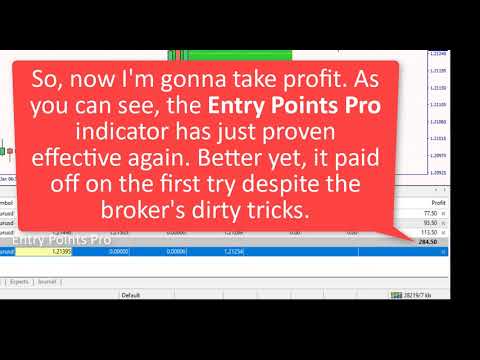
Watch the video (6:22) showing how just one signal played out and paid for the indicator.
A cancelled signal is NOT repainting
The only thing we have ever been criticized for is that “signals disappear”. Let's go through it honestly, because this is the core of the method. The signal arrow appears on candle close, but the entry happens only on a breakout of that candle's extreme — the indicator draws this level as a line with its price. If the next candle does not break the level, there was no entry and the signal is marked gray: the market did not confirm the move, and you did not lose a single point. This is a built-in filter of weak signals. With a conservative entry via a pending order, a cancelled signal physically cannot cause a loss: your Buy Stop or Sell Stop simply never triggers — delete it and wait for the next signal. How to enter correctly with stop and limit orders is covered in detail in the manual. Cancelled signals are tracked by a separate counter and do not take part in the success statistics. In version 10 the whole process is visible on the chart: the entry level, the live status, the gray arrows, the CANCELLED counter.
There is a second case of gray arrows — the signal-candle size auto-filter: if the candle is abnormally large, the entry would require an unjustifiably wide stop, and the indicator rejects such a signal on its own, even before the breakout check.
What you see on the chart
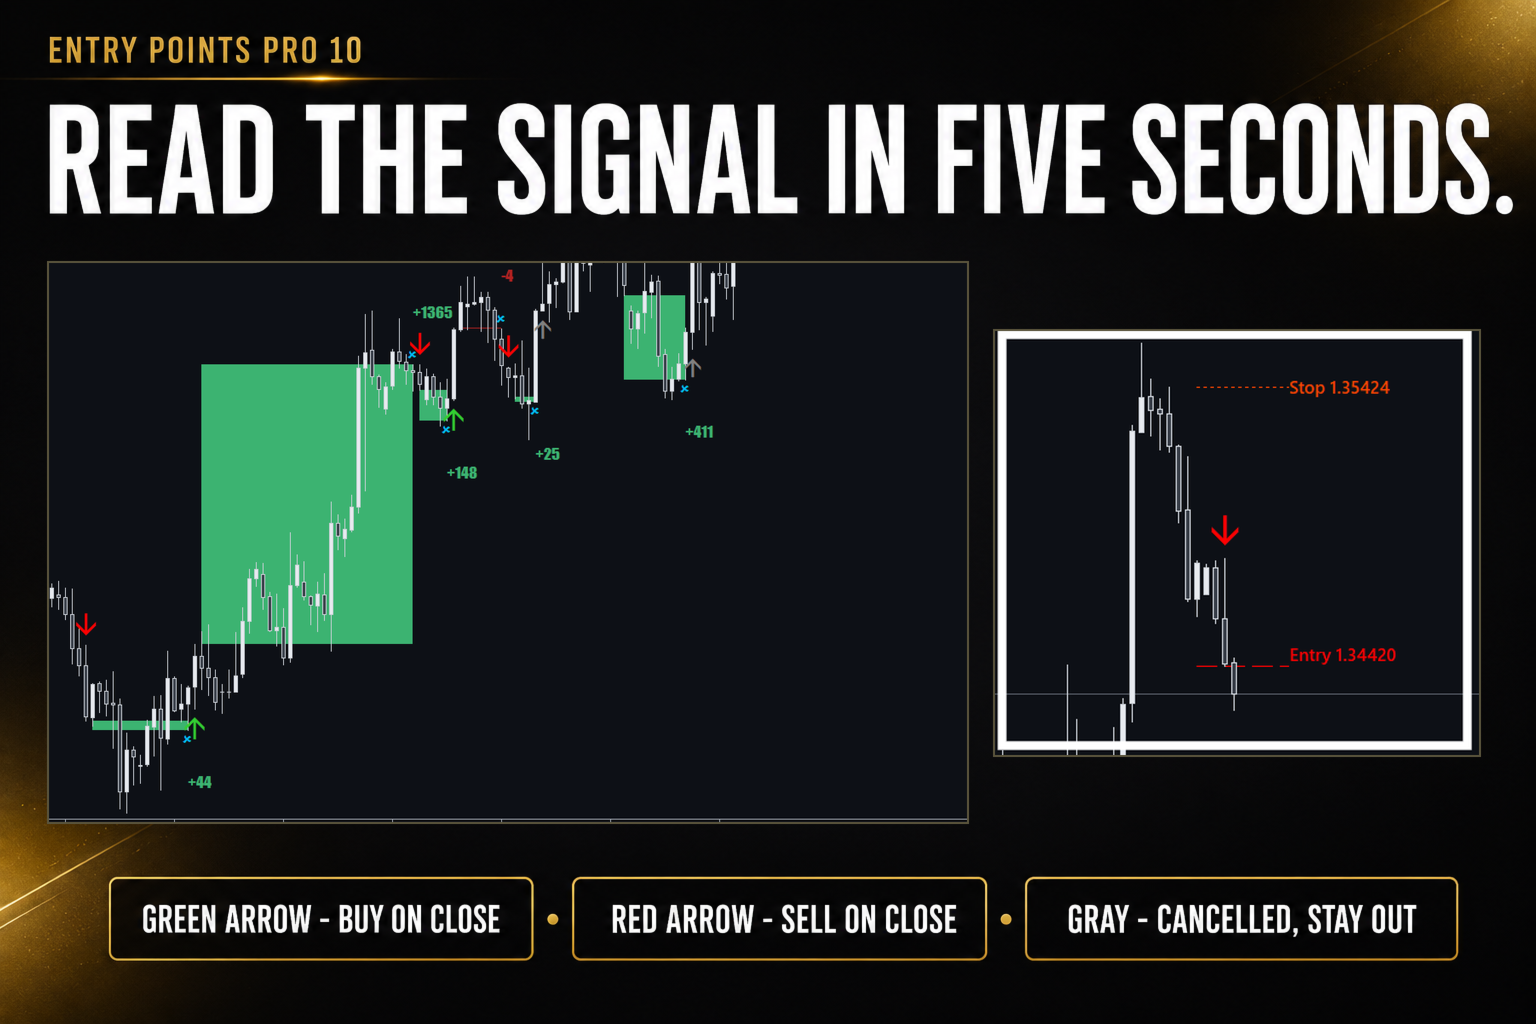
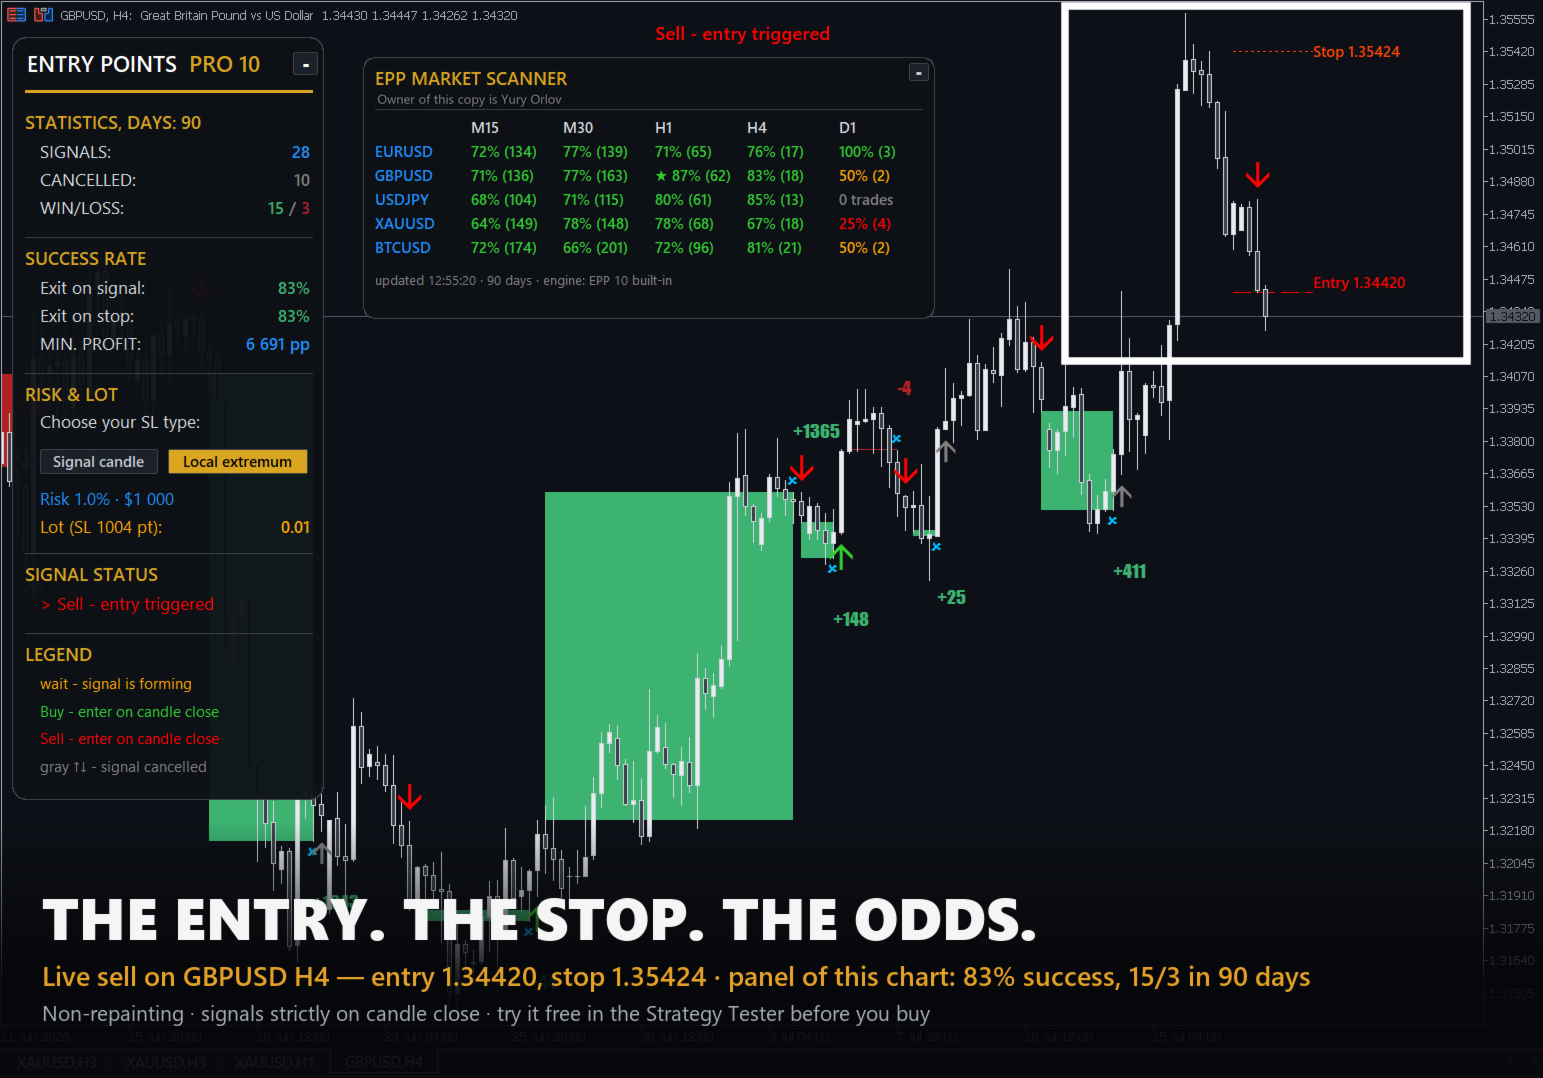
- Buy/Sell arrows strictly on candle close + an amber early-warning “signal is forming” marker
- An entry line with the breakout price and a stop line
- A live status: “Waiting for a signal… → signal is forming → entry at price → in trade”
- An abnormal spread warning
- Alerts: terminal pop-up, push notifications to your phone, sound — early and confirmed, with no duplicates
The panel that answers the main question: “does this actually work?”
The new panel can be collapsed, hidden or dragged wherever you like. On your symbol and timeframe it shows:
- How many signals there were over the statistics period (90 days by default) and how many were cancelled — the market did not confirm the entry, and you did not lose a single point.
- WIN/LOSS — the ratio of winning trades to losing ones.
- The success rate for three exit scenarios — because the entry is the same for everyone, while trade management is personal:
- Exit on signal — ideal management: hold the trade until the indicator's opposite signal. The upper bound of the method.
- Stop behind the signal candle — a tight stop: minimal risk per trade, but it gets hit more often.
- Stop behind the local extreme — a stop behind the nearest swing: hit less often, breathes with the market. I have been trading since 1999, and after all these years I no longer need indicators to read price — yet this is exactly the approach I practice: the best entry point in a trend comes after a correction has completed, with the stop behind the nearest extreme.
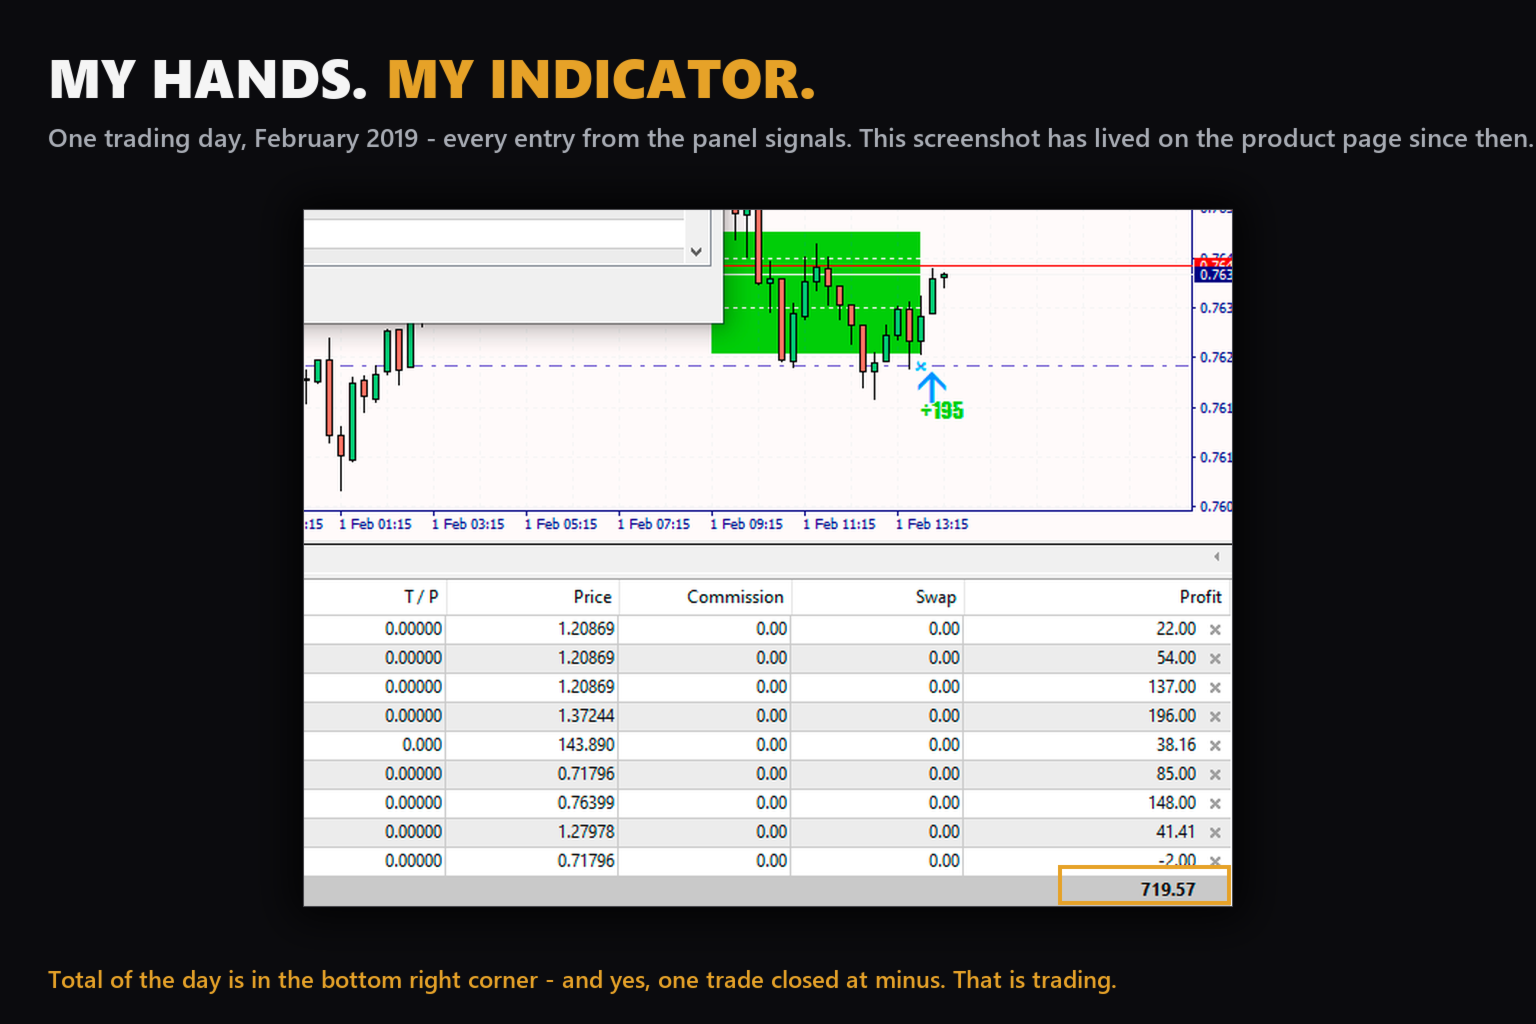
- MIN. PROFIT — the minimum profit: the net sum of points from all signals over the period if every trade is carried from the breakout entry to the opposite signal. “Minimum” because it is the worst-case calculation: no take-profits and no partial exits along the way. A live example is in the screenshots: the markup recorded +107 points on a trade, while the price moved another 900+ after the entry. MIN. PROFIT is the floor, not the ceiling; everything above it is your trade management. See the live example in the screenshots at the bottom of this page, below the description (the video is there too).
- A lot calculator based on your risk: “Risk 1% · $1,000 → lot 0.17” — calculated from the real stop of the current signal. The deposit for the calculation is set in the inputs: enter a fixed amount (and update it as your deposit grows) or set 0 — the indicator will take the current account balance itself. And if you want a robot to handle the lot calculation, the entry and the trade management — I am preparing an Expert Advisor that can do all of this and trades on its own.
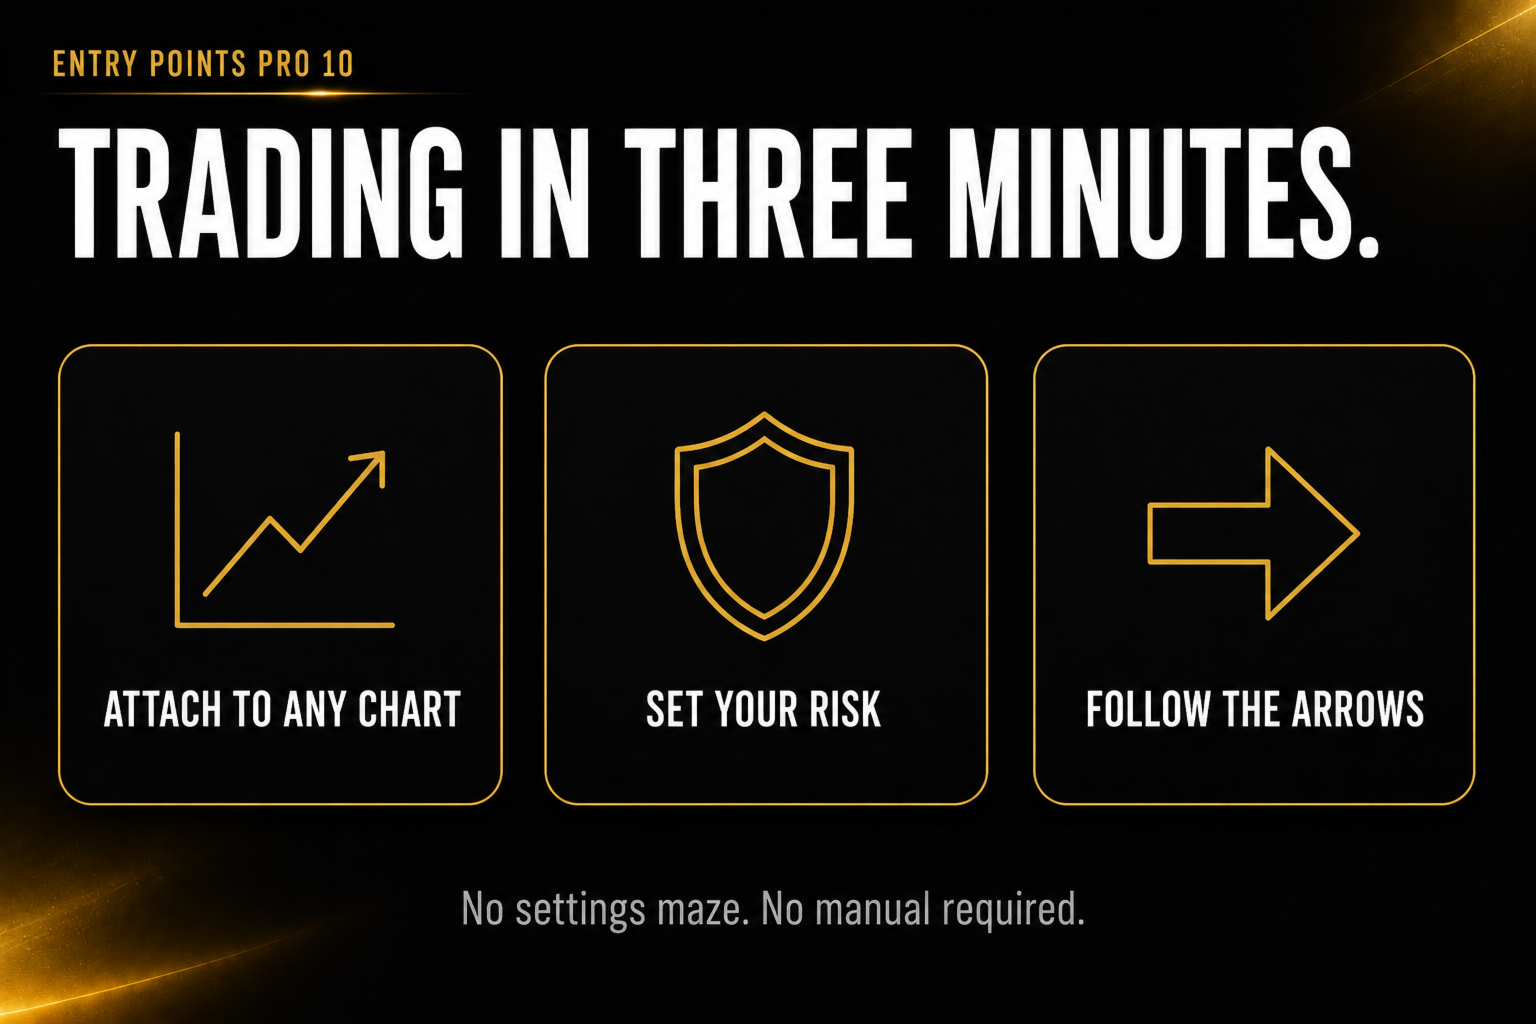
How to trade — 3 steps
- Wait for an arrow on candle close — the indicator will draw the entry level with its price.
- Enter on the breakout of the level — I recommend a pending stop order placed right at the level, so the entry executes by itself. The stop goes behind the level the indicator shows; the lot is already calculated from your risk.
- Once price gives you the chance, move the trade to breakeven: the risk is zeroed out, while the profit potential is not capped by anything. This is how I trade myself. Then hold until the opposite signal — or trail your own stop. Both scenarios are honestly calculated in the panel, pick yours.
In this video I demonstrated the indicator in the tester and showed my techniques for working with it. The video was recorded on the previous version — I will soon make a new one for version 10 and show live trading with the indicator. To make sure you don't miss it, join our group: the link is in the header of my profile.
What's new in version 10
- Works on any market out of the box. A smart adaptive auto-filter for signal-candle size: an abnormally large candle means an unjustifiably wide stop — the indicator cancels such a signal itself (a gray arrow). Gold, crypto, indices and stocks no longer require manual tuning.
- A live status assistant: the indicator tells you in plain words what is happening and what to do next.
- The entry and stop levels are drawn on the chart with prices — you can see where to enter and where the risk is.
- Two honest exit statistics: on the reversal and on the stop — compare management styles.
- Stop-selection buttons on the panel, with instant recalculation of the statistics and the lot.
- A lot calculator based on risk percentage and deposit.
- Early + confirmed alerts (terminal pop-up / push / sound) with no duplicates.
- The panel in 7 languages: English, Russian, Spanish, German, French, Italian, Portuguese — it switches automatically to match the terminal language.
- A collapsible panel, abnormal spread protection, faster code.
The advantages traders came to love the indicator for
- Signals without repainting — they appear on candle close and do not disappear.
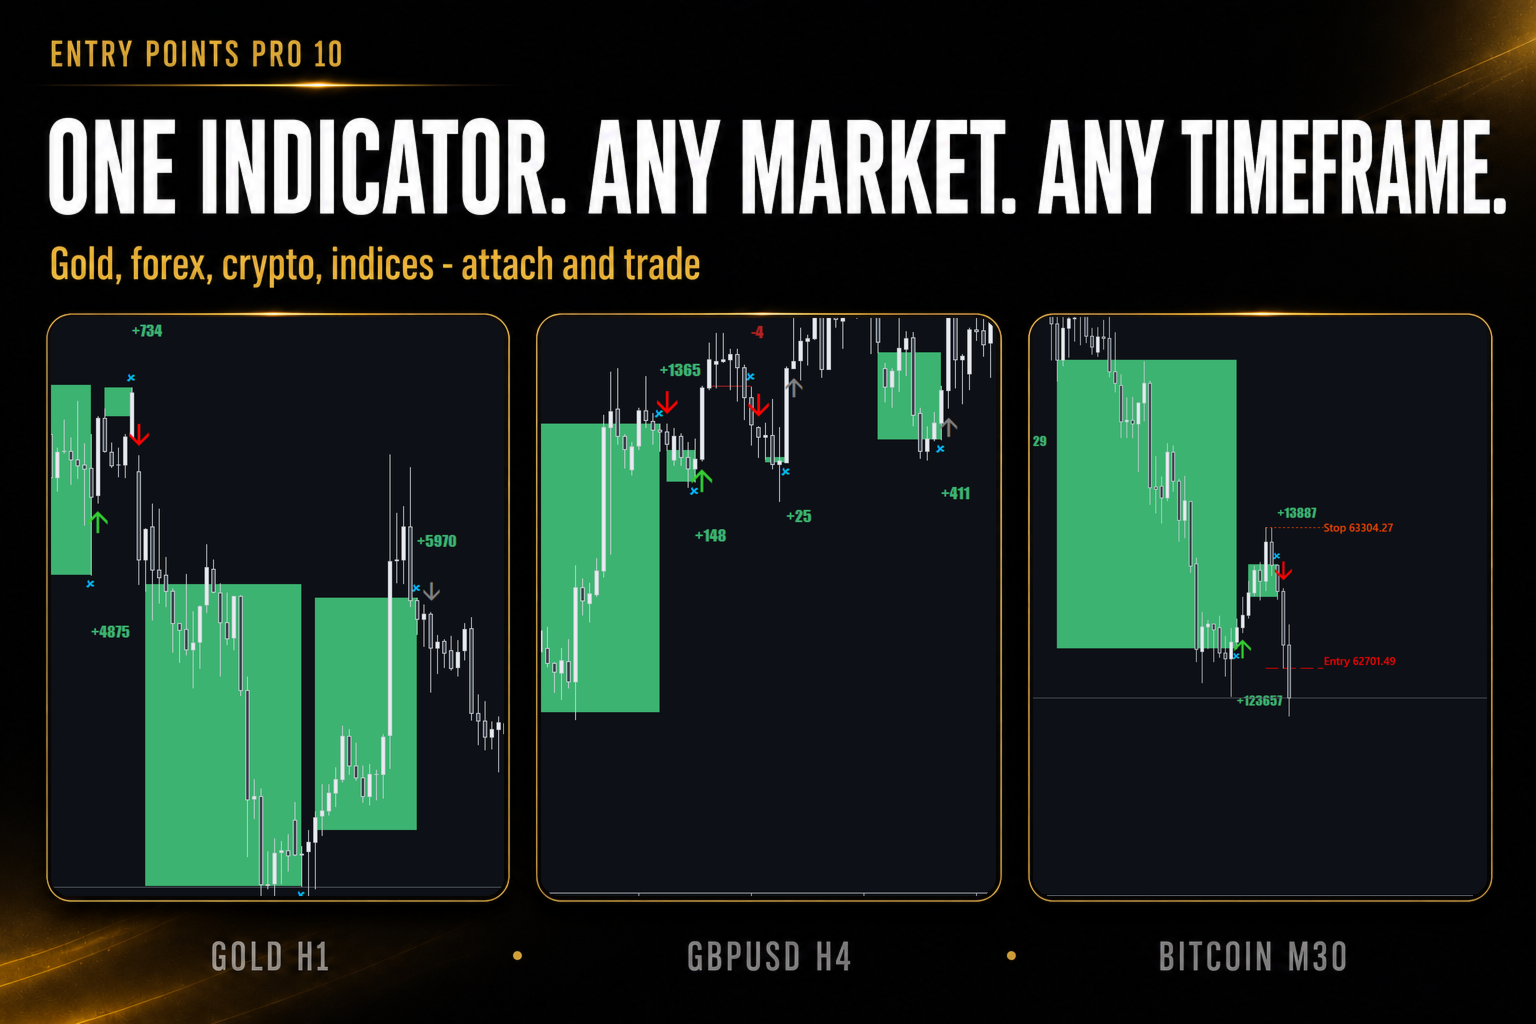
- Any asset: forex, gold and metals, cryptocurrency, indices, stocks — with any MT5 broker.
- All timeframes from M1 to D1.
- Lightweight code — it does not slow down the terminal.
- For beginners and professionals: a detailed manual that traders have nicknamed the “Trader’s Bible”, plus personal support from the author.
Support from the author
I have been trading since 1999 and answer every buyer personally. A reminder: after your purchase, be sure to send me a private message — I will send you the “Trader’s Bible” and the scanner of the best instruments for the indicator. For any questions about purchasing, installation and use, message me privately as well.
Price
The starting price of $99 applies only to the first 10 copies. As soon as they are sold, the price will be raised to $149 — and will keep rising as sales continue. Rent from $39/month.
Mini FAQ
There is an arrow on the chart, but the panel says “Waiting for a signal…”?
The arrows are historical markup. The panel shows the state right now. Trade by the panel status.
What are the gray arrows?
Signals that did not become trades — for one of two reasons. First: the next candle did not break the entry level — the market did not confirm the move (these are counted by the CANCELLED counter on the panel). Second: the signal candle turned out to be abnormally large — the entry would have required too wide a stop, and the auto-filter rejected the signal. In both cases no trade was opened and you lost nothing; these signals are not included in WIN/LOSS.
Colored rectangles appear after the fact — is that repainting?
No. The rectangles are not signals but visual statistics for signals that have already completed. The trading arrows never move.
Why are my percentages different from the screenshots?
The statistics are calculated on your symbol, timeframe and period. That is a feature: you see the real numbers exactly where you are going to trade.
What is the difference between “Exit on signal” and “Exit on stop”?
One stream of signals, two management scenarios: hold until the reversal or manage with a stop. Both numbers are calculated on the real history of your chart.
What language is the panel in?
The language of your terminal — automatically: English, Русский, Español, Deutsch, Français, Italiano, Português. The terms Buy/Sell and WIN/LOSS are international and identical in all languages.











































I’ve been using Entry Points Pro since 2023, and it has consistently been the indicator that gives me the most clarity when deciding on an entry. Version 10 made it even better: entry and stop levels are now plotted directly on the chart alongside the price, the panel displays real statistics for the specific symbol and timeframe I’m using, and the live status eliminates any uncertainty about what is happening in real-time. The automatic signal candle size filter was a great addition, too—I used to have to adjust settings manually for gold and crypto, but now it works right out of the box. Signals trigger only at the candle close—with no repainting—and entries occur only on the breakout; those who grasp this concept get the most out of the tool. I highly recommend it, and Yury’s support has always been fast over the years. Top marks.