Watch the Market tutorial videos on YouTube
How to buy а trading robot or an indicator
Run your EA on
virtual hosting
virtual hosting
Test аn indicator/trading robot before buying
Want to earn in the Market?
How to present a product for a sell-through
Technical Indicators for MetaTrader 5 - 48

Pna Vwap: Professional Multi-Timeframe VWAP Gain a professional edge and trade with institutional clarity. Pna Vwap is a powerful, all-in-one VWAP system Stop guessing the true market trend. Pna Vwap provides a clean, multi-dimensional view of the market by showing the real, volume-weighted average price across three critical timeframes. Understand where the value is, identify who is in control, and make trading decisions with greater confidence. Core Features & Key Advantages This is not a ba
FREE

Displays symbol tabs for easy access when trading, symbols that are coloured are symbols you have trades running on.
The indicator immediately shows the specified currency pair in the open window after clicking it. You no longer need to open a new window to view each chart thanks to the indicator. Additionally, it enables traders to concentrate on their trading approach by just keeping a small number of charts displayed.
FREE

Market Palette is a powerful tool for filtering trading decisions based on inertia and acceleration of price fluctuations.
_________________________________
How to use the indicator signals:
The indicator generates histogram signals in three different colors. In the standard color scheme, when blue columns appear, it is recommended to keep only long positions, when red columns appear, only short ones, and when gray columns appear, refrain from trading actions. The appearance of higher column
FREE
Hi Traders, EMA is very popular indicator to determine: trend // support // resistance. Here are the use of this simple yet very powerful Multi-Time Frame indicator: 1- Attach this indicator to your chart . - Choose the desired time frame ( ex: Current, M15, H1, H4, D1,...). - Set your desired EMA periods ( ex: 20, 50, 100, 150, 200,...). - Enable which EMA you want to show by setting the relevant EMA to: True / False (you can show 1, 2, 3, 4 or all of 5 EMAs at the same time). - Set c
FREE

Unlock the Power of Scalping with this Essential Indicator for Any Currency Pair! Experience Crystal-Clear Buy/Sell Signals and Activate Instant Alerts for Maximum Precision.
Introducing the Ultimate Scalping Companion: Your Key to Precision Profits! Transform Your Trading Strategy with an Indicator that Stands the Test of Time! In the ever-evolving world of trading, consistent success hinges on smart risk management . While no tool can be the holy grail, our non-repainting indicator i
FREE

TP Audio Alert is a MetaTrader 5 custom indicator that plays a sound automatically whenever a trade position is closed at Take Profit (TP) . This tool is perfect for traders who want to be notified instantly without constantly watching the chart. Key Features: Plays sound when a TP position is closed Lightweight and does not clutter the chart No visual elements (zero plotted indicators) Simple and easy to configure Compatible with all symbols and timeframes How to Change the Sound File: Pla
FREE

SSACD - Singular Spectrum Average Convergence/Divergence This is an analogue of the MACD indicator based on the Caterpillar-SSA ( Singular Spectrum Analysis ) method. Limited version of the SSACD Forecast indicator. Limitations include the set of parameters and their range.
Specificity of the method The Caterpillar-SSA is an effective method to handle non-stationary time series with unknown internal structure. The method allows to find the previously unknown periodicities of the series and make
FREE

这是一个功能完整的MT5相关性矩阵指标。 主要功能 相关性矩阵显示 显示多个货币对之间的皮尔逊相关系数 正相关显示为绿色,负相关显示为红色 对角线显示为1.0(自身完全相关) 智能品种检测 支持自定义品种列表 自动匹配平台上可用的交易品种 处理不同经纪商的品种后缀 排序货币对列表 最高正相关货币对(前15名) 接近0相关性货币对(前15名) 最高负相关货币对(前15名) 自定义化设置 可调整计算周期 自定义更新频率 颜色、字体、位置等可视化参数 使用说明 输入参数 CorrelationPeriod : 相关性计算周期(默认60) UpdateInterval : 更新间隔毫秒数(默认1000) UseCustomSymbols : 是否使用自定义品种列表 CustomSymbols : 自定义品种列表(逗号分隔) MatrixPositionX/Y : 矩阵显示位置 SortedListX/YOffset : 排序列表位置 显示解读 绿色数值 : 正相关(越接近1相关性越强) 红色数值 : 负相关(越接近-1负相关性越强) 接近0的数值 : 相关性较弱 这个指标对于识别货币对之间的关
FREE
Channel QX The EA (Hurst Razer PRO EA MT5) is now available, you can see it by clicking here! https://www.mql5.com/es/market/product/153441?source=Site+Profile+Seller Channel QX combines trend analysis with dynamic volume-based adaptation to provide accurate signals in highly volatile markets.
Key Features
Dynamic Volume Adaptation Automatically adjusts channel width based on tick volume momentum Responds instantly to changes in market activity Prevents false signals duri
FREE
Moving Average Color - Indicador Inteligente para MT5 Descrição Geral O Moving Average Color é um indicador avançado que combina média móvel tradicional com sistema visual inteligente de cores. O indicador muda automaticamente as cores da média móvel e das velas (candlesticks) baseado na posição do preço em relação à média, oferecendo uma análise visual clara e instantânea da tendência do mercado. Principais Características Funcionalidades Principais: Média Móvel Configurável : Suporte a
FREE

RSI magic kjuta trial is the demo version of RSI magic kjuta.
Custom Indicator (RSI magic kjuta) based on the standard (Relative Strength Index, RSI) with additional settings and functions. The maximum and minimum RSI lines on the chart have been added to the standard RSI line. Now you can visually observe the past highs and lows of RSI, and not only the values of the closing bars, which avoids confusion in the analysis of trades. For example, the EA opened or closed an order, but the RSI li
FREE

Produto Teste para testar chaves e validações. Ao instalar entre em contato. Mais informações entrar comunicação Instalando por favor revisar os testes querendo mais informações leia as instruções podendo estar errado entrar em contato Espero que este indicador auxilie nos trades dos usuários. O indicador será avaliado em outras metodologias para melhor atender
FREE

A simple tick indicator of Bid and Ask prices. The period separator (1 minute) is displayed as a histogram. Parameters Show Bid Line - show/hide the Bid line; Show Ask Line - show/hide the Ask line; Show Labels - show/hide the last price values.
FREE

One of the best trend indicators available to the public. Trend is your friend. Works on any pair, index, commodities, and cryptocurrency Correct trend lines Multiple confirmation lines Bollinger Bands trend confirmation Trend reversal prediction Trailing stop loss lines Scalping mini trends Signals Alerts and Notifications Highly flexible Easy settings Let me know in the reviews section what you think about it and if there are any features missing.
Tips: Your confirmation line will predict tre
FREE

//////////////////////////////////////////////// //////////////////////////////////
An improved version of the standard Average True Range indicator.
It is now a responsive and smoothed line.
The setup is not straightforward - but I hope you can do it. It is very easy to understand the readings of this indicator, the meaning is the same as that of the standard Average True Range.
//////////////////////////////////////////////// ///////////////////////////////////
I hope this indicator will
FREE

A simple and efficient indicator that plots and updates the 50% of the current day, for those who use this point as a reference in day trading.
On trend days the 50% region tends to be a good resistance point, ideal for making new entries.
On non-trend days (sideways) the 50% region is great for carrying out positions.
In addition, for study or back-testing criteria, you can define the amount of previous days to be plotted by the indicator.
For questions or suggestions, please contact us. A
FREE

A simple indicator showing the size of the spread at the current time, the maximum for the day and the maximum for the entire duration of the indicator.
Daily statistics of the maximum spread are also displayed, indicating the time when this spread was fixed.
The location of the display of the received information can be changed depending on your preferences and positioned anywhere on the screen.
It is possible to output alerts about exceeding the size of the spread specified in the input pa
FREE

Sends price alerts conveniently to your Android/IOS device. Make sure push notifications are enabled in Metatrader settings and the PC/VPS is online 24/7. Price levels are updated automatically, but you can modify them in global variables, if needed. Suitable for any market instrument, but if notifications are too frequent, increase point value of the indicator parameter.
FREE
Multi-Timeframe Chart Overlay Indicator
The Timeframe Overlay indicator displays price action for multiple timeframes on a single chart, allowing you to quickly assess different timeframes from a single chart. The advantage is to observe and follow the correlations of price movements in real time to help you find potential trades at a glance.
---- Symbol 1 ----
Symbol = EURUSD
Correlation Inverse = false
Display = true
Ratio
FREE

Logarithmic chart in new window You can use both chart as half or full window All features are active in both arithmetic and logarithmic charts Magnet in arithmetic chart is standard metatrader magnet in logarithmic chart magnet have two modes: first mode only select high or low, if this mode is enabled, you can set how many candles will be search before and after to find the highest or lowest points second mode select the closest point of the candle to click, its choose between 4 points (High,
FREE

عنوان: محلل الدعم والمقاومة الذكي
وصف مختصر: يقوم بتحديد مستويات الدعم والمقاومة الرئيسية بشكل ديناميكي، مع تسليط الضوء على نقاط المحور الحاسمة وأعلى الارتفاعات وأدنى الانخفاضات لاتخاذ قرارات تداول دقيقة.
الوصف الكامل: أطلق العنان لقوة تحليل السوق الديناميكي مع SmartSRAnalyzerR! يرصد هذا المؤشر المتقدم تلقائيًا قمم وقيعان نقاط المحور، ويحسب أقرب مستويات الدعم والمقاومة، ويعرضها بوضوح على مخططك البياني.
الميزات الرئيسية:
الدعم والمقاومة الديناميكية: تحدد تلقائيًا المستويات الرئيسية استنادًا
FREE

Trend indicator based on the ADX / ADXWilder indicator
The indicator shows trend areas using ADX or ADXWilder indicator data.
How the indicator works: if PDI is greater than NDI, then it`s bullish movement; if PDI is less than NDI, then it`s bearish movement; if ADX is less than or equal to the filter value specified in the parameters, then there is no movement state.
Input parameters of the indicator: Calculate Timeframe - timeframe for calculation; ADX Type - type of ADX calculation based
FREE
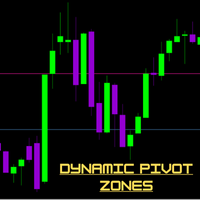
Dynamic Pivot Zones – Your Level Assistant on the Chart This indicator is a bit like a GPS for your trading . It shows you where the price likes to hang out, where it gets nervous, and where it flies through. No more calculating pivots by hand or guessing support and resistance levels. What it does: Automatically plots H1, H4, and D1 pivots . Shows support and resistance zones : R1, R2, S1, S2. Lines are colored and easy to read , so you can instantly see what’s hot or cold. Why you’ll love it:
FREE

This indicator is designed according to the combination of WPR and Stoch indicators, when WPR goes up and Stoc goes up quickly too, the price may meet strong resistance, many times short order will take profit, but if the price break through it, Long positions are more likely to be profitable, and the reverse held true as well. You can adjust the parameters of WPR and Stoc to Adapt the symbol you operate. Click here to look the advanced edition: https://www.mql5.com/en/market/pro
FREE

Propfirm Risk Guard Dashboard — Prop‑firm P/L, Drawdown & Exposure Monitor for MT5 Propfirm Risk Guard Dashboard is a compact chart indicator that gives traders an instant, accurate view of their challenge-style limits and worst‑case exposure. Built for traders preparing or taking prop firm evaluations, it aggregates closed P/L, floating P/L, and estimated SL exposure (open + pending) and compares them to your configured daily drawdown, max loss (initial drawdown), and profit target — all in on
FREE
CFN - Multi MA & EMA Indicator for MT5 – with Alerts Take your chart analysis to the next level with the Multi MA & EMA Indicator for MetaTrader 5 – a versatile, efficient tool designed for traders who rely on Moving Averages and Exponential Moving Averages to interpret trends and make smarter trading decisions. Key Features: Supports up to 5 Moving Averages (MA) & 5 Exponential Moving Averages (EMA):
Easily plot and manage up to 10 customizable averages directly on your MT5 charts.
FREE
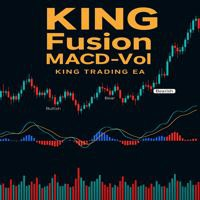
- وصف المنتج - مؤشر احترافي متكامل
لا يعد KING Fusion MACD-Vol من KING TRADING EA مجرد MACD آخر — فهو عبارة عن مجموعة أدوات تداول كاملة تجمع بين مؤشرات احترافية متعددة في نافذة فرعية واحدة أنيقة. لم تعد بحاجة إلى تحميل مخططك بأدوات منفصلة. يجمع هذا المؤشر بين:
MACD مع خطوط مزدوجة ورسم بياني مكبر
رسم بياني ملون ومثبت بالحجم
ملصقات ديناميكية مع قيم المؤشرات في الوقت الفعلي (ATR، ADX، RSI، Volume)
عداد تنازلي للبار
التنبيهات المتقاطعة (مرئية + صوتية)
كل ما تحتاجه من الوضوح والسرعة والدقة -
FREE

The Magic SMMA indicator is of great help in determining trend direction. It can be an excellent addition to your existing strategy or the basis of a new one. We humans can make better decisions when we see better visually. So we designed it to show a different color for rising and falling trends. Everyone can customize this in the way that suits them best. By setting the Trend Period, we can optimize it for longer or shorter trends for our strategy. It is great for all time frames.
IF YOU NEE
FREE

Un indicador técnico de múltiples osciladores es una herramienta de análisis que combina varios osciladores para proporcionar una visión más completa de la dinámica del mercado. Los osciladores son fórmulas matemáticas que se calculan a partir de los datos de los precios y se representan gráficamente para ayudar a identificar la tendencia actual, el sentimiento del mercado y posibles puntos de giro.
**¿Para qué sirve?** Este indicador sirve para identificar condiciones de sobrecompra y sobreve
FREE

Простой индикатор, показывающий цены Bid и Ask. Есть настройки отображения информации и возможность перетаскивать панель. Индикатор используется для наглядного отображения цен покупки и продажи актива.
Входные параметры : Support - Ссылка, на помощь проекту heigth - Высота формы width - Ширина формы size - Размер текста bidcol - Цвет текста bid askcol - Цвет текста
FREE

The Volume Plus indicator for MT5 can be effectively used for detecting imbalances in supply and demand.
The indicator improves on the typical volume histogram by coloring the bars.
Bar colors (colors are customizable):
Neutral - DimGray Wide Spread (Range) Bar on High Volume - MediumBlue Narrow Spread, High Volume - MidnightBlue Wide Spread, Low Volume - ForestGreen Narrow Spread, Low Volume - DarkGreen Very/Ultra Wide Spread, Low Volume - Aqua Narrow Spread, Ultra High Volume - Purple Very/
FREE

MultiTimeFrame Double Screener MT5 — HiddenEdge MultiTimeFrame Double Screener MT5 is a professional dashboard that monitors multi-timeframe trend bias across multiple symbols from a single chart.
It uses dual confirmation to reduce noise and keep readings consistent across all windows. Functional Overview Computes bias per symbol using closed candles and a time anchor (H1 by default) to avoid historical repaint. Applies dual confirmation: bias reading + optional N-bar validation on the anchor
FREE

The indicator shows the current spread of the symbol, the minimum, average and maximum values for the current bar in the form of digital, analog and graphic indicators. Has two modes of operation: fixing the system spread, or calculating the spread as the difference between the "Bid" and "Ask" prices on each incoming tick. Parameters The indicator has a single input parameter: Type of calculation - type of spread calculation. It can take the following values: System spread - the spread value
FREE
What It Does This indicator shows up to 5 moving averages from any higher timeframe on your current chart. Instead of switching timeframes to see the bigger picture, you get the trend information in one place. Example: Trading on 1-hour chart while displaying Daily moving averages to see the longer-term trend. Key Features Flexible Configuration Display up to 5 moving averages with individual enable/disable options Choose any higher timeframe as your source (4-hour, Daily, Weekly, Monthly, etc.)
FREE
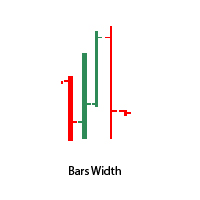
This indicator will allow you to change the thickness of the lines and the stroke color, due to which you can get a thicker bar on the chart. By default, the indicator has a bar thickness of 2. There is also an option in the input parameters to select the color of the bullish and bearish bars. When an indicator is added to the chart, the chart immediately changes its rendering style to "bar".
FREE

To calculate strength of currencies and to show in table There is 1 parameter: . Show recommended pairs: true/false -> To show top 1 of strong and weak currency Tips to trade: . To trade only with strongest vs weakest currency . When H1, M30, M15, M5 of specific currency is up or down -> consider to open BUY/SELL . It can combine: + strongest currency vs weakest currency + strongest currency vs 2nd weakest currency + 2nd strongest currency vs weakest currency
FREE
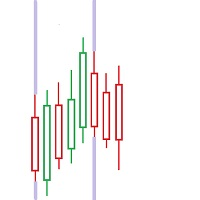
FIRST: I am NOT a coder ! I am a TRADER that was forced to code, because i needed some special tools! So i am sorry for minor graphic-bugs and so on...
this little free tool allows you to set 5 vertical lines at specific time. you can use it to mark london open / asia open / comex open and so on... it draws the lines in the future space - so you wont miss an important time / candle
you can select color..thickness of the lines you can select only 2 or 3 of the 5 max. lines - you dont have to us
FREE

Double Line Donchian Channel MT5/Meta Trader 5 Indicator, this is customized Indicator to show only 2 Lines of Highest and Lowest PRICE line where you can add a MA (MOVING AVERAGE) for center line. What is Donchian Channel?
Donchian Channels are three lines generated by moving average calculations that comprise an indicator formed by upper and lower bands around a midrange or median band. The upper band marks the highest price of a security over N periods while the lower band marks the lowest p
FREE

TG Ponto de Cobertura (Coverage/Breakeven)
This Indicator checks your trading results on the day relative to the asset on the chart and adds a line at the price corresponding to the coverage point (breakeven) for the open position, considering the entry price and lot size. The coverage point will be recalculated after new entries, based on the average price of the open operation and the lot size.
If the result for the day is zero, a line will be displayed at the price of the current trade.
If
FREE
This indicator draws a price area in which the volume percentage was traded the day before. The chart shows the days with vertical lines and two horizontal lines to indicate the upper price and the lower price of the percentage of volume was traded the day before. The upper/lower lines start and end with the day calculated. But they are referred with the values of the day before. NOT the day in which are. With this indicator you can see where the volume moved in the day before. It uses percenti
FREE

O Indicador identifica relação do Índice com a soma dos principais ativos, funciona para qualquer mercado do mund o, possui um oscilador WPR com a soma dos principais ativos escolhidos, indicando a antecipação do movimento em relação ao Índice. Características WPR com a soma dos papéis escolhidos - branco WPR do papel atual - vermelho Canal de Tendência O indicador pode indicar movimento de entradas, sendo: cruzamento das linhas cruzamento da linha Multi Symbols no -50 cruzamento entre os canai
FREE

We at Minions Labs always like to defy the stablished systems and beliefs trying new things and new ways of seeing and interpreting the Market Data. And all starts with the following question...
WHAT IF...
You give more relevance and focus on the Wicks/Shadows on the candlesticks? And Why? In volatile markets wicks play an important role on determining who is winning the the fight between Bulls and Bears , and more than that, Higher and lower wicks can present you with a good status of the curr
FREE

Graphic Shapes -using history, it projects four types of graphical shapes at the moment, allowing you to determine the main ranges of price movement in the future, as well as gives an understanding of the main market reversals, while giving entry points by priority!The panel contains three types of figure sizes expressed by timeframes. They allow you to conduct a complete market analysis without using additional tools! The indicator is a powerful tool for forecasting price movements in the forex
FREE

This indicator is a zero-lag indicator and displays exact trend as is. True Trend Moving Average Pro works best in combination with True Trend Oscillator Pro that displays strength of trend change.
True Trend Oscillator Pro: https://www.mql5.com/en/market/product/103589
If you set PERIOD input parameter to 1 this indicator becomes a sharpshooter for binary options.
Default input parameters: TT_Period = 10; TT_Meth = MODE_SMA; TT_Price = PRICE_MEDIAN;
Before you buy this product, please do t
FREE
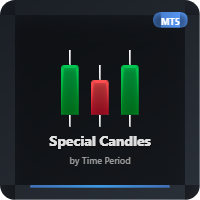
This indicator allows you to observe candle formation over a specific period, such as the Nasdaq, which starts at mid-hour. For example, for the first hour. The distance and size of the candle positioned on the right side can be adjusted. Color can also be assigned based on falling and rising candles. The needle can be made visible or invisible if desired. The body size can also be adjusted as desired.
FREE

The "Trend Fishing Indicator" is a powerful custom indicator designed to help traders identify potential trend reversal points and capitalize on market momentum. This indicator uses multiple moving averages of varying periods to evaluate short-term and long-term market trends. By comparing the short-term moving averages against the long-term ones, it generates clear buy and sell signals that can guide traders in making informed trading decisions. Key Features: Multiple Moving Averages : Incorpor
FREE

Push Notif for Mobile Trading
(Now you can trade perfectly through notifications to your Mobile Gadget, with Signals that you can adjust to your trading style, Use VPS to activate real time trading)
Description Push Notif for Mobile Trading is a custom MetaTrader 5 (MT5) indicator designed to send mobile push notifications to traders when certain price or indicator-based conditions are met. This allows traders to monitor markets remotely and act quickly, even when not at their trading terminal.
FREE

Introducing the VXN Indicator
Discount code for 25% off at Darwinex Zero: DWZ2328770MGM Your ultimate ally in navigating the volatile seas of the Nasdaq-100 Index. Designed for traders who demand precision and reliability, the VXN Indicator provides real-time insights into market sentiment and potential price swings. With the VXN Indicator, you can: Predict Volatility : Gain a competitive edge by anticipating market movements with accuracy. Optimize Strategies : Fine-tune your trading strategi
FREE

An indicator for analyzing different currency pairs simultaneously Forex is a complex market that requires several currency pairs to be analyzed simultaneously Determine the number of currency pairs yourself Determine the currency pair you want to analyze to analyze 4 of the most important and similar currency pairs at the same time. For direct and simple analysis, some currency pairs have changed (EURUSD>>>USDEUR) Do not doubt that to succeed in this market, you must analyze several currency pa
FREE

Recomended broker: https://tinyurl.com/5ftaha7c Indicator used to monitor price fluctuations in the market and discover possible reversals through reversal points or divergences in the indicator. All assets and all timeframes. SEE OUR RESULTS ON INSTAGRAM: https://www.instagram.com/diogo.cansi/ TELEGRAM GROUP = https://t.me/robosdsc More information by email dscinvestimentos@gmail.com or by Whatsapp 55-991372299
FREE

Non-proprietary study of Joe Dinapoli used for overbought/oversold evaluation. Uses of Detrended Oscillator indicator Profit taking. Filter for market entry technics. Stop placement. Part of volatility breakout pattern. Determining major trend changes. Part of Dinapoli Stretch pattern. Inputs lnpPeriod: Perid of moving average Method: Calculation method ********************************************************************************* If you want to know market Overb
FREE

## FutureSight CCI — See Beyond the Trend
### Indicator Overview
**FutureSight CCI** is a next-generation oscillator that takes the traditional CCI to the next level. It combines everything traders need into one powerful tool: trend detection, cross signals, Bollinger Bands, alerts, and CSV logging.
When paired with the **Seconds-Bar Chart Generator**, you gain full control over ultra-short-term price action. For scalping and binary options, the **speed and precision of “reading the f
FREE
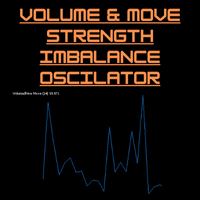
Volume-to-Price Movement Oscillator (VP Oscillator) for MT5 The VP Oscillator highlights the balance (or imbalance) between trading volume and price movement, helping traders spot hidden accumulation, distribution, or weakening trends. How It Works: Calculates each bar’s price range (High–Low) and tick volume. Normalizes both values over a set period (default: 14). Plots the absolute difference between them ×100 — showing how closely price action aligns with trading activity. Interpretation: Hig
FREE

Cloud Trend Matrix: The Trend Indicator That Adapts to the Market Tired of indicators that work well in strong trends but generate dozens of false signals in sideways markets? The Cloud Trend Matrix was designed to solve this exact problem. It's not just another trend follower; it's an intelligent system that reads market volatility and adapts its entry triggers to deliver signals with a higher probability of success. ️ The Concept: A Low-Latency Cloud Unlike traditional indicators, the Cloud T
FREE
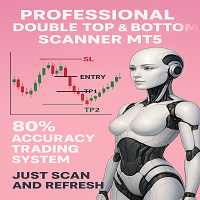
N/B: All our product purchase comes with our free ‘’DAILY SCALPER EA’’ - bit.ly/4qlFLNh Whatsapp Developer for yours after successful purchase
PROFESSIONAL DOUBLE TOP/BOTTOM PATTERN SCANNER
The Ultimate Reversal Trading System for Forex & Crypto Traders
TRANSFORM YOUR TRADING WITH INSTANT PATTERN RECOGNITION
Are you tired of missing profitable reversal setups? Exhausted from staring at charts for hours, trying to spot double tops and bottoms? Frustrated with false breakouts and misse

Introducing this manual trading strategy that will change the way you approach funding tests! Our indicator has been meticulously designed to maximize your success, offering an impressive accuracy rate of 83% on entries . Imagine having a tool at your disposal that guides you accurately through the financial markets, giving you an unparalleled competitive advantage. With our innovative technology, you'll be one step ahead in every operation. You no longer have to rely solely on intuition or expe
FREE

This indicator changes the standard MetaTrader 5 candles to candles at the selected BID, ASK or Average price (BID+ASK)/2. Simply attach the indicator to the chart and select the prices to plot the candles or bars. Indicator Parameters ENUM_DRAW_TYPE - plot candles or bars on the chart For the price - the price for plotting the candles or bars The chart returns to its normal visualization mode after removing the indicator.
FREE

SATORI Monthly Trade Statistics V15 Overview :
An MQL5 Expert Advisor for MetaTrader 5 that visualizes trading performance by month and week, offering a customizable interface to track profits. Key Features : Profit Tracking : Displays monthly and weekly profits, color-coded (green for positive, orange for negative). Customizable : Set time range, magic number, font size, and button sizes; hide zero-profit months. Interactive UI : Toggle month details, update profits, and adjust display scale wi
FREE

This indicator shows ratios between extremes on the chart. You can specify your own ratios (e.g. Fibonacci).
Parameters Most important Density - how much in details to search ratios in extremes. Bigger number means less details, smaller number means more details. Base unit is 1 bar on the chart. History - how far to go in history while searching. When you set -1, the indicator processes all bars from history. Base unit is 1 bar on the chart. Range - how far search ratios from given extreme. Bas
FREE

The Retracement indicator shows the current and historical high, low and mid values. Optionally, it can also display major retracement levels. All these levels together form the significant levels of support and resistance. Therefore, it is essential to know them for every kind of trader.
Levels High Low Midpoint 76,4 % 61,8 % 38,2 % 23,6 %
Main features The indicator shows the actual levels of High, Low, Mid and selected retracements. Four optional retracement levels. Alert notifications
FREE
This indicator is suitable for trend identification, price channel definition and trading signal generation. It combines smoothness, adaptability and visual clarity, which makes it useful for scalping, day trading and swing trading.
Technical details: Hull Moving Average (HMA) – provides a smooth trend line without lags.
Super Smoother – reduces "noise" and creates a smooth curve.
Channel Width – adapts to the timeframe (e.g., narrower on M1, wider on D1).
Debug Logging – enabled in the con
FREE

Swiss Holy Grail Indicator Motivation and functioning The HolyGrail indicator serves to optimize an entry. At that very moment I caught myself, that I went short in an uptrend, so I got into a trade in an anti-cyclical way. Or I have entered into a much too mature trend. This indicator should prevent such errors: One should always be aware of whether it is pro- or anticyclic entry, and one must always know about the maturity of the trend. Don't enter an old trend. Linda Raschke advises to buy th
FREE

*Used by MeditionSeed EA. Meditation is a practice in which an individual uses a technique – such as mindfulness, or focusing the mind on a particular object, thought, or activity – to train attention and awareness, and achieve a mentally clear and emotionally calm and stable state.[1][2][3][4][web 1][web 2] Plant a Meditation Seed to have wonderful future.
FREE

Indicador Regressão Linear – Par de Ativos - INTRADAY Indicador é um oscilador que faz o plot do Resíduo resultado da regressão linear entre os dois ativos inseridos como input do indicador, representado pela fórmula: Y = aX + b + R Onde Y é o valor do ativo dependente, X é o valor do ativo independente, a é a inclinação da reta entre os dois ativos, b é a intersecção da reta e R é o resíduo. O resíduo representa a quantidade da variabilidade que Y que o modelo ajustado não consegue explicar. E
FREE
Smart Volume Flow The Smart Volume Flow is a professional volume analysis tool that takes order flow interpretation to a higher level. It's designed to go beyond simple bar counting by combining hybrid volume , trend context , multi-timeframe filters , and directional strength validation (ADX and +DI/-DI) . Its goal is to dissect, weight, and contextualize market activity, transforming raw data into tactical information for more precise decision-making. What Makes It Different? Unlike MetaTrader

Overview
The Volume SuperTrend AI is an advanced technical indicator used to predict trends in price movements by utilizing a combination of traditional SuperTrend calculation and AI techniques, particularly the k-nearest neighbors (KNN) algorithm.
The Volume SuperTrend AI is designed to provide traders with insights into potential market trends, using both volume-weighted moving averages (VWMA) and the k-nearest neighbors (KNN) algorithm. By combining these approaches, the indicator
Alert for the lines This is an MetaTrader 5 indicator that **detects price crosses with any horizontal line you draw directly on the chart**. No need to manually input levels — simply draw a horizontal line using MT5’s built-in tool, and the indicator does the rest.
**How it works:**
1. **Draw a horizontal line** on your chart using MT5’s native tool (Insert → Objects → Horizontal Line). 2. The indicator **monitors the Bid price in real time**. 3. **Only 1 alert per line per candle** is s
FREE

The indicator calculates the inclination angle between the Highs, Lows and Closes of adjacent bars. The angle can be measured in degrees or radians. A linear graph or a histogram is drawn in a subwindow. You can set the scale for the calculation — floating or fixed. For use in Expert Advisors or indicators, you need to specify a fixed scale.
Parameters Angular measure — degrees or radians. Scale mode for calculation — scaling mode. Free scale — free transformation, the indicator will calculate
FREE
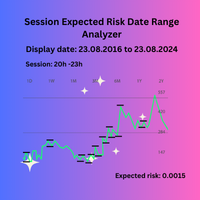
Session Expected Risk Date Range Analyzer: Analyzes price data across specified date ranges to provide detailed insights into financial risk and volatility, using each bar's price metrics for accurate risk assessment.
The Session Expected Risk Date Range Analyzer is a sophisticated tool designed to offer traders and analysts detailed insights into the expected financial risk across specific date ranges. Unlike traditional session-based analysis, this indicator focuses on calculating risk metr
FREE

ProFactor is an indicator generating signals based price on the famous profit factor formula. The calculation is simply defined as gross GREEN BARS divided by gross RED BARS.
That's it in a nutshell, but sometimes the simplest things hold the most value.
So let's imagine your trading system's gross profit for the past year was $40,000 and your gross losses were $20,000. Your Profit Factor would be 2. The ProFactor calculation works on the price of the asset instead of the strategy outco
FREE
The MetaTrader Market is a simple and convenient site where developers can sell their trading applications.
We will help you post your product and explain you how to prepare your product description for the Market. All applications on the Market are encryption-protected and can only be run on a buyer's computer. Illegal copying is impossible.
You are missing trading opportunities:
- Free trading apps
- Over 8,000 signals for copying
- Economic news for exploring financial markets
Registration
Log in
If you do not have an account, please register
Allow the use of cookies to log in to the MQL5.com website.
Please enable the necessary setting in your browser, otherwise you will not be able to log in.