Watch the Market tutorial videos on YouTube
How to buy а trading robot or an indicator
Run your EA on
virtual hosting
virtual hosting
Test аn indicator/trading robot before buying
Want to earn in the Market?
How to present a product for a sell-through
Technical Indicators for MetaTrader 5 - 3

Grab your copy while it’s still available at this price — it may increase at any time! The objective of the black horse indicator is to identify divergences between price action and the VWAP indicator. It employs filters to sift through potential false divergences and signals high-quality, accurate alerts. Bearish divergences are denoted by red dots above the candle, while bullish divergences are represented by green dots below the candle. The primary divergence filter revolves around ATR (Aver
Haven Trend Tracker PRO - Your Navigator in the World of Trends Introducing Haven Trend Tracker PRO – a powerful multi-timeframe indicator designed for traders who want to trade in harmony with the market. Its main goal is to eliminate your doubts by showing the trend direction on both your working (LTF) and higher (HTF) timeframes simultaneously. My other products -> HERE . Trading with the trend is the most reliable strategy. The indicator helps you identify the dominant market force and

MT4 version | Trend Monitor VZ Indicator | Owl Smart Levels Indicator | Owl Smart Levels Strategy | FAQ Elliott wave theory is an interpretation of processes in financial markets that relies on a visual model of waves on price charts. The Valable ZigZag indicator displays the wave structure of the market, which can be used to make trading decisions. The Valable ZigZag indicator is more stable and does not often change its direction like the classic ZigZag indicator, misleading traders.
FREE

Gravity Bands
A powerful all-in-one market structure, momentum, and trend framework for any intraday trader. The Gravity Bands Indicator is designed for traders who want clarity — not noise.
Whether you scalp or day-trade, this tool gives you a clean visual structure of the market: Where the trend is Where momentum is accelerating Where structure shifts happen Where price is fair or extendedWhen sessions activate and volatility begins It does not predict the market. It reveals the market. Gravit

Special offer : ALL TOOLS , just $35 each! New tools will be $30 for the first week or the first 3 purchases ! Trading Tools Channel on MQL5 : Join my MQL5 channel to update the latest news from me SMC is a trading approach that helps traders identify liquidity zones, institutional order placements, and key market turning points. By leveraging SMC principles, traders can navigate the market more effectively, finding optimal entries and exits. The SMC System indicator automates th

Support and Resistance zones Indicator MT5 this indicator knows how to identify tops and bottoms automaticly. This support and resistance indicator creates support lines and resistance lines based on tops and bottoms. how to make support and resistance lines. this is an indicator to make automatic support and resistance lines. how to find support level with indicator. this indicator finds tops and bottoms automaticly. The Indicator automatically creates support lines every time “Fractals” create
FREE

This VWAP is a simple VWAP, but we have added alerts to let you know when the price touches the simple VWAP or when the price crosses the VWAP. This indicator is a traditional VWAP indicator for MetaTrader 5 (MT5). The default parameters are those of the normal VWAP, but you have the ability to use new calculations and the best part: When the price touches or crosses the VWAP, you will be notified through alerts, mobile notifications, email, or sound events. Free anchored VWAP indicator for MT5
FREE

Dark Power is an Indicator for intraday trading. This Indicator is based on Trend Following strategy, also adopting the use of an histogram to determine the right power . We can enter in good price with this Indicator, in order to follow the strong trend on the current instrument. The histogram is calculated based on the size of the bars and two moving averages calculated on the histogram determine the direction of the signal
Key benefits
Easily visible take profit/stop loss lines Intui
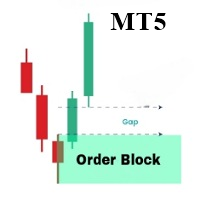
The OrderBlock Analyzer is a powerful custom MetaTrader 5 (MT5) indicator designed to detect and highlight critical Order Blocks on your price charts, helping you identify potential reversal points and key areas of market interest. Key Features: Order Block Detection: Automatically identifies bullish and bearish Order Blocks, marking areas where institutional traders are likely to enter or exit positions. Customizable Display: Choose your preferred colors and styles for bullish and bearish O

Crystal Buy Sell Liquidity – Professional Liquidity Sweep Indicator for MT5 Overview
Crystal Buy Sell Liquidity is a professional trading indicator for MetaTrader 5, designed to detect high-probability buy and sell opportunities using liquidity sweep patterns. The indicator analyzes intraday market structure, identifies institutional liquidity hunting activities, and provides clear visual signals when retail liquidity is swept and price shows reversal confirmation. This approach helps traders
FREE

The Golden PainX and GainX Spike Indicator is a cutting-edge, AI-powered trading tool engineered exclusively for the synthetic indices market. It masterfully combines proprietary spike detection algorithms and real-time price action analysis to generate high-probability, non-repainting trade signals with exceptional accuracy. Important( Use only on PainX 400and GainX 400 (M1 one minute timeframe) Identifies high-probability spikes with non-repainting buy/sell arrows. Automatically sets profit t
This indicator shows the remaining time until the current candle closes on an MT5 chart. It works on selected intraday timeframes and provides a clear, stable display. Features Countdown timer for candle closing on M1, M15, and H1 charts Fixed position, font, and colors for easy readability Informative header and description labels Automatic removal of chart objects when detached Lightweight modular structure for reliable performance How to Use Attach the indicator to an M1, M15 or H1 chart. The
FREE

* Due to the authenticity of data for all major currencies , — use of live charts is recommended . What is UEX Pure USD Euro Index :
Discover the real pulse of the forex market with Pure USD & Euro Index
— an innovative indicator that truly reveals the hidden strength and weakness between the world’s two most powerful currencies . Instead of relying on a single pair like EURUSD, this tool measures the aggregate performance of the U.S. Dollar and the Euro
across multiple major pairs , prov

TREND FLOW PRO TREND FLOW PRO is a non-repainting indicator that shows the market direction. It identifies trend reversals, as well as initial and repeated entries of major market participants.
BOS marks on the chart represent true trend changes and key higher-timeframe levels. The data does not repaint and remains on the chart after each bar closes. Request and receive a detailed PDF guide with strategy examples via private messages. Main indicator elements: BOS FLOW – trend waves and real tre

Dark Oscillator is an Indicator for intraday trading. This Indicator is based on Counter Trend strategy, trying to intercept changes in direction, in advance compared trend following indicators. We can enter in good price with this Indicator, in order to follow the inversion of the trend on the current instrument. It is advised to use low spread ECN brokers. This Indicator does Not repaint and N ot lag . Recommended timeframes are M5, M15 and H1. Recommended working pairs: All. I nst
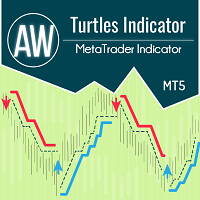
The indicator works according to the Turtle system and classically assumes a time interval of 20 and 55 candles. A trend is monitored over a given time interval. Entry is made at the moment of breakdown of the support or resistance level. The exit signal is a price breakout in the opposite direction of the trend of the same time interval. Advantages:
Instruments: Currency pairs, stocks, commodities, indices, cryptocurrencies Timeframe: Classically D1, also suitable for working with any timefram
FREE

The Basic Renko indicator is a powerful tool for traders looking for a clear and concise market perspective. Our indicator not only simplifies trend visualization, but also offers accurate alerts for reversals, providing a strategic edge in your trading / Free MT4 Version
Features Fully Customizable: Tailor the indicator to your business preferences with advanced customization options. From colors to box size settings, you have full control over how information is displayed on your char
FREE

The indicator is designed for easy construction of synthetic charts based on data of various financial instruments. It will be useful both arbitrage and pair trading, as well as for analysis purposes. Its main advantage is simplicity and clarity. Each chart is given as a common mathematical formula. For example, if you want to plot the spread (difference) between EURUSD and GBPUSD with coefficients 4 and 3, then set the following formula: EURUSD * 4 - GBPUSD * 3 The resulting chart is shown in t

Gold Levels MTF - this is a fine stock technical indicator. The indicator algorithm analyzes the movement of the asset price, displays price levels of support and resistance from all time frames (TF) using the Murray method based on the Gann theory. The indicator indicates overbought and oversold fields, giving an idea of possible reversal points and at the same time giving some idea of the strength of the current trend.
Description of levels: (Extreme Overshoot) - these levels are the ultimate
FREE

This MT5 indicator is a conversion of the UT Bot Alerts indicator by @QuantNomad from TradingView.
It utilizes ATR to generate custom candles on the chart while providing strong entry signals based on these candles.
All buffers, including those for the custom candles and entry signals, are available, making it easy to integrate into any EA.
Additionally, various strategies based on this indicator can be found online, or you can contact me for a custom strategy development.
FREE
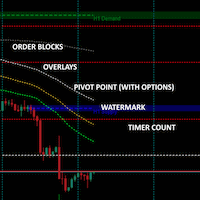
Multiple indicators in one: Order Blocks with optional higher timeframe overlay Watermark Count down timer Pivot points No fancy algorithms but tends to be quite accurate for some symbols to predict bounce, return-to and break-through channels. It is a retrospective indicator (as they all are) and there to help you with better guesses as to where a movement is going towards. The last two order blocks are shaded and extends past the current time. Prior order blocks (within your selected timeframe
FREE

If you are searching for a reliable indicator to trade the ICT concept,The ICT Market Structure provide a user manual for traders using more advanced strategies. This all-in-one indicator focuses on ICT Concepts(Smart Money Concepts). ICT Market Structure trying to understand how institutions trade, helping predict their moves. By understanding and utilizing this strategy, traders can gain valuable insights into market movements and finding more practical entries & exits based on price action. H

Overview This indicator monitors three types of support and resistance levels derived from previous periods: Daily (yesterday’s high and low), Weekly (last week), and Monthly (last month). It visually maps key price levels where reactions are more likely, making it valuable for identifying potential reversals as well as significant breakouts . Features Automatically draws: High/Low of yesterday (Daily) High/Low of the previous week (Weekly) High/Low of the previous month (Monthly) Each level has
FREE

Gold Targets are the best trend indicator. The indicator's unique algorithm analyzes the movement of the asset price, taking into account factors of technical and mathematical analysis, determines the most profitable entry points, issues a signal in the form of an arrow and the price level (BUY Entry / SELL Entry) to open an order. The indicator also immediately displays the price level for Stop Loss and five price levels for Take Profit.
ATTENTION: The indicator is very easy to use. Install t

Was: $299 Now: $99 Supply Demand uses previous price action to identify potential imbalances between buyers and sellers. The key is to identify the better odds zones, not just the untouched ones. Blahtech Supply Demand indicator delivers functionality previously unavailable on any trading platform. This 4-in-1 indicator not only highlights the higher probability zones using a multi-criteria strength engine, but also combines it with multi-timeframe trend analysis, previously confirmed swings a

Volatility Master for MetaTrader is a real-time dashboard tool that scans up to 56 symbols using up to 2 flexible dashboards on different charts to identify high-volatility, trending markets instantly. With clear bullish/bearish signals, customizable alerts, and a user-friendly interface, it helps you avoid range-bound conditions and focus on high-probability trades. Clarity leads to confidence. Trade confidently and protect your capital effectively with this powerful dashboard. Setup & Guide:

The "Haven Candle Timer Countdown" indicator is a simple and convenient tool for traders that helps you keep track of the time frames of various time intervals. It displays the current server time and countdowns to the end of candles on three selected time frames simultaneously. This tool is especially useful for traders who need to know exactly how much time remains until the current candle finishes on multiple time frames at once, enabling them to make timely decisions. Using this indicator si
FREE

Prices move for many reasons and these can vary from one operator to another: software, private and institutional traders simultaneously contribute to the formation of the price, making predictive art very difficult. However, there are measurable factors that bind the price to an underlying trend in line with the physical reality that the financial asset represents: these are the macroeconomic indicators. Large investors use this information wisely to set their strategies. Understanding these m

TPSproTrend PRO identifies the moment when the market actually changes direction and forms an entry point at the beginning of the move.
You enter the market when the price is just starting to move, and not after the movement has already taken place. Indicator It doesn't redraw signals and automatically displays entry points, Stop Loss, and Take Profit, making trading clear, visual, and structured. INSTRUCTIONS RUS - MT4 VERSION Main advantages Signals without redrawing. All signal

WARNING: This indicator is distributed EXCLUSIVELY on MQL5.com MT4 version: https://www.mql5.com/it/market/product/160363 MT5 version: https://www.mql5.com/it/market/product/160410 ============================================================================================= MAX RIBBON ver 1.00 The indicator that shows you the TREND clearly and unambiguously! ============================================================================================= DESCRIPTION MAX RIBBON is an advanced tre

Strong Bull V7 B&C The ultimate M5 indicator for Boom & Crash indices, providing clear, filtered buy/sell signals to eliminate market noise and enhance your trading precision. Benefit-Focused Master the volatile Boom & Crash markets with Strong Bull V7 B&C . This intelligent indicator provides clear visual arrows and text labels for high-probability setups on the M5 timeframe. Its unique symbol-filtering technology automatically hides conflicting signals (no buys on Crash, no sells on Boom), en

Matreshka self-testing and self-optimizing indicator: 1. Is an interpretation of the Elliott Wave Analysis Theory. 2. Based on the principle of the indicator type ZigZag, and the waves are based on the principle of interpretation of the theory of DeMark. 3. Filters waves in length and height. 4. Draws up to six levels of ZigZag at the same time, tracking waves of different orders. 5. Marks Pulsed and Recoil Waves. 6. Draws arrows to open positions 7. Draws three channels. 8. Notes support and re

Hello guys this is The Rangers Fx We managed to create indicator for catching spikes on Boom 1000 Index,Boom 500 Index and Boom 300 Index infact this indicator words on all Booms that are available and the other ones that are still coming the future. How to use this Indicator 1st of all you must turn your timeframe to M1/M5 timeframe this indicator will send you an alert as for when to take your Buy trades and when to exit/close your trades (X) and do not be afraid when you open your trades and

LIMITED TIME SALE - 30% OFF!
WAS $50 - NOW JUST $35! Profit from market structure changes as price reverses and pulls back. The market structure reversal alert indicator identifies when a trend or price move is approaching exhaustion and ready to reverse. It alerts you to changes in market structure which typically occur when a reversal or major pullback are about to happen. The indicator identifies breakouts and price momentum initially, every time a new high or low is formed near a po
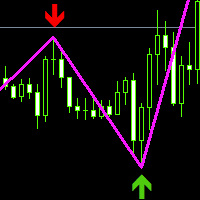
This index is based on the secondary development of zigzag, adding high and low point arrow indication, thickening the line and changing the color. Can be a good display of the current admission trading signals, current long or short. It can be combined with other indicators to determine the trading point, which has great reference value. Compared with the general trend index or oscillation batch standard, the accurate determination is higher from the perspective of historical data research and
FREE

The Best SMC for All indicator is designed for MetaTrader 5 (MT5) to implement Smart Money Concepts (SMC) for analyzing market structure and identifying key trading zones based on price action. It visualizes supply and demand zones, Break of Structure (BOS) levels, Points of Interest (POI), and optional ZigZag patterns to assist traders in making informed decisions. Below is a detailed description of its features:
---
Features
1. Swing High/Low Detection:
- Functionality: Automatically iden
FREE

Special offer : ALL TOOLS , just $35 each! New tools will be $30 for the first week or the first 3 purchases ! Trading Tools Channel on MQL5 : Join my MQL5 channel to update the latest news from me This indicator plots breakout detection zones, referred to as “Smart Breakout Channels”, which are based on volatility-normalized price movement. These zones are shown as dynamic boxes with volume overlays. The tool detects temporary accumulation or distribution ranges using a custom nor

[ My Channel ] , [ My Products ]
This indicator shows the points where the bar’s trend changes due to an instant pressure while the overall trend is moving upward or downward. The arrow displayed by the indicator is drawn if the previous bar meets certain criteria. When building your strategy, you can interpret 3-4 consecutive arrows as a potential breakout signal. For example, when you see the 4th arrow, you may consider opening a trade. This provides a reliable tool to anticipate significant
FREE

The Forex Master Pattern is an alternative form of technical analysis that provides a framework which will help you to find and follow the hidden price pattern that reveals the true intentions of financial markets. This algorithm here does a good job detecting the Phase 1 of the Forex Master Pattern cycle, which is the contraction point (or Value).
On Phase 2 we get higher timeframe activation (also called Expansion), which is where price oscillates above and below the average price defined

Shock Pullback v 3.5 + AI/ML forecasts:
- Add Integrated Artificial and deep learning have been integrated within the MQL5 environment.
- A qualitative addition for integrated future forecasts using deep learning and artificial intelligence (AI/ML) within MQL5, based on the methodology and operation of the core indicator built on the Shock Pullback and its inherent integrated functions.
- Suitable for scalping trading
How to Use the Indicator Shock Pullback: There are 3 images in the com

The indicator draws the time scale on the chart. You can specify the time offset, adjust the size and font to display on the chart ( it is displaying your local time on your chart instead of MT time ). You can also select the desired format for displaying the date and time. You may be interested in my other product , which contains a more advanced version of the Time Scale .
You can also find my other products here Parameters Hours (time shift) — time shift (hours); Minutes (time shift) — time
FREE

Market Structure ICT Indicator 1. Automated Market Structure The biggest advantage is reducing errors from subjective interpretation. Accurate Trend Identification: Automatically identifies BOS (Break of Structure) for trend continuation and CHoCH (Change of Character) for trend reversals. Swing Classification: Users can select the market structure type, from Short-term to Intermediate and Long-term, making it suitable for both Scalpers and Swing Traders. 2. Professional Dashboard No need to swi

Multi timeframe ZigZag indicator. It displays the support/resistance horizontal lines and their breakouts, as well as draws the current targets of the market. It can also display lines of the Fractals indicator and candles from other periods (up to Quarterly). So, you can actually see the supply and demand levels. Indicator – connects key lows and highs to show trend lines. You can also use it as indicator for the Break of Structure(BOS) & Market Structure Shift(MSS). The indicator redraws the

RBC Range Bar Chart is a classical range bar chart indicator. The indicator features price ranges for charting: High/Low price range is a classical option for analysis. It also has Open, High, Low and Close prices. In the first option, two price values are analyzed at the same time, while other options only use one price. Conventionally, range bars are drawn using tick data but since tick data is not available on the server, charting is only possible based on bar data from standard time frames.
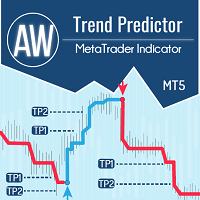
The combination of trend and breakdown levels in one system. An advanced indicator algorithm filters market noise, determines the trend, entry points, as well as possible exit levels. Indicator signals are recorded in a statistical module, which allows you to select the most suitable tools, showing the effectiveness of the signal history. The indicator calculates Take Profit and Stop Loss marks. Manual and instruction -> HERE / MT4 version -> HERE How to trade with the indicator: Trading wit

Pips Chaser indicator has been developed to complement your manual trading. This indicator can be used for both short scalping and long swing trading // MT4 Version
Features
No repaint indicator
This indicator does not change its values when new data arrives
Trading pairs
Any currency pair
Time frame
H1 is preferable, but you can adapt it to any timeframe
Trading time
Around the clock
Buffers Buy Buffer: 0 / Sell Buffer: 1
Requirements
The use of an ECN broker with tight spreads
FREE

The Market Structure Analyzer is a powerful tool designed for traders who follow market structure and smart money concepts. This comprehensive indicator provides a suite of features to assist in identifying key market levels, potential entry points, and areas of liquidity. Here's what it offers:
1. Swing High/Low Detection : Accurately identifies and marks swing highs and lows, providing a clear view of market structure.
2. Dynamic Supply and Demand Zones: Draws precise supply and demand zone
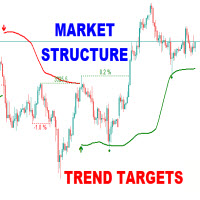
The Market Structure Trend Targets is a powerful trading indicator designed to give traders a clear, structured, and data-driven view of market momentum, breakouts, and key price reaction zones. Built on the principles of smart market structure analysis , it helps identify not only trend direction, but also precise breakout levels , trend exhaustion , and potential reversal zones — all with visual clarity and trader-friendly metrics. Key Features Breakout Points with Numbered Markers Track signi

TickFlow is a tool for tick-data analysis and visual highlighting of significant zones on the chart. The utility aggregates current and historical ticks, shows the buy/sell balance, and helps to identify support/resistance levels and cluster zones. This is the MetaTrader 4 version. How it works (brief) TickFlow collects tick data and aggregates it by price steps and candles. Based on the collected data the indicator builds visual layers: up/down tick counters, buy/sell ratio, historical levels

The Moving Average Convergence Divergence (MACD) trading strategy is a popular technical analysis tool that is used to identify changes in momentum and trend direction. The MACD is calculated by subtracting the 26-period exponential moving average (EMA) from the 12-period EMA. A 9-period EMA, called the "signal line," is then plotted on top of the MACD to act as a trigger for buy and sell signals.
The MACD is considered to be in bullish territory when the MACD line is above the signal line and
FREE

The "Power of Three" (PO3) is a concept developed by the Inner Circle Trader (ICT) to illustrate a three-stage approach used by smart money in the markets: Accumulation, Manipulation, and Distribution . ICT traders view this as a foundational pattern that can explain the formation of any candle on a price chart. In simple terms, this concept is effective for any time frame, as long as there's a defined start, highest point, lowest point, and end. MT4 - https://www.mql5.com/en/market/product/1
FREE
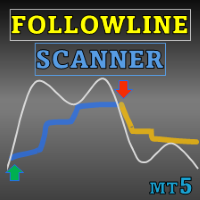
Special offer : ALL TOOLS , just $35 each! New tools will be $30 for the first week or the first 3 purchases ! Trading Tools Channel on MQL5 : Join my MQL5 channel to update the latest news from me Maximize your trading edge with Follow Line MT5 with Scanner, an advanced volatility-based indicator designed for serious traders. This tool combines the power of Bollinger Bands with customizable settings, offering precise insights into price movements. See more MT4 version at: Follow
FREE

Master market trends with the SuperTrend Alert MT5, a powerful indicator designed to deliver precise trend-following signals for forex, stocks, crypto, and commodities trading. Celebrated in trading communities like Forex Factory and Reddit’s r/Forex, and praised in discussions on Investopedia and TradingView for its robust trend detection, this indicator is a go-to tool for traders seeking reliable entries and exits. Users report up to 90% accuracy in identifying trend directions when combinin
FREE

What is the Volume Weighted Average Price (VWAP)? The volume weighted average price (VWAP) is a trading benchmark used by traders that gives the average price an instrument has traded at throughout the day, based on both volume and price. It is important because it provides traders with insight into both the trend and value of the instrument.
What is the Difference between VWAP and AVWAP? While VWAP is having as starting point the beggining of the day,week,month etc. in the AVWAP you can pla

Auto Fibonacci Retracement Indicator — Flexible and Reliable This isn’t just another Auto Fibonacci Retracement indicator. It’s one of the most flexible and dependable tools available . If you find it useful, please consider leaving a review or comment — your feedback means a lot! Check out my other helpful tools below: Smart Alert Manager - Set up advanced alerts and send them to Mobile, Telegram, Discord, Webhook...
Timeframes Trend Scanner - Scan the trend of assets in difference timefr
FREE

Trend Battle Indicator
Overview The Trend Battle Indicator is a professional technical analysis tool that reveals the battle between buyers (Bulls) and sellers (Bears) in the market through a comprehensive dashboard. Using an intuitive visual interface, the indicator offers a unique perspective on market power dynamics by analyzing the last twenty bars to provide precise insights into momentum and directional strength. Additionally, the panel provides automatic real-time updates for bars in for

RSI divergence indicator finds divergences between price chart and RSI indicator and informs you with alerts (popup, mobile notification or email). Its main use is to find trend reversals in the chart. Always use the divergence indicators with other technical assets like support resistance zones, candlestick patterns and price action to have a higher possibility to find trend reversals. Three confirmation type for RSI divergences: RSI line cross 50 level Price returns to previous H/L C
FREE
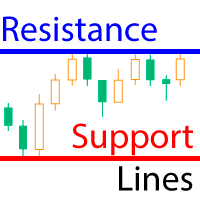
The indicator calculates fractal lines, which are technically psychological support/resistance lines. In fact, these are the highs and lows of the price over a period of time. The indicator works on all charts and timeframes. This free version of the Resistance Support Lines Pro indicator comes as is! Settings: These settings cannot be changed in this version Fractal Candels = 5 - number of candles from which a fractal is built. Calculates the maximum/minimum at which a psychological price can b
FREE
Indicator of time until the end of the candle. Shows the time until the end of the candle, as well as the server time. Text can display the trend or direction of the candle, sound notifications are built in Peculiarities:
Displays the time until the end of the current candle as well as other timeframes that can be adjusted or disabled if necessary AW Candle Time can select the direction of the current candle or trend with the AW Super Trend indicator The trend strategy is highlighted in the sele
FREE
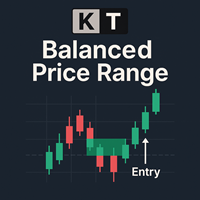
The KT Balanced Price Range highlights the overlapping area between two consecutive opposite Fair Value Gaps (FVGs) . This concept, known as Balanced Price Range (BPR), is popular among price action traders, especially those following Smart Money Concepts (SMC) and Inner Circle Trader (ICT) methods. Traders often use these BPR zones to identify high-probability trade setups, especially during pullbacks or when looking for trend continuation opportunities. BPR zones often mark areas where the mar

Golden Spikes Indicator Technical indicator for synthetic indices trading on M1 timeframe. Compatible with Boom/Crash indices on Deriv platform and Gain/Pain indices on Weltrade platform. send me A private message to receive trade ASISTANT EA.. booklet guide: https://drive.google.com/file/d/1knQJqGHZSP5eQN24ndRz2ayZVCst6XhN/view?usp=sharing
Also check my premium spikes bot: https://www.mql5.com/en/market/product/142350 Features Uses Parabolic SAR, RSI, and Bollinger Bands analysis Three risk

Documentation for connecting Metatrader 5 with Python with a simple drag and drop EA.
A full end-to-end solution ,fully tested ,fast and efficient!
The Pytrader ecosystem consists of a python script and a MT5 or MT4 version EA.
Further for the licensing an indicator is used.
The communication between the python script and the EA is based on sockets.
EA is the Server and the python script the Client .
It is always query(function / python script) and output(data / server).
T
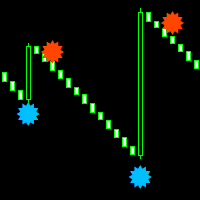
Boom and crash smasher free indicator that works on all timeframe from the one minute to the monthly timeframe. the indicator is 100% non-repaint. the indicator come with sound alerts and email push notification the indicator appears on the current candle stick for faster entries can be used on all charts and renko charts orange dot is your sell signal blue dot is your buy signal
FREE

Welcome to Twin Peak Indicator MT5 --(Double Top / Double Bottom)-- The Double Top and Bottom Indicator is a technical analysis tool designed to identify potential reversal patterns in the market.
It identifies areas where the price has made two consecutive peaks or troughs of nearly equal height, followed by a price movement in the opposite direction.
This pattern indicates that the market is losing momentum and may be ready for a trend reversal. *Contact me after the purchase to send you ins

Fine Timeframes is a sub-minute timeframe indicator for MT5. It creates charts with intervals from 1 to 30 seconds, giving you access to market movements that remain invisible on minute and hourly charts, while preserving full trading functionality: you can open and close positions just like on standard timeframes. Fine Timeframes works only on live ticks and is not designed for the Strategy Tester — download the demo version and test the indicator under real market conditions on EURUSD and AUDU

Expert Advisor Version
If you prefer automated trading instead of manual signals, you can find the Expert Advisor version of this indicator here:
https://www.mql5.com/en/market/product/148222
This indicator computes price reentry moments after a candle has pierced outside the Bollinger Bands , combining that signal with an RSI confirmation to reduce false positives.
A Buy ReEntry signal is detected when price had moved below the lower band and then returns inside, with the optional confirmati
FREE

CGE Trading Suite is a market analysis system designed to eliminate guesswork from trading. It continuously adapts to real-time price behavior, helping traders stay aligned with key market levels and evolving market conditions. This comprehensive system integrates multiple analytical tools into a single workflow, including dynamic grid mapping, liquidity behavior analysis, ECM, trend lines, supply and demand zones, MIDAS, trade cycles, and directional channel projections. Together, these tools p

Worried about your next trade? Tired of not knowing if your strategy actually works? With CRT Liquidity Pro, you trade with real stats, not emotions. Know your probabilities, track your performance, and trade with confidence—based on the Power of 3, Smart liquidity detection and CRT confirmations. Did you like to see the reality of the CRT Liquidity strategy? After your purchase contact us and we will provide you one of our other products for free.
Check our other products for more real strate

Adaptive ADR The Adaptive ADR is a professional indicator for calculating and visualizing the Average Daily Range (ADR). Calculation & Methods Four smoothing types: SMA , EMA , SMMA (Wilder) , LWMA Adaptable to various trading styles and volatility models Dynamic Day Logic Automatically starts with the trading session Sets two symmetrical levels around the daily opening price Levels narrow adaptively until the ADR value is reached Once ADR is reached, levels remain fixed until the end of the da

Volume Weighted Average Price (VWAP) The volume weighted average price (VWAP) is a trading benchmark used by traders that gives the average price a security has traded at throughout the day, based on both volume and price. It is important because it provides traders with insight into both the trend and value of a security. This indicator VWAP V2 is free and is the manual version of the extended Easy VWAP indicator (30 Euro), where the date and time properties are automatically entered. With
FREE
MetaTrader Market - trading robots and technical indicators for traders are available right in your trading terminal.
The MQL5.community payment system is available to all registered users of the MQL5.com site for transactions on MetaTrader Services. You can deposit and withdraw money using WebMoney, PayPal or a bank card.
You are missing trading opportunities:
- Free trading apps
- Over 8,000 signals for copying
- Economic news for exploring financial markets
Registration
Log in
If you do not have an account, please register
Allow the use of cookies to log in to the MQL5.com website.
Please enable the necessary setting in your browser, otherwise you will not be able to log in.