Watch the Market tutorial videos on YouTube
How to buy а trading robot or an indicator
Run your EA on
virtual hosting
virtual hosting
Test аn indicator/trading robot before buying
Want to earn in the Market?
How to present a product for a sell-through
Technical Indicators for MetaTrader 5 - 91

SSL Indicator for MetaTrader 5 - Powerful Trend-Following Tool The SSL Indicator is a highly efficient and reliable trend-following tool designed to help traders identify market trends with ease and precision. Based on moving averages, the SSL (Step Stop Line) Indicator changes color and provides clear visual cues when there is a potential trend reversal. This tool is excellent for traders looking to capitalize on strong market trends while avoiding false signals commonly found in ranging market

The Crash and Boom VT indicator is a highly adaptable trading tool designed to operate across a wide range of market conditions, including Crash 300, Crash 500, Crash 1000, Boom 300, Boom 500, and Boom 1000. Engineered to blend Oversold (OS), Overbought (OB), and Macho periods, this advanced indicator generates reliable trading signals, especially when used on a 5-minute timeframe. For the best outcomes, it's recommended to set the Macho period between 4-5. While the indicator offers robust capa

The Real Trend indicator simplifies the decision-making process by recognizing reversals with a built-in algorithm and then confirming signals at support/resistance levels. Implements a type of technical analysis based on the idea that the market is cyclical.
Thus, the indicator follows the market trend with great reliability, ignoring sharp market fluctuations and noise around the average price. The indicator can be used both for pipsing on short periods and for long-term trading.

По стратегии "Торговый Хаос" ( Билл Уильямс) .
Индикатор, окрашивает бары в цвета awesome oscillator,
а также, окрашивает бар в синий цвет, при возникновении *приседающего* бара MFI. Красный бар - бар находится в отрицательной зоне. Зеленый бар - бар находится в положительной зоне. Индикатор является составной частью торговой системы. Не забудьте установить на график т акие индикаторы, как индикатор Аллигатора, Осциллятор Awesome, индикатор Фракталов.
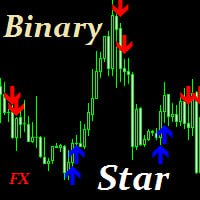
The indicator is designed for binary options trading You can also scalp with it. It is recommended to enter the trade on the next candle after the signal The indicator does not redraw does not recalculate Works well on indexes Like Boom and Crash Indicator signals need to be filtered, this can be done using support and resistance levels Or use standard indicators for filtering such as Bollinger bands
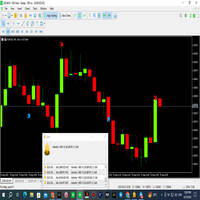
Alright. This indicator works on MT5 and mt4 and is very easy to use. When you receive a signal from it, you wait for that candle with the signal to close and you enter your trade at the beginning of the next new candle. A red arrow means sell and a green arrow means buy. like for easy identification of trade signal. Are you okay with that?
candle 1 minute
expire 1 minute
if you need any help. please feel free to message me,
thank you

The liquidity swings indicator highlights swing areas with existent trading activity. The number of times price revisited a swing area is highlighted by a zone delimiting the swing areas. Additionally, the accumulated volume within swing areas is highlighted by labels on the chart. An option to filter out swing areas with volume/counts not reaching a user-set threshold is also included.
This indicator by its very nature is not real-time and is meant for descriptive analysis alongside other com

Introducing "X Marks the Spot" – Your Ultimate MetaTrader 5 Indicator for Perfect Trades! Are you tired of the guesswork in trading? Ready to take your MetaTrader 5 experience to a whole new level? Look no further – "X Marks the Spot" is here to revolutionize your trading strategy! What is "X Marks the Spot"? "X Marks the Spot" is not just another indicator – it's your personal trading compass that works seamlessly on all timeframes . Whether you're a beginner or an experienced trader,
DYJ PeakAndTrough indicator is an advanced EMA trading system. It includes the future trend line and trend angle and the angle display of each peak and trough.
At the end of the peak of the EMA, there is a downward trend, and at the end of the trough of the EMA, there is a upward trend. Please download the parameter template file ( Link ) in the comments section.
Note: Set the parameter IsDrawLineOfWaveWidth = true immediately after running the indicator.
Input
InpMAPeriod = 25 InpMAShift = 0
Introducing the True Range MACD Indicator – Your Ultimate Trading Companion! Tired of missing out on profitable trading opportunities? Wish you could predict buy and sell signals ahead of time? Look no further! The True Range MACD Indicator is here to revolutionize your trading game and take your success to new heights. Unleash the Power of True Range Convergence and Divergence Unlike the conventional MACD you find in MT5, the True Range MACD goes above and beyond by analyzing true rang

Introducing the Quantitative Moving Average Indicator! Unlock the Power of True Real-Time Data Analysis for Your Trades with Neural Network Advanced Calculation System Framework! Are you tired of relying on outdated indicators that don't provide accurate signals? Look no further! The Quantitive Moving Average Indicator is here to revolutionize your trading experience using cutting-edge technology. What makes our indicator stand out? True Real-Time Data : Say goodbye to lagging si

The indicator has three signals. The two arrow signals and when you get the message expect the spike. You only enter the market when all the conditions are met. The big arrow indicates the overall market direction while the small arrows indicates the support and resistance. Message "Expect spike" indicates that the market is about to spike so if you are trading against it you should exit that market.

Introducing the uGenesys Psychological Levels Indicator – Your Key to Precision Trading with Real-Time Alerts! Are you tired of guessing where the market might turn? Do you want a tool that can accurately identify psychological levels and notify you when price touches a key level? Look no further – the uGenesys Psychological Levels Indicator is here to revolutionize your trading experience. Imagine having a tool that not only identifies psychological levels with unmatched accuracy but also aler
The KT MTF Order Blocks automatically plots the institutional order blocks by using a unique blend of price action with comprehensive multi-timeframe analysis. This advanced approach reveals the area of price reversal, originating from significant buy and sell orders strategically placed by major market players.
Features
Algorithmic Precision: A refined and distinctive order block algorithm meticulously crafted to precisely identify the most pivotal order blocks, often triggering price reversa

The SuperTrend AI indicator is a novel take on bridging the gap between the K-means clustering machine learning method & technical indicators. In this case, we apply K-Means clustering to the famous SuperTrend indicator. USAGE Users can interpret the SuperTrend AI trailing stop similarly to the regular SuperTrend indicator. Using higher minimum/maximum factors will return longer-term signals. (image 1) The displayed performance metrics displayed on each signal allow for a deeper interpretat

Hello There,
Today I want to show you my new researchable fore BUY SELL indicator,
Golden Scalp System v2
it work all asset,
it work all time frame, but i recommend start 5 minute to H1
when you receive a signal just take trade and stay wait for your take profit
asset
All Major Pair And minor
IT WORK ALSO XAUUSD
Fantastic results,
for more info,,, message us
thank you

In the ever-evolving world of Forex trading, understanding the different trading sessions is paramount to making informed trading decisions. Each trading session brings its own unique characteristics, opportunities, and challenges, and recognizing these can greatly enhance your trading strategies. Whether you're a novice or a seasoned trader, the Forex market's three main trading sessions – Asian, London, and New York – are crucial milestones that dictate market behavior and potential trade set

Strong Candle Indicates the size of each candlestick with the text value above it and indicates which candlestick has a body larger than the one specified in the parameters in percentage, that is, a strong candlestick (between Size_Min and Size_Max) with at least x% of body. The candlestick size is placed in the buffer and that is the buy or sell indication, where: value > 0 = bullish candle or value < 0 bearish candle, value = 0 means no indication (the candle did not match the desired pattern
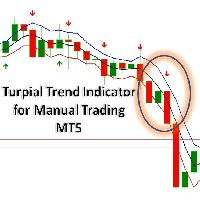
Turpial Trend Indicator for Manual Trading. Indicator (arrow) for all Symbols and Periodicity. This indicator considers a pullback strategy and a trend strategy. The strategy that is based on criteria for the Rsi, Atr and Macd indicators. The channel band corresponds to the maximum and minimum average values of three bars (Bill Williams 3-bar strategy). BUY when there is a Green Arrow. It is advisable to place the StopLoss below the bottom line of the channel. SELL when there is a Red Arrow. I

В этой индикатор график показателя не отражает на основную ценового движения и не выделяет поворотные точки. Полученный показатель сглаживается по методом ЕМА. График сглаженного показателя достаточно и с минимальным запаздыванием аппроксимируется колебания ценового движения и поворотные точки. Нормировка позволяет значение индикатор интерпретировать как степень перепроданности рынок. Осциллятор поваляет различать сигналы о перекупленности/перепроданности рынка, об окончании тренда и о развор
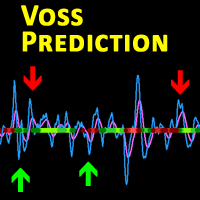
Description This is a modified version of the popular Voss Predictive Filter - A peek into the future by Dr. John Ehlers. It contains 2 lines - V-Line (blue) and F-Line (red), a trend indication and BUY/SELL signals.
Usage Buy Green dots indicate an up trend. Open a BUY position if the V-Line crosses the F-Line from below and an up trend is signaled (green dots) Close BUY position if V-Lines falls beneath F-Line again Sell Red dots indicate a down trend Open a sell position if V-Line falls b

This indicator is used to find support and resistance lines
The support and pressure of different time periods can be found in the same icon cycle, and two time periods are provided here
Parameter Description:
---------------------- Main ---------------------
Timeframe //Used to select the main time period (recommended as the default PERIOD_D1);
Retracement interval //This value is the root number of backtracking k-lines (recommended to be 20 by default);
The
This indicator is a unique, high quality and affordable trading tool because we have incorporated a number of proprietary features and a new formula. With this update, you will be able to show double timeframe zones. You will not only be able to show a higher TF but to show both, the chart TF, PLUS the higher TF: SHOWING NESTED ZONES. All Supply Demand traders beautifully integrated with Moving Average Clouds. I am sure you will love it. Tips User Manual Use my template Optimize Zone Strength f
The KT Buy Sell Volume is a powerful tool traders use to gauge the strength and weakness of price movements. In the whirlwind of the Forex market, traders aim to identify and ride the waves of a bullish or bearish trend that exudes strength and potential. However, recognizing these trends necessitates a method, metric, or indicator to quantify their strength. One crucial factor that traders examine for this purpose is volume. Volume refers to the number of shares or contracts traded in a securit

The indicator determines signals on a system of two components:
- correct fractals. The indicator that comes with MT4 and MT5 is quite crude, since some levels are calculated incorrectly. This indicator shows signals for the breakdown of strong levels. - wave level for fractals. Not to be confused with zigzag.
It is better to use on higher timeframes (M15 and higher), where the indicator perfectly shows entry points and reversal situations.
Of course, you can use standard indicators from the
KT Momentum Histogram provides traders with a visualization of the momentum of a particular asset, which helps determine the strength and potential direction of a market trend. The indicator calculates and operates based on momentum in trading.
What Exactly is a Momentum Histogram
Momentum is the rate of acceleration of an asset's price or volume. In other words, it measures the speed at which the price of an asset is moving in a particular direction over a specific period of time. Positive mo
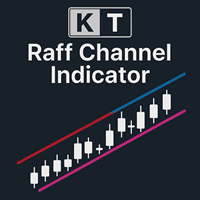
The KT Raff Channel is an enhanced and refined iteration of the original Raff channel concept pioneered by Gilbert Raff in 1996. This indicator builds upon Raff's initial work, incorporating modifications and advancements to provide traders with a more sophisticated and powerful tool. Gilbert Raff, a renowned name in the field of financial market analysis, is the developer of the Raff Regression Channel. This technical tool is designed for discerning and validating possible market price trends.

Introducing Auto Trendline Pro : Your Ultimate Trading Companion Are you tired of manually drawing trendlines on your forex charts? Do you wish for a tool that can simplify your trading while providing timely alerts? Look no further, because Auto Trendline Pro is here to revolutionize your trading experience. In the fast-paced world of forex trading, staying ahead of the curve is essential. Identifying trends, both upward and downward, can be a game-changer. This is where Auto Trendline Pro ste

The KT Trades Info indicator is useful for traders wishing to stay informed about their trading performance. This indicator provides real-time updates on the profitability of all ongoing and completed trades, enabling traders to make well-informed decisions. By incorporating key financial metrics, it provides a comprehensive picture of a trader's financial status at a glance. This means traders can monitor their performance with increased accuracy and precision, facilitating better risk manageme

The KT 4 Time Frame Trend is an invaluable forex indicator for traders seeking to identify the trend direction across 4-time frames accurately. This innovative indicator allows users to simultaneously observe and analyze price trends across four different timeframes. Whether you're a beginner or an experienced trader, this tool offers an enhanced understanding of trend dynamics, leading to improved trading strategies on your trading platform. The capability to concurrently monitor multiple timef
xTrend The trend becomes obviously! Advangtage ・The trend becomes obviusly:Connect different color and width rise line,fall line and range line to present the overall trend of the period from spefied past time to now.It's usefull for speedy discretionary trading! ・Pips can be displayed:Displaying pips to help to know how much changed in that line obviously and immediately! ・Simply to setting:Only few settings about the period,the color and width,and whether to display pips. ・Unique algorithm

Hello My Dear Friend,
im introduce about Binary Option Premium V8
it work, all currency pair
1 minute time frame,
1-5 minute expire
100% non repaint,
no delay signal
Alright. This indicator works on MT5 and is very easy to use. When you receive a signal from it, you wait for that candle with the signal to close and you enter your trade at the beginning of the next new candle. A red arrow means sell and a green arrow means buy. for easy identification of trade signal. Are you okay with that?
W

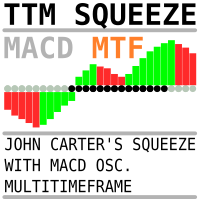
This indicator created based on original John Carter's TTM_Squeeze indicator and represents "squeeze" of the market which can be followed (or maybe not) by significant moves. Original indicator prints black dots when Bollinger Bands are inside Kelthner Channels and exactly this implemented in this custom version. Instead of original implementation as momentum indicator MACD indicator with standard settings 12-26-9 is being used. Mainly, the indicator is useful for understanding when it's better
Hello There,
i introduce about Swing Premium Forex Mt5 Indicator
it work all currency pair
it work all time frame,
100% non repaint, no delay
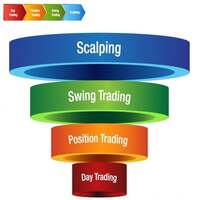
Swing trading is a method in which traders attempt to take advantage of market fluctuations. They buy a security when they believe the market will rise and sell if they feel the market will fall, which, as you can imagine, is common in most trading strategies, irrespective of trading style.
The four most frequently occurring patterns in the swing trading

This product is designed for the MT5 platform and offers two key features: VWAP (Volume Weighted Average Price) calculation and Volume Profile analysis. Advantages: VWAP Calculation: The product calculates the VWAP, which is a popular indicator used by traders to determine the average price of a security based on its trading volume. It helps identify potential buying or selling opportunities by comparing the current price to the average price weighted by volume. Volume Profile Analysis: The prod
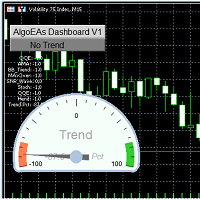
AlgoEAs Trend Dashboard V1 Indicator for MT5
Introduction: This is a Dashboard Indicator based on 7 built in Multi Timeframe indicators. This strategy gives Buy/Sell Ideas based on 9 trend states. Easy to view gas guage to view current trend. Has as optional Alerts to enable with 9 messages. Run on M15 chart, with M15, H1, and H4 indicator time frames. Great tool!
Features: Non-Repainting Dashboard For Desktop MT5 Only, Works On Any Mt5 Pair Great for Intraday and Swing Trading Easy view gas

This pass-band oscillator seeks to pass-band out both high and low frequencies from market data to eliminate wiggles from the resultant signal thus significantly reducing lag. This pass-band indicator achieves this by using 2 differenced EMA's of varying periods. (40 and 60). Trigger points for the pass-band oscillator are added with a RMS cyclic envelope over the Signal line. Output of the pass-band waveform is calculated by summing its square over the last 50 bars and taking the square root of

This is the Full Version, to get the free version please contact me. The free version works on “GBPCHF” charts. All symbols and time frames scanner. Harmonic Pattern
Harmonic patterns are used in technical analysis that traders use to find trend reversals. They are considered one of the most accurate technical analysis tools, as they allow traders to predict the future price movement direction and the potential trend targets. Also, unlike many other technical tools, the number of false signals

Divergence Detection: The indicator is designed to identify divergences between the price movement and the Stochastics oscillator. This can help traders spot potential trend reversals or trend continuation opportunities. Early Warning System: By capturing divergences, the Stochastics Divergence Indicator can provide an early warning of possible market turning points. This allows traders to take timely action and make informed decisions. Versatility: The indicator can be applied to various finan
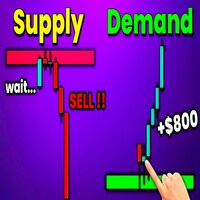
Best Solution for any Newbie or Expert Trader! This indicator is a unique, high quality and affordable trading tool because we have incorporated a number of proprietary features and a new formula. With this update, you will be able to show double timeframe zones. You will not only be able to show a higher TF but to show both, the chart TF, PLUS the higher TF: SHOWING NESTED ZONES. All Supply Demand traders will love it. :)

Unlock the power of precise trend analysis and supercharge your trading strategy with Momentum Trend on MT5! Our cutting-edge trading tool is designed to provide traders with the essential insights and data needed to navigate the dynamic world of financial markets. Key Features: Accurate Trend Analysis : Momentum Trend utilizes advanced algorithms to accurately identify market trends, helping you stay ahead of the curve and make informed trading decisions. Real-Time Data : Stay updated with real
ATR Stops is an indicator which shows Dynamic support and resistance lines by considering ATR value and also a multiplier. its highly effective to find out the trend direction and also is useful for using as stop loss levels. it could be used in different ways one usual way is to buy when line becomes green and sell when it becomes red. when its combined with money management rules and risk reward considerations there is good results.

Pivot Point Super Trend is another type of famous super trend indicator which is equipped with pivot points in different way. this indicator used to be available in the Trading view and this is converted from there to the MT5 language. MT4 version of the indicator is also available and you can find in my products. there are also buy/sell signals shown on the screen.

The VIX Fix is a volatility indicator developed by renowned trader Larry Williams. It's designed to measure volatility in assets that don't have options or futures, such as individual stocks and forex markets. Essentially, it acts as a synthetic VIX (Volatility Index) for any asset , providing a gauge of market uncertainty. This modified version of William's indicator helps you to find market bottoms and market tops. It comes with 2 styles: Stochastic and histogram style. Please see screenshots

The Schaff Trend Cycle indicator is the product of combining Slow Stochastics and the moving average convergence/divergence (MACD). The MACD has a reputation as a trend indicator, but it's also notorious for lagging due to its slow responsive signal line. The improved signal line gives the STC its relevance as an early warning sign to detect currency trends. this indicator is converted from Trading View code of STC Indicator - A Better MACD [SHK]

Volume Profile is a very useful indicator . it allows you to spot the price levels where important price action took place. It is similar to support and resistance levels but with a different logic. ( Check Out Fixed Range Volume Profile MT5 )
One of the first thing that traders mark up when analyzing a chart is support and resistance. Volume Profile can be used for doing that too.
The indicator scans the defined number of previous bars and calculates the volume of activity at each price le

This product is converted form Trading View of Kivanc Ozbilgic to be used on MT5 and below are descriptions of developer on Trading View:
Anıl Özekşi's latest development on his precious OTT - Optimized Trend Tracker:
In this version, there are two lines of OTT which are derived from HIGHEST price values (HOTT) and LOVEST price values (LOTT) which were originally sourced to CLOSE values on default OTT.
Another significant difference is there is no Support Line (Moving Average) in this version

In the fast-paced and ever-evolving world of stock trading, having a reliable compass is essential for navigating the complexities of the financial markets. Meet the Stock Trade Navigator, your trusted partner in the quest for investments. Unlock the Power of Data: Our Stock Trade Navigator is not just a tool; it's your data-driven co-pilot. Harnessing cutting-edge algorithms and real-time market data, it empowers you with a comprehensive view of the financial landscape, enabling you to make inf

The QQE indicator is a momentum-based indicator used to identify trends and sideways. The Qualitative Quantitative Estimate (QQE) indicator works like a smoothed version of the popular Relative Strength Index (RSI) indicator. QQE extends the RSI by adding two volatility-based trailing stops. This indicator is converted Qfrom Trading View QQE MOD by Mihkel00 to be used in MT5 Version.

The SuperTrend indicator is a popular technical analysis tool used by traders and investors to identify trends in the price of a financial instrument, such as a stock, currency pair, or commodity. It is primarily used in chart analysis to help traders make decisions about entering or exiting positions in the market. this version of super trend indicator is exactly converted from trading view to be used in MT5

Welcome to the world of SMC (Smart Money Concepts) Trading, where we empower traders with the tools and knowledge to make smarter trading decisions. Our latest addition to our suite of trading tools is the SMC Trading Pro indicator, version 1.0. Key Features: Major Market Structure Identification with BODY break. Order Block must be in Major Swing ( not Small Swing ). Order Block with Fair Value Gap Detection. Order Block in Discount | Premium zone. Filter for only Bullish, Bearish or All Order
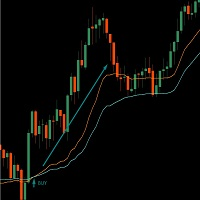
This indicator is built at the intersection of two VMA (Variable Moving Average, or VIDYA or Variable Index Dynamic Average) indicators. Flexible settings will allow you to more accurately find the entry point. The fast one crosses the slow one and this is a signal to buy or sell. Works on all instruments. Brief Description of the VMA Indicator: VMA (Variable Moving Average, also known as VIDYA or Variable Index Dynamic Average) is an exponential moving average that automatically adjusts the smo

This indicator identifies the global trend and has a powerful algorithm for filtering out any type of noise that can interfere with trend direction identification. A special filter shows areas of sideways trend, consolidation or flat, which allows you to avoid any uncertainties in the market movement vision and gives a clear understanding of the global trend movement.
This indicator has no analogues and gives it unique advantages in the analysis of price movements and determination of the dire
The same indicator as here https://www.mql5.com/ru/market/product/105089?source=Site+Market+My+Products+Page but with timeframe change possibility. It is convinient to see picture from different timeframes in the single chart. When using multiple timeframes, it is recommended (A.Elder "The new trading for a living") to adhere to a coefficient of 5 or 6. That is, the two older timeframes for a 5-minute chart will be 30 minutes and 3 hours.

CHRISTMAS SALE — LIMITED TIME!
Get Trend Reader Indicator with a huge –65% discount AND receive Trend Matrix EA as a FREE BONUS ! Special Christmas Price: $107
(Regular Price: $297 — You Save $190!) FREE BONUS: Trend Matrix EA
A powerful multi-symbol strategy packed with advanced features, supporting 10 trading pairs — real value: $447! After completing your purchase, simply contact me and I will send you your BONUS EA immediately. Don’t miss this once-a-year opportunity! Trend Reader Indica

KT Supply and Demand indicator identifies and plots key supply and demand zones. It achieves this by analyzing swing points and integrating them with a multi-timeframe analysis, ensuring that only the most crucial supply-demand zones are highlighted. This advanced method highlights the regions where prices are likely to reverse, stemming from significant supply-demand zones established by recent price movements.
Features
Precision Analysis: Our refined algorithm is designed to accurately pinpo
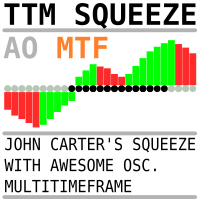
The same indicator as here Скачайте Технический индикатор 'John Carters TTM Squeeze with MACD Multitimeframe' для MetaTrader 5 в магазине MetaTrader Market (mql5.com) , but instead of MACD, Bill Williams' AO (Awesome Oscillator) is used. It goes well with a sleeping Alligator to determine periods of "compression-calm", which may be followed by significant movement.
It is useful to use an indicator from a higher timeframe (coefficient 5 or 6) to determine the possible direction of a breakout. I
Introduction to the Candle Time Indicator The Candle Time Indicator for MetaTrader 5 (MT5), helps users know how much time on a candlestick is remaining. This is a simple but incredibly powerful and useful tool. To download the Dagangduit CandleTimer.ex5 indicator, check the bottom of this post. It’s one of the best forex time indicators in its category. The function of the indicator will not change, even if you change the name of the indicator. The candlestick countdown timer will tell you how
The "Dagangduit Spread Indicator" is a versatile tool designed to provide traders with essential information about the current spread in the chart window. This indicator offers customizable features, including font parameters, display location on the chart, spread normalization, and alerts to enhance your trading experience. Key Features: Real-time Spread Display : The indicator displays the current spread in real-time on your trading chart, allowing you to stay informed about the cost of execut

Indicator can be used for dxy correlation trading. it calculates the dollar index (USDX or DXY) using the EUR/USD, USD/JPY, GBP/USD, USD/CAD, USD/CHF and USD/SEK currency pairs. In order to trade them, you need to find a confirmed technical analysis pattern on the DXY chart and look for a correlated currency pair that has the same picture on its price chart.
The formula used for calculation is the following: USDX = 50.14348112 × EURUSD -0.576 × USDJPY 0.136 × GBPUSD -0.119 × USDCAD 0.091

Best Pivot Point Indicator display pivot points and support and resistance lines for the intraday trading. It calculates them using its own formula based on the previous trading session The indicator can display the following levels in addition to plain pivot points: Previous session's High and Low, today's Open. Sweet spots. Fibonacci levels. Camarilla pivots. Midpoint pivots.

Support And Resistance indicator that can display round levels and zones . It shows them directly on the chart, providing an easy help when you want to set stop-loss or take-profit level, or when you want to see the next market target. If an asset price is moving down and bounces back up, the level is called support (think: price floor). If an asset price is moving upward and hits a level where it reverses downward, this is called resistance (think: price ceiling).

Enhance your trading strategy and optimize your market entries with the Power MA Rectifier Indicator, now available for sale on the MetaTrader 5 (MT5) Market platform. This innovative indicator combines the power of Moving Averages (MA) with a rectification algorithm, providing traders with valuable insights to make informed trading decisions. Key Features: Moving Averages Integration : The Power MA Rectifier Indicator leverages Moving Averages to analyze market trends, helping traders identify

An indicator based on candlestick patterns
To catch short-term and long-term trends
If it gives a signal in the direction of the trend, it is long term
And if it gives a signal in the opposite direction of the trend, it is short term
Too many signals
Can be used in all symbols
Can be used in all time frames
Attributes: Too many signals Can be used in all symbols Can be used in all time frames Simple settings Simple and fast usage With author lifetime support
Settings: Candle back: The number
//--- input parameters input int InpFastEMA = 12; // Fast EMA period input int InpSlowEMA = 26; // Slow EMA period input int InpSignalSMA = 9; // Signal SMA period input ENUM_APPLIED_PRICE InpAppliedPrice = PRICE_CLOSE; // Applied price
A combination version that combines traditional MACD and MQL platforms to efficiently analyze market trends, making it more effective, concise, and intuitive. Thank you for your pur

//--- input parameters input ENUM_TIMEFRAMES InpPeriod = PERIOD_D1; // Period input int InpBandsShift = 15; // Shift
An indicator that displays the closing line of any other periodic candle chart in the icon, which can efficiently analyze market trends, is more effective, concise, and intuitive. Thank you for your purchase and use. If you have any better suggestions, please leave a message in the comments section. I will reply as soon as possible. Congratulations on making e
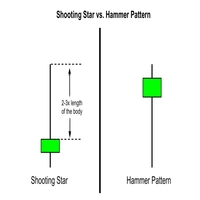
The Candlestick Reversal Alert for MT5 is your ultimate tool for identifying potential trend reversals in the financial markets. This powerful indicator is designed exclusively for MetaTrader 5 (MT5) and is packed with features to help you stay ahead of market movements. Key Features: Customizable Reversal Criteria: Tailor the indicator to your trading style by adjusting parameters such as lower wick size, top wick size, and top wick percentage. Historical Analysis: Specify how many historical c

Introducing Moon Spiker – Your Lunar Gateway to Precision Trading on MetaTrader 5! Elevate your trading experience to astronomical heights with Moon Spiker, a cutting-edge indicator designed to harness the celestial powers for precise analysis and decision-making. Say hello to an innovative tool that will send your trading strategy rocketing to the next level! Designed exclusively for MetaTrader 5, Moon Spiker is meticulously crafted to cater to the discerning trader focused on the 1-hour
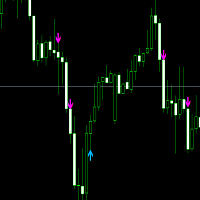
This offer is limited to a temporary period. Entry signal :follow the blue arrow for a buy trade and the Pink for a sell. Buy Trade: When the blue arrow appears, you wait until the candle completely finishes. Then you enter into a Buy Trade as soon as the next candle appears. Now wait until you hit TP1 from the Buy Goals box, then close the trade with a profit. Sell Trade: When the Pink arrow appears, you wait until the candle completely finishes Then you enter into a Buy Trade as soon as the n

Inverted Price Action est un outil financier qui reflète graphiquement les mouvements des prix comme s'ils étaient inversés, ce qui peut aider les traders et les investisseurs à avoir une perspective différente sur les tendances et les mouvements du marché.
Lorsque la souris est positionnée sur l'indicateur, il réagit en modifiant sa couleur pour correspondre à celle du graphique principal, tandis que le graphique sous-jacent est assombri. Cette fonctionnalité peut aider les utilisateurs à se
The MetaTrader Market offers a convenient and secure venue to buy applications for the MetaTrader platform. Download free demo versions of Expert Advisors and indicators right from your terminal for testing in the Strategy Tester.
Test applications in different modes to monitor the performance and make a payment for the product you want using the MQL5.community Payment System.
You are missing trading opportunities:
- Free trading apps
- Over 8,000 signals for copying
- Economic news for exploring financial markets
Registration
Log in
If you do not have an account, please register
Allow the use of cookies to log in to the MQL5.com website.
Please enable the necessary setting in your browser, otherwise you will not be able to log in.