Watch the Market tutorial videos on YouTube
How to buy а trading robot or an indicator
Run your EA on
virtual hosting
virtual hosting
Test аn indicator/trading robot before buying
Want to earn in the Market?
How to present a product for a sell-through
Technical Indicators for MetaTrader 5 - 18

This is a custom indicator based on candlestick price action. It generates alerts for buy or sell signals on any trading instrument. There are explanatory materials available for signal validation, entry, and exit techniques. To learn more, search for Benjc Trade Advisor on YouTube for explanatory videos. The latest version includes trend and oscillator filters to enhance signal accuracy. Future updates will likely come with price increases. When a signal is generated, the system prompts immedi
FREE

This indicator calculates fibonacci levels via moving averages trend and draw these lines. You can change fast and slow Moving Averages settings for customization. Inputs:
Fast MA Time Period : 64 Fast MA Shift: 0 Fast MA Method: Smoothed Fast MA Apply To: Median Price Slow MA Time Period: 32 Slow MA Shift: 0 Slow MA Method: Smoothed Slow MA Apply To: Median Price ZigZag: False ZigZag Color: Red ZigZag Type: DashDot ZigZag Width: VeryThin Fibo Settings TrendFibonacci: True FiboTrendColor: Black
FREE
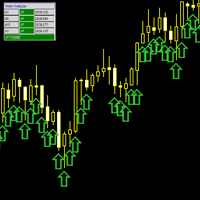
The MultiFrameTrendAnalyzer is a versatile MetaTrader 5 (MT5) indicator designed to provide multi-timeframe trend analysis using Moving Average (MA) crossovers. This indicator synchronizes trend signals across multiple timeframes (M1, M5, M15, M30, H1, H4, D1, W1, MN1) and displays them with intuitive visual cues, including a colored trend line, signal arrows, and a customizable dashboard. Features Multi-Timeframe Analysis : Evaluates trends across up to nine timeframes, allowing traders to conf
FREE
Volatility Monitor – Real-Time Spike Detection Indicator Overview The Volatility Monitor is a lightweight and professional MT5 indicator designed to track sudden price movements and alert traders in real time. Whether you trade Forex, Gold, JPY pairs, or Crypto, this tool provides clear signals of market volatility using a combination of ATR-based auto detection or manual pip thresholds . By marking candles directly on the chart and sending progressive alerts, the indicator helps traders react q
FREE
The Moving Average Ribbon is a technical indicator that overlays a series of moving averages (MAs) on a price chart to visualize trend direction, strength, and potential reversals or reentries. It supports both Exponential Moving Averages (EMA) and Simple Moving Averages (SMA), configurable via user input.
Key Features:
Ribbon Composition: Displays 18 moving averages with periods ranging from 5 to 90 in increments of 5 (e.g., MA5, MA10, ..., MA90), plus an internal MA100 for reference. The MA5
FREE

Description
Spread History is a simple yet essential indicator that displays the historical spread, candle by candle, in a separate window alongside its moving average. With a real‑time line and overlaid text on the main chart, you can easily monitor the spread applied by your broker at every market phase. Purpose Show the actual spread provided by the broker for each candle Calculate and display the spread’s moving average over a configurable period Overlay the current spread value and its av
FREE

The indicator displays important technical levels on the chart. These levels act as support or resistance for the price movement.
The most important levels are multiples of 100 and 50 pips . You can also display levels in multiples of 25 pips .
When the price reaches the level, an alert or push notification is displayed. MT4 version https://www.mql5.com/en/market/product/69486 Settings Show Levels 100 pips - show levels that are multiples of 100 pips Show Levels 50 pips - show levels t
FREE
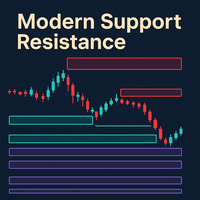
Dynamic S/R indicator that creates zones from fast/slow fractals, merges them if they overlap, classifies them (Possible, Untested, Verified, Turncoat, Weak), highlights the one closest to current price, and sends alerts when price enters the area. It supports testing mode, visual themes, zone extension/merge, global variables for EA integration, optional display of broken zones, and an adaptive ATR-based fuzz filter (with automatic fallback).
My indicators for free. I only ask that leave your
FREE

A pin bar pattern consists of one price bar, typically a candlestick price bar, which represents a sharp reversal and rejection of price. The pin bar reversal as it is sometimes called, is defined by a long tail, the tail is also referred to as a “shadow” or “wick”. The area between the open and close of the pin bar is called its “real body”, and pin bars generally have small real bodies in comparison to their long tails.
The tail of the pin bar shows the area of price that was rejected, and t
FREE

Overview EMA Scalper is a technical indicator designed for the MetaTrader 5 platform. This tool helps traders identify potential trading signals based on the crossover between price and an Exponential Moving Average (EMA), combined with a dynamic price channel. The indicator is suitable for scalpers or day traders and works across various timeframes and financial instruments. How It Works The indicator's logic is based on two main components: EMA Crossover: The core signal is generated when the
FREE

A clean Bollinger Bands indicator with single-color filling designed to reduce chart clutter. What is This Indicator? This is a Bollinger Bands technical indicator designed with visual simplicity in mind. Unlike standard Bollinger Bands implementations that display multiple colored lines and bands, this indicator uses a single-color filled area to represent the trading bands. This approach minimizes visual clutter while maintaining full functionality for technical analysis. How It Works The ind
FREE

Shadow Bands Pro – MT5 说明(中英文) English Description (MT5) Shadow Bands Pro – Advanced Reversion System for MT5 This MT5 edition of Shadow Bands Pro takes full advantage of the MT5 platform, offering faster calculations, more timeframes, and better testing capabilities.
It remains a non-repainting (on close) trend-reversal / mean-reversion tool with dynamic channels, entity-break logic, and an integrated statistics panel. Key Features Optimized for MT5’s 64-bit, multi-threaded architecture Non-
FREE

The fact that round number levels have a significant influence on the market cannot be denied and should not be overlooked. These psychological levels are used by both retail Forex traders and major banks that deal in Forex. Very simple and effective indicator and most importantly free. ////////////////////////////////////////////////////////////////////////////////////////////////////////////////////////////////////////////////////////////// The program does not work in the strategy tester.
FREE

RSI with moving average is great to see when the price is overbought and oversold instead of RSI only.
INPU T PARAME TERS : RSI:
Period - RSI period.
Price - RSI applied price.
Color scheme - RSI color scheme (4 available). MOVING AVERAGE:
Period - MA period.
Type - MA type.
Apply - MA applica tion.
Shift - MA shif t (correc tion). PRICE LINE:
Show - specify if line with price, only line or nothing.
Style - line style. OTHER:
Overbought level - specify the level .
Overbought descriptio
FREE

Drawing inspiration from ICT's Private Mentorship Course of 2016 (month 05) , as shared on YouTube, our innovative tool empowers traders to navigate the markets with precision. By marking out periods of 60, 40, and 20 days, it helps identify significant market movements, drawing upon the wisdom imparted by ICT. What truly sets this indicator apart is its forward casting capability, a feature that offers invaluable insights into future market behavior based on meticulous historical data analysis
FREE

The "YK-LOT-SIZE" is a custom indicator for MetaTrader 5 (MT5) that displays the total lot sizes and profits for both buy and sell positions on the current chart. Key features of the indicator: It calculates the total lot sizes for all open buy and sell positions of the current symbol. It calculates the total profits (including commissions and swaps) for all open buy and sell positions. The indicator displays the information on the chart using two lines of text: "BUY Lots: [total buy lots] | BUY
FREE

Daily Weekly Monthly High Low - Your Ultimate Tool for Precision Market Analysis
The 200 free download promotion has ended. The price has now been updated. Thank you, everyone!
Love it? Hate it? Let me know in a review! Feature requests and ideas for new tools are highly appreciated. :)
Try "The AUDCAD Trader":
https://www.mql5.com/en/market/product/151841 Overview:
Elevate your trading strategy with Daily Weekly Monthly High Low , a sophisticated MQL5 indicator designed to pinpoint c

SETTINGS Make sure to select Chart shift option in the chart.
(Right click in the chart ---> Properties (dialog box) ----> Select Chart Shift)
Kindly rate and comment about the product for upgradation & Support
When using candlestick timers, keep in mind that the timing of candlestick patterns can play a crucial role in your trading strategy. For instance, different timeframes (such as 1-minute, 5-minute, hourly, ) can provide varying insights into price movements and trends. Make sure to i
FREE

Highly configurable Moving average indicator.
Features: Highly customizable alert functions (at levels, crosses, direction changes via email, push, sound, popup) Multi timeframe ability Color customization (at levels, crosses, direction changes) Linear interpolation option Works on strategy tester in multi timeframe mode (at weekend without ticks also) Parameters:
MA Timeframe: You can set the lower/higher timeframes for Ma. MA Bar Shift: Y ou can set the offset of the line drawing. MA Period,
FREE

BEHOLD!!!
One of the best Breakout Indicator of all time is here. Multi Breakout Pattern looks at the preceding candles and timeframes to help you recognize the breakouts in real time.
The In-built function of supply and demand can help you evaluate your take profits and Stop losses
SEE THE SCREENSHOTS TO WITNESS SOME OF THE BEST BREAKOUTS
INPUTS
MaxBarsback: The max bars to look back
Slow length 1: Period lookback
Slow length 2: Period lookback
Slow length 3: Period lookback
Slow leng
FREE
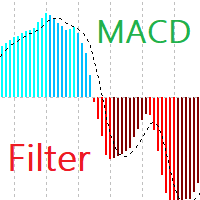
MACD Filter Introducing MACD Filter – a fresh take on the beloved MACD (Moving Average Convergence Divergence) indicator, developed specifically for the MetaTrader 5 platform. By applying the Fisher Transform for filtering and refining data, MACD Filter creates smoother lines, eliminating noise and providing clearer signals. Fisher Transform Filtering: Normalizes and smooths MACD data. This leads to smooth, less chaotic lines compared to traditional MACD, reducing false signals and simplifying
FREE

TransitX1 indicator is very useful, with unlimited signals and works on all the timeframes and all the piers. TransitX1 draws two trend lines very short trendlines (+/-20 bars) which can be considered as support and resistance. The support is in red trendline and the resistance is in green trendline. TransitX1 gives buying and selling signals, with only 3 being previous signals and the 4th one being the current signal. Buying signals are in green arrows and are always on the support trendline an
FREE

Introduction
The PF Maximizer is a game-changing non-repainting technical tool engineered to help traders distinguish genuine trend signals from erratic market fluctuations. By employing sophisticated algorithms and cutting-edge data analysis, this indicator efficiently filters out unwanted noise, empowering traders to identify the precise starting and ending points of substantial market moves.
Signal
Potential buy signal is generated when moving average is going up and the blue line cross a
FREE

Overview Magic 7 Indicator is a comprehensive MetaTrader 5 (MQL5) indicator that identifies seven different trading scenarios based on candlestick patterns and technical analysis. The indicator combines traditional price action patterns with modern concepts like Fair Value Gaps (FVG) to provide trading signals with precise entry points and stop loss levels. Features 7 Trading Scenarios : Each scenario identifies specific market conditions and trading opportunities Visual Signals : Clear buy/sell
FREE
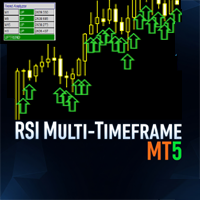
The MultiFrameRSIIndicator is a powerful MetaTrader 5 (MT5) indicator that leverages the Relative Strength Index (RSI) to analyze trends across multiple timeframes. This indicator synchronizes RSI-based trend signals from up to nine timeframes (M1, M5, M15, M30, H1, H4, D1, W1, MN1) and presents them with clear visual feedback, including a colored RSI line, signal arrows, and a customizable dashboard. Ideal for traders seeking momentum-based trend confirmation. Features Multi-Timeframe Analysis
FREE

This indicator is designed to help traders to help them Synchronize objects across all charts that have the same pair/currency.
Applicable objects: -Rectangle
-Trendlines
-Trendlines by Angle
-Horizontal Lines
-Vertical Lines
-Arrow Lines
-Channels
- Text boxes
Known Issues : - Visualization is not copied to the other charts. - If indicator is only placed in one chart, other charts with the same pair/currency will have difficulty deleting the objects if there is no "Sync Objects In Charts" in
FREE

AI Forecasts MT5 Indicator: Future Prediction System with Artificial Intelligence and Deep Learning (AI + ML) _ Main Features: - Future vision up to 20 candles ahead based on dynamic data analysis - Suitable for scalping trading
-Multi-colored prediction charts reflecting confidence levels in forecasts with white pip counter next to current Buy/Sell status -Probability zones showing expected price paths with margin of probability changes and direction -Multi-variable analysis primarily based

https://www.mql5.com/en/users/gedeegi/seller GEN (Trend Line) automatically detects swing highs and lows, plots dynamic upper & lower trendlines with adaptive slope (ATR, Standard Deviation, or Linear Regression approximation), and marks breakout points visually when the price crosses the trend boundaries. Perfect for price action, breakout, and trend confirmation strategies across multiple timeframes.
FREE
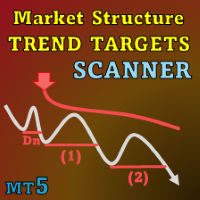
Special offer : ALL TOOLS , just $35 each! New tools will be $30 for the first week or the first 3 purchases ! Trading Tools Channel on MQL5 : Join my MQL5 channel to update the latest news from me I. Introduction
Market Structure Trend Targets Scanner is a powerful tool for analyzing market trends, identifying breakout points, and managing risk via a dynamic stop loss. By tracking previous highs and lows to pinpoint breakouts, this tool helps traders quickly recognize market tren
[ MT4 Version ] Are you tired of spending months on demo or live accounts to test your trading strategies? The Backtesting Simulator is the ultimate tool designed to elevate your backtesting experience to new heights. Utilizing Metatrader historical symbol information, it offers an unparalleled simulation of real market conditions. Take control of your testing speed, test ideas quickly or at a slower pace, and witness remarkable improvements in your testing performance. Forget about wasting tim

Order Flow Lite: Synthetic Order Flow Analysis Tool Order Flow Lite is a technical analysis utility designed to visualize synthetic Order Flow, Footprint Charts, and Tick Analysis using standard broker data. It serves as the entry-level version of the professional analysis suite, providing essential functions for traders to analyze Delta logic and Volume Profiling based on recent price action. Included Features Footprint Bars: Displays "Sell x Buy" volume data for the last 3 closed candles. Tic
FREE

If you love this indicator, please leave a positive rating and comment, it will be a source of motivation to help me create more products <3 Key Takeaways Provides both trend and momentum signals in a single view. Entry and exit signals are based on the crossover of the RSI and Signal Line. Market Base Line offers insight into the overall trend direction. Volatility Bands help identify overbought and oversold market conditions.
FREE

Level Breakout Indicator is a technical analysis product that works from upper and lower boundaries, which can determine the direction of the trend. Works on candle 0 without redrawing or delays.
In its work, it uses a system of different indicators, the parameters of which have already been configured and combined into a single parameter - “ Scale ”, which performs gradation of periods.
The indicator is easy to use, does not require any calculations, using a single parameter you need to select
Pip Value Calculator - Instant Risk Assessment on Your Chart This powerful and lightweight utility instantly calculates the precise monetary value for any pip movement, displaying it directly on your chart so you can assess risk and potential profit at a glance. At its core, the indicator's sophisticated calculation engine runs silently with every price tick, ensuring the information you see is always up-to-date. It automatically detects the instrument you are trading—whether it's a Forex pair,
FREE

Koala Trend Line Upgraded To Version 1.2 Last Upgrade Improvement : New Parameter Added that allow user to connect trend line to 2nd or 3th or Xth highest or lowest point.
My Request :
**Dear Customers Please Release Your Review On Koala Trend Line, And Let Me Improve By Your Feed Backs.
Join Koala Trading Solution Channel in mql5 community to find out the latest news about all koala products, join link is below : https://www.mql5.com/en/channels/koalatradingsolution
WHAT ABOUT OTHER FREE
FREE
This is a powerful, session-aware breakout indicator designed for serious traders who thrive on volatility and structure. Engineered for precision, it identifies high-probability breakout zones during the London and New York trading sessions—where the market moves with intent. Key Features: Session Range Detection
Automatically detects and highlights the key price range of London and New York sessions. Breakout Confirmation
Identifies breakout candles after the session range, with clear bullis
FREE

KDJ Indicator for MT5 The KDJ Indicator for MT5 is a professional-grade momentum and trend analysis tool designed to help traders identify trend reversals , overbought/oversold conditions , and entry or exit opportunities with high accuracy. Originally developed as an enhancement of the Stochastic Oscillator , the KDJ adds a powerful J-line that reacts faster to price movement, giving traders earlier warnings of potential reversals. Key Features Three-Line System (K, D, J):
The K and D lines r
FREE

- Displays horizontal lines for Previous Day High (PDH) and Previous Day Low (PDL) on the chart. - Customizable line colors via input parameters. - Sends sound alerts, pop-up notifications, and mobile push notifications upon the initial crossover of PDH or PDL. - Alerts are triggered only once per crossover event; they re-trigger only if the price moves away and re-crosses after a specified minimum interval. - Automatically updates the PDH/PDL levels at the start of each new day. - All indicator
FREE

Volume Weighted Average Price (VWAP) is a trading benchmark commonly used by Big Players that gives the average price a Symbol has traded throughout the day. It is based on both Volume and price. Additionally we put in this indicator the MVWAP (Moving Volume Weighted Average Price). For those who do not know the usage and the importance od this indicator I recommend a great article about this subject at Investopedia ( https://www.investopedia.com/articles/trading/11/trading-with-vwap-mvwap.asp )
FREE

SuperTrend Alert with Email Notification – Your Smart Market Sentinel! Overview: SuperTrend Alert with Email Notification is a lightweight and powerful tool that helps traders stay ahead of trend changes in real-time . Built on the widely trusted SuperTrend indicator , this tool monitors price action and instantly notifies you via email when a new BUY or SELL signal is triggered – no more missed opportunities! ️ Key Features: SuperTrend-Based Signals Uses SuperTrend algorithm (ATR-base

Draw and Sync Objects Multiple Charts 1. Draw objects by key press. ( You must: 1. Press Function key => 2. Click where you want to draw => 3. Draw it => 4. Press ESC to complete). (If you don't want to draw after pressing function key, you must press ESC to cancel). 2. Developing : Sync selected objects to multiple charts by button. 3. Developing: Hide objects that do not belong to the current symbol (Objects drawn with this indicator will belong to the symbol they are plotted on. When your c
FREE

This indicator displays buy or sell signals according to Bill Williams' definition of the Trading Zone. [ Installation Guide | Update Guide | Troubleshooting | FAQ | All Products ] Easy to use and understand Avoid trading flat markets Deterministic indicator with clear rules The indicator is non-repainting It implements alerts of all kinds It has straightforward trading implications. A blue arrow is a buy signal A red arrow is a sell signal According to Bill Williams trading in the zone helps t
FREE
Accurate Buy Sell System is a clean and reliable swing-based indicator designed to identify trend reversals and entry zones with high precision. The algorithm follows the original “Accurate Swing Trading System” concept from TradingView (by ceyhun) and has been fully re-engineered for MetaTrader 5. 1:1 match with TradingView behavior
Works on all symbols and timeframes
Clean non-repainting signals when used after candle close
Visual BUY/SELL arrows + colored dynamic trendline
Popup al
FREE

If you love this indicator, please leave a positive rating and comment, it will be a source of motivation to help me create more products <3 What is Schaff Trend Cycle indicator? The Schaff Trend Cycle (STC) is a technical analysis indicator used in trading and investing to identify trends and generate trading signals. The STC is designed to identify trends and trend reversals by measuring the strength of the trend and the speed of price changes. The STC indicator helps to identify trends in a
FREE

The Price Action Finder indicator is an indicator of entry points, which is designed to search and display patterns of the Price Action system on a price chart. The indicator is equipped with a system of trend filters, as well as a system of alerts and push notifications. Manual (Be sure to read before purchasing) | Version for MT4 Advantages
1. Patterns: Pin bar, Outside bar, Inside bar, PPR, Power bar, Hanging man, Inverted hammer 2. Pattern filtering system. Removes countertrend patterns from

MA Color Candles Indicator MA Color Candles is an indicator for visually displaying market trends by coloring chart candles. It does not add objects or distort price data, instead coloring real candles based on the state of two moving averages. This enables quick trend assessment and use as a filter in trading strategies. How It Works Bullish trend: Fast MA above slow MA, slow MA rising (green candles). Bearish trend: Fast MA below slow MA, slow MA falling (red candles). Neutral state: Candles
FREE

The XR Gartley Pattern MT5 is an indicator which displays and alerts Gartley pattern detected on the candlestick chart. It also displays potential trade with calculated Take Profit and Stop Loss. After purchasing XR Gartley Pattern Indicator, you can immediately download this indicator from the MT4-MT5 Market and start using it because all features are set to default, is not necessary to change any parameter. In addition, we have created a private group for customers who have purchased one of
FREE

Supply and demand in trading describes how buyer (demand) and seller (supply) actions set asset prices, with high demand/low supply raising prices (premium) and low demand/high supply lowering them (discount); traders identify these imbalances as "zones" on charts (e.g., Rally-Base-Rally for demand, Drop-Base-Drop for supply) to find potential entry/exit points, aiming to buy at discount demand zones and sell at premium supply zones, using volume and price action to confirm institutional acti
FREE

MomoPoints is an indicator that shows long and short entry/add points on the chart.
Based on momentum and trend strength, MomoPoints show entries/adds with a good risk to reward ratio.
Settings
----------------------------------
Design: Colors, size and wingdings (graphic symbol) of the signal can be adjusted.
Signal Settings: Moving average period, trend strength, distance from moving average to price and RSI period can be set.
Signal values can be displayed as a comment to set the correct
FREE

Dark Sprint is an Indicator for intraday trading. This Indicator is based on Trend Following strategy, also adopting the use of the atr to determine the right volatility. We can enter in good price with this Indicator, in order to follow the strong impulse on the current instrument.
Key benefits
Easily visible sprint lines Intuitive directional arrows Automated adjustment for each timeframe and instrument Easy to use even for beginners Never repaints, never backpaints, Not Lag 100% compatibl

No Demand No Supply This indicator identifies No Demand –No Supply candles to your chart and plots volume bars colored according to the signal. It can be applied to all timeframes or to a specific one only. It can also be used as regular volume indicator with exceptional future of WEIGHTED VOLUME. Furthermore is has an alert notification, sound and email when a signals occurs. The indicator does not repaint but the alert will come on two candles back due to the definition of No Demand No Su
VWAP Machine Learning Bands: The Predictive Edge for Traders Unlock the next level of market analysis with VWAP Machine Learning Bands – an innovative MQL5 indicator engineered to provide unparalleled insights into market trends, dynamic support/resistance, and high-probability trade signals. Leveraging a proprietary adaptive machine learning algorithm integrated with the power of Volume Weighted Average Price (VWAP), this indicator transcends traditional analysis. It's designed to give you a ge

GomerAI REGIME Indicator is a market condition classification indicator for MetaTrader 5 designed to help traders understand what type of market environment they are operating in . Rather than generating trade signals or executing trades, REGIME analyzes price behavior across three dimensions—trend strength, volatility, and range behavior—to classify the current market into one of three clearly defined regimes: QUIET – Low volatility, range-bound conditions
TRENDING – Directional movement with
FREE

Ichimoku Kinko Hyo is a purpose-built trend trading charting system that has been successfully used in nearly every tradable market. It is unique in many ways, but its primary strength is its use of multiple data points to give the trader a deeper, more comprehensive view into price action. This deeper view, and the fact that Ichimoku is a very visual system, enables the trader to quickly discern and filter "at a glance" the low-probability trading setups from those of higher probability. This i
FREE

The outside bar indicator shows a range of inside bars and the breakout up and down from the range. The breakout is always displayed at the start of a new range and is extended until another breakout. The calculation always takes place at the start of a new candle. So it is displayed accordingly in all time frames. In inside bar ( insidebar ) trading you can see the top and bottom of a range.
In outside bar ( outsidebar ) trading, the breakout from a range and thus the trend following.
The col
FREE

Modern Spike Indicator Features:
1. Support and Resistance Lines: Displays dynamic horizontal dashed lines on the chart representing current support and resistance levels calculated from recent price swings.
2. Spike Detection Arrows: Shows up arrows (green) for potential upward spikes and down arrows (red) for potential downward spikes, triggered when price breaks S/R levels with RSI confirmation.
3. Trend Analysis: Incorporates ADX (Average Directional Index) to determine market trend stre

Precision Arrows – Smart Entry Signals with Built-In TP and SL Precision Arrows is a powerful trading indicator designed for traders who demand accuracy, clarity, and reliability. It identifies high-probability buy and sell signals with automatically generated Take Profit and Stop Loss levels, helping you trade with discipline and consistency across Forex, Indices, Crypto, and Synthetic Indices . The indicator combines precise signal detection, intelligent filtering, and a multi-timeframe dashbo

Basic Theme Builder: Simplify Your Chart Customization Transform your trading experience with the Basic Theme Builder indicator, a versatile tool designed to streamline the customization of your chart's appearance on MetaTrader 5. This intuitive indicator offers a user-friendly panel that enables you to effortlessly switch between various themes and color schemes, enhancing both the visual appeal and functionality of your trading environment. Free MT4 version The Basic Theme Builder indicator i
FREE

Indicator Introduction: The indicator comes from network ,It is more stable relative to RSI or CCI. You can set the indicator to send emails/notifications/alerts when the previous bar has an up or down arrow, you can specify the text of emails by inputing string into the parameter box of "UpMessages/DownMessages". It can be used to analyze market trend and design new expert that is based on trend. If the indicator below the axis ,this is a buy zone. The trend indicator is suitable for M1 and ab
FREE
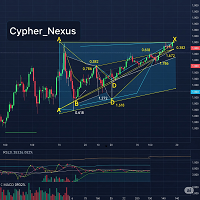
Cypher Pattern Detector A tool for automatic detection of Cypher harmonic patterns (XABCD) in financial charts. Overview The Cypher Pattern Detector identifies both bullish and bearish Cypher harmonic patterns in real time. It applies Fibonacci ratio validation and a quality scoring system to highlight patterns that closely match the defined structure. This helps traders observe and analyze potential market structures more consistently, without the need for manual drawing. Main Features Pattern
FREE

This indicator is the mql version of the Smoothed Heiken Ashi Candles. Find out more here: https://www.mql5.com/en/users/rashedsamir/seller Heikin-Ashi charts resemble candlestick charts , but have a smoother appearance as they track a range of price movements, rather than tracking every price movement as with candlesticks.
Because the Heikin Ashi candlesticks are calculated based on averages, the candlesticks will have smaller shadows than a regular Japanese candlestick. Just like with
FREE

VR Ticks is a special indicator for scalping-based strategies. Thanks to this indicator, the trader can see the tick chart directly on the main chart of the financial instrument. A tick chart allows you to enter a position into the market or close a position in the market as accurately as possible. VR Ticks plots tick data in the form of lines that change color depending on the direction - this allows you to visually understand and assess the situation on ticks. The advantage of tick charts i
FREE
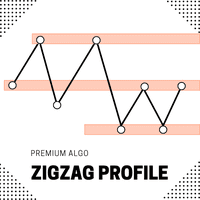
Introducing the ZigZag Profile — a powerful tool designed to identify high-probability pivot zones where price action frequently reverses. This indicator analyzes historical price data to pinpoint key areas where price has pivoted multiple times, providing traders with actionable insights into potential support and resistance levels. The ZigZal Profile indicator continuously scans for zones where price has reversed direction the most, highlighting these critical areas on your chart. By focusing
FREE
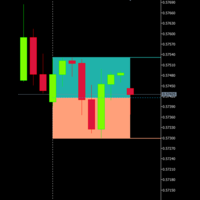
If you like this product, please give it a 5 star rating as a token of appreciation.
This indicator draws the premium and discount zones of a single candle from any timeframe on your chart.
You choose which candle (current or previous) using CandleOffset, and the indicator automatically retrieves that candle’s high, low, and midpoint.
It then visually displays:
Premium Zone (Upper 50%)
A shaded rectangle from the candle’s midpoint to high.
Discount Zone (Lower 50%)
A shaded rectangle from th
FREE

HiperCube Market Profile ! Discount code for 20% off at Darwinex Zero: DWZ2328770MGM_20 A Market Profile is a graphical representation that combines price and time information in the form of a distribution . It displays price information on the vertical scale (y-axis) and volume information on the horizontal scale (x-axis). This chart type provides insights into market activity, allowing traders to visualize and evaluate fair market value in real-time.
Features: Custom Colors Custom Chart Cl
FREE
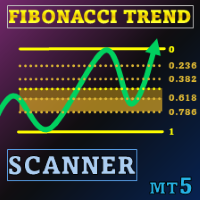
Special offer : ALL TOOLS , just $35 each! New tools will be $30 for the first week or the first 3 purchases ! Trading Tools Channel on MQL5 : Join my MQL5 channel to update the latest news from me In a volatile trading environment, a powerful and intuitive analysis tool can help you seize opportunities quickly. Fibonacci Trend Scanner not only integrates traditional Fibonacci indicator features, SuperTrend but also expands functionality with currency pair scanning, multi-timeframe

Introducing the powerful NRTR (Nick Rypock Trailing Reverse) indicator - an essential technical tool for traders seeking to identify trend reversals and establish effective trailing stops. Developed by Nick Rypock, this indicator boasts a unique algorithm that adapts to ever-changing market conditions, making it a valuable addition to any trader's arsenal. Here are two popular ways in which traders use this indicator: 1. Trend Reversals: The NRTR indicator generates clear signals when a trend is
FREE

Shadow System Candles - AI Trend Visualization
Concept "Stop trading in the dark. Equip your chart with Night Vision."
Shadow System Candles is the visual core of the "Shadow Operation" project. It eliminates market noise and visualizes the true direction of the trend using AI-based logic (ADX + MA integration).
Note: This tool does not generate buy/sell arrows. It is designed to train your eyes to recognize "Active Trends" and "Dangerous Ranges.
Key Features ・AI Logic Coloring[/b]: Automat
FREE

Opening Range Indicator
Idea Toby Crabel introduced this way of trading in the ealy ninties in his book "Day Trading with Short Term Price Patterns and Opening Range Breakout". In simple terms this means to trade the brekouts from the limits of the first trading hour with the stop loss at the opposite side. I.e. if the first hourly candle meausres 40 points (Crabel calls this the "stretch") you set the stop loss at breakout level minus 40 points and the take profit at the breakout level plus 4
FREE

Original supertrend indicator in Tradingview platform. Indicator type: Price Action indicator Introduction: The Supertrend Indicator - Enhancing Your Trend Analysis. If you haven't yet found a Supertrend indicator with good graphics on the MQL5 platform, this is the indicator for you. Overview: The Supertrend Indicator is a powerful tool designed to provide traders with valuable insights into the current and historical trends of financial markets. It serves as a valuable addition to any t
FREE
The MetaTrader Market is the best place to sell trading robots and technical indicators.
You only need to develop an application for the MetaTrader platform with an attractive design and a good description. We will explain you how to publish your product on the Market to offer it to millions of MetaTrader users.
You are missing trading opportunities:
- Free trading apps
- Over 8,000 signals for copying
- Economic news for exploring financial markets
Registration
Log in
If you do not have an account, please register
Allow the use of cookies to log in to the MQL5.com website.
Please enable the necessary setting in your browser, otherwise you will not be able to log in.