Watch the Market tutorial videos on YouTube
How to buy а trading robot or an indicator
Run your EA on
virtual hosting
virtual hosting
Test аn indicator/trading robot before buying
Want to earn in the Market?
How to present a product for a sell-through
Technical Indicators for MetaTrader 5 - 105

Sonic R Indicator Description Overview The Sonic R Indicator for MT5 is designed to help traders analyze market trends using moving averages and volume analysis. This tool assists in identifying potential price movements by displaying trend zones and volume strength, making it suitable for various trading strategies. Key Features Dual EMA Trend Channels – Uses 34-period Exponential Moving Averages (EMA) to visualize price movement. Volume Analysis – A color-coded histogram to indicate changes i

If you are looking for precision in identifying strategic tops and bottoms, the ZigZag SMC/SMT Indicator for MT5 is the tool that will contribute to your technical analysis. Developed based on the advanced concepts of Smart Money Concepts (SMC) and Smart Money Trap (SMT), it offers an insight into market behavior, helping you make decisions.
What will you find in this indicator? Automatic identification of strategic tops and bottoms Based on institutional strategies Ideal for analyzing liqu
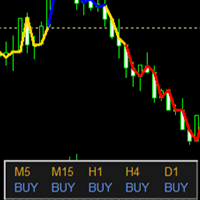
The trend indicator has the ability to adjust the viewing depth and sensitivity, does not repaint and does not lag. In addition to the current trend, the chart displays trends for 5 more periods with zero trend levels for them. This allows for a comprehensive assessment of the nature of the trend movement. There is a possibility to choose the trend algorithm settings {Only Open, Average Open/Close, Average High/Low} The trend indicator can be used for any Forex financial instruments. The color s

TrendFriendIndi
Features & Benefits:
Timeframes: All - The higher the more precise! Clear buy & sell signals → Green arrows for BUY, Red arrows for SELL
Confirmation candle to reduce false signals → Signals appear only after a strong confirmation
Built-in news filter → Blocks signals during high-volatility events to minimize risks
Stop-Loss & Take-Profit levels displayed on the chart → Helps you plan your trades with ease
Three Take-Profit targets (TP1, TP2, TP3) → Perfect for different tra
Unlock Institutional Trading Insights with Our Advanced Supply & Demand Zone Indicator Harness the power of institutional trading strategies with our cutting-edge Supply & Demand Zone Indicator —a game-changing tool designed to pinpoint high-probability entry and exit points in any financial market. By identifying where institutional buyers and sellers are positioned, this indicator gives you the edge to trade alongside the pros and capitalize on major market reversals. Why This Indicator Is
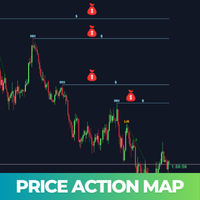
Price Action Map is an advanced trading indicator meticulously designed to provide clear visual insights into market structure by precisely labeling Higher Highs (HH) , Higher Lows (HL) , Lower Highs (LH) , and Lower Lows (LL) . Traders who find it challenging to accurately identify higher highs, lower lows, or understand different market phases will find this tool exceptionally valuable. Price Action Map significantly simplifies the analysis process, enabling traders at all skill levels to conf

Currency Strength Indicator - Track Market Power
Overview: Gain a competitive edge with the Currency Strength Indicator for MetaTrader 5. This intuitive tool measures the relative strength of 8 major currencies and displays them in a clear, sortable table directly on your chart. Perfect for forex traders looking to identify strong and weak currencies at a glance. Key Features: Dynamic Strength Table: Displays real-time strength for EUR, USD, GBP, JPY, CHF, AUD, CAD, and NZD in the upper-left c
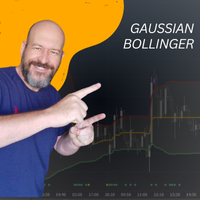
Gaussian Bollinger Bands with Gaussian Moving Average ️ Transform your trading strategy with an innovative indicator that blends the power of Advanced Mathematics with the practical efficiency of technical analysis! ️ Whether you're a beginner or an experienced trader, the Gaussian Bollinger Bands is the perfect solution for those looking to take their market analysis to the next level . This unique indicator replaces the traditional moving average with the Gaussian Moving Average (GMA

This is an indicator to determine when to sell or buy, and it can be combined with other indicators, such as the SND indicator that I also sell. This indicator is very suitable for BTC, XAU, and NAS100. This is an indicator for MT5. It is highly battle-proven if studied properly. Please consult andriawanjaya@gmail.com before using it. This product is very suitable for XAU, BTC, and NAS100. This product is very limited It is only sold on Gogo Jungle and MQL5.

Smart Market Structure Simple is a powerful indicator that helps traders identify market structure based on the Smart Money Concept (SMC) . This indicator automatically detects Break of Structure (BOS), Change of Character (CHoCH), Fair Value Gaps (FVG), Order Blocks (OB), Liquidity Zones (LQZ), and key swing points Higher High (HH), Higher Low (HL), Lower High (LH), Lower Low (LL) . Main Objective: Assist traders in tracking institutional flow ( Smart Money ) and finding high-probability trade

In the world of trading, where every tick can be the beginning of a new story, it is crucial to have a reliable ally. TrendVarianceSpectrum is not just a manual system; it is your guide in the volatile markets. Built with years of experience and trained on over 25 years of data, it combines the elegance of mathematics with the power of modern technology. Key Advantages of TrendVarianceSpectrum : Minimal Drawdown: TrendVarianceSpectrum operates with significantly low drawdown, making it one of

Smart Detector — The Secrets of Smart Money and ICT in Your Hands!
Want to trade like the big players? Smart Detector unlocks the world of Smart Money and Inner Circle Trader (ICT) strategies . This MetaTrader 5 indicator instantly identifies key zones where market makers leave their traces: powerful order blocks and hidden Fair Value Gaps . Discover where liquidity is hiding and turn it to your advantage! Smart Money: Track the actions of banks and hedge funds through accumulation and breakout

A Trend Following Indicator that switches directions based on a Stop-and-Reverse Price (based on Wilders algorithm) and in parallel a Stop-Loss that contracts when the profit exceeds the risk capital ( ACC*ATR ) progressively up to user defined max % level ( AF_MAX ).
The basis of this indicator is the Volatility method described in Wilders book from 1975 "New Concepts in Technical Trading Systems". I have used this on Crypto and Stocks and Forex. The ACC (Acceleration Factor) is setup to run

TimeView Pro – Customizable Local Time Display for MetaTrader 5 Overview TimeView Pro is a fully customizable time display indicator for MetaTrader 5. It provides an on-chart local time reference that automatically adapts to the user's system time or country time. Unlike similar indicators, TimeView Pro offers advanced customization and unique features to enhance time tracking without cluttering the chart. Key Features Snap to Candle (Default: Enabled) – The time display aligns precisely with th

JAJ Binary Pro is a precision-driven binary options strategy created by Jamaine Walkin , a full-time trader and investor. Designed for adaptability in Forex and OTC markets , it focuses on high-probability trade setups and disciplined risk management. Optimised for Pocket Option & MT5 , it reflects Jamaine’s structured approach to trading Options, ensuring consistency and confidence in execution.
Always use Proper Risk Management when trading.
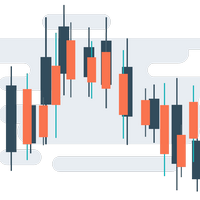
This indicator is designed primarily for manual trading. It analyzes recent price movements and processes them using its own algorithm. Based on this analysis, the indicator calculates the most important price levels. These levels divide price values into three zones: buy, sell, and neutral. New positions should only be opened if the price is in the corresponding zone. If the price is in the neutral zone, you should consider closing positions or moving them to breakeven. The indicator also pr

ATR Candles (Average True Range as OHLC candles) ATR Candles visualizes Average True Range (ATR) in a separate subwindow using candlestick-style OHLC bars . Each candle represents the change in ATR from the previous bar, making it easy to see volatility expansion and contraction over time. Key features: ATR shown as OHLC candles (open = previous ATR, close = current ATR) Input: ATR period Two color modes : Match price candle direction (bull/bear) Independent: green/red based on current ATR close

PipHistogram is an essential tool for traders who want to gain insight into price distribution and concentration. Its customizable, visually appealing histogram allows you to pinpoint key levels and make more informed trading decisions. Enhance your market analysis and improve your trading strategy with PipHistogram —your shortcut to understanding price dynamics in MetaTrader 5. Overview : PipHistogram is a powerful indicator for MetaTrader 5 that visually displays the percentage distribu

Introduction to the Manual Backtesting Indicator on MQL5 The MetaTrader platform provides an excellent backtesting tool for evaluating Expert Advisors (EAs). However, when it comes to manually backtesting a strategy to assess its effectiveness, this tool has some limitations: You cannot manually draw zones or trend lines while in backtesting mode. You cannot switch timeframes to check time alignment. For example, if my strategy requires additional confirmation from a higher timeframe (HTF), this
Product Name : SII - Synthetic Indices Indicator
Overview :
The SII (Synthetic Indices Indicator) is a specialized trading tool designed to identify high-probability levels in synthetic indices using imbalances. By leveraging the concept of imbalances, SII provides traders with precise insights into potential market reversals and continuations, enhancing trading accuracy and decision-making.
Key Features
1. Imbalance Detection: SII automatically identifies and marks imbalances on the chart,

Candle Reversal , is designed to identify and highlight key candlestick patterns that signal potential trend reversals or continuations in the market. It focuses on two primary types of patterns: 3-Line Strike Patterns (Bullish and Bearish) Engulfing Patterns (Bullish and Bearish) The indicator provides visual cues (arrows and text labels) on the chart to help traders quickly identify these patterns, making it easier to make informed trading decisions. use with MACD or awesome oscilator to

The Time_Price_SQ9_Degree indicator is based on the 9 Gann square. Using this indicator, you can identify strong time and price zones. The indicator displays the levels as a degree value. The degrees can be set in the settings. After launching, the MENU button appears. If it is highlighted, it can be moved to any point on the graph, and after double-clicking on it, it stops being highlighted and menu buttons appear. To hide the menu, just double-click on the button, it will become highlight

VANGARD Trade Info MT5 – Advanced Trading Information & Total Control! VANGARD Trade Info MT5 is an essential tool for traders who want to monitor their positions in real-time with full privacy control, customization, and smart margin alerts . This indicator provides detailed insights into your trades, margin, swaps, and costs, all in an optimized interface designed for faster and more efficient decision-making. Why Choose VANGARD Trade Info MT5? Real-time Detailed Information – Insta
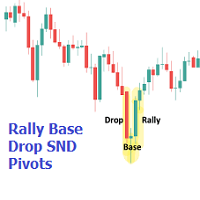
The Rally Base Drop SND Pivots indicator uses "Rally", "Base", and "Drop" Candles to determine pivot points at which supply and demand (SND) levels are drawn. (Figure 1) USAGE Figure 2 Rally, Base, and Drop (RBD) candles create a formula for seeing market structure through a fixed methodology. We are able to use this concept to point out pivot areas where Rallies and Drops directly meet.
The RBD SND Pivots are similar to traditionally identified "fractal" pivot points, with one key differ
Supertrend is a trend-following indicator based on Average True Range (ATR). The calculation of its single line combines trend detection and volatility. It can be used to detect changes in trend direction and to position stops. History The Supertrend indicator was created by Olivier Seban. Calculations To calculate bands of the Supertrend, use the following formulas: hl2 = (high + low) / 2 basicUpperBand = hl2 + (multiplier × ATR) basicLowerBand = hl2 - (multiplier × ATR) upperBand = basicUpper

PMax is a brand new indicator developed by KivancOzbilgic in earlier 2020. It's a combination of two trailing stop loss indicators; One is Anıl Özekşi's MOST (Moving Stop Loss) Indicator and the other one is well known ATR based SuperTrend. Both MOST and SuperTrend Indicators are very good at trend following systems but conversely their performance is not bright in sideways market conditions like most of the other indicators. PMax tries to solve this problem. PMax combines the powerful sides of
Dual Confirmation PMAX-Supertrend Indicator: The Ultimate Trading Edge The Dual Confirmation PMAX-Supertrend Indicator represents a significant advancement in technical analysis tools for serious traders. This premium indicator combines two powerful trend-following systems into a single, streamlined solution that generates signals only when both systems agree, dramatically reducing false signals and improving trading precision. Superior Signal Accuracy Through Dual Confirmation Trading success d

MATRIX Market Scanner
Comprehensive Analytics Without the Complexity Our innovative, cell-based dashboard gives you a panoramic view of the market—letting you monitor multiple instruments and timeframes seamlessly. Its high level of customization delivers an intuitive, dynamic display that adapts to your trading style, empowering you to see the bigger picture and make smarter, faster decisions. New Update The latest update to the Indicator Matrix Market Scanner introduces a powerful new feature

"Unlock deeper market insights with our advanced MQL5 Volume Indicator! This tool combines real-time volume data with an EMA25 overlay, highlighting key zones where volume surges at least 1.5 times above the EMA25—perfect for spotting high-impact trends. Customize colors and opacity effortlessly to suit your style. Plus, streamline your charts by disabling MT5’s default volume display: simply go to the chart settings, uncheck the built-in volume option, and let our indicator take the lead. Prec

A powerful trend-following tool that uses ATR-based volatility to identify market trends across multiple timeframes . This enhanced version allows you to overlay the SuperTrend of a higher timeframe directly on your current chart, helping you align your trades with the dominant trend. How It Works The indicator calculates dynamic support and resistance levels using Average True Range (ATR) : Upper Band = Source Price + (Multiplier × ATR) Lower Band = Source Price - (Multiplier × ATR) In an uptre

### Introducing the Price Action Ultimate Suite – The Ultimate Trading Tool for Professional Traders!
Are you searching for a powerful tool to elevate your Price Action trading strategy? Look no further than the **Price Action Ultimate Suite** – a comprehensive and intelligent indicator for MetaTrader 5 (MT5) – designed to be your trusted partner in conquering the financial markets! Packed with advanced features and user-friendly functionality, this indicator helps you identify key price patte
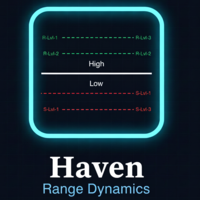
Haven Range Dynamics - Visualize Key Market Levels Introducing Haven Range Dynamics – an indicator that automatically plots key support and resistance levels on your chart. It defines the trading range over a specified period based on the High and Low, freeing up your time to make well-informed trading decisions. Other products -> HERE . The tool constructs 8 dynamic levels based on a proven mathematical model. These levels serve as powerful guides for identifying potential reversal, breakout,

TickFlow is a tool for tick-data analysis and visual highlighting of significant zones on the chart. The utility aggregates current and historical ticks, shows the buy/sell balance, and helps to identify support/resistance levels and cluster zones. This is the MetaTrader 4 version. How it works (brief) TickFlow collects tick data and aggregates it by price steps and candles. Based on the collected data the indicator builds visual layers: up/down tick counters, buy/sell ratio, historical levels

Reversal Algo – Technical Indicator for Market Reversal Analysis Overview
Reversal Algo is a sophisticated technical indicator meticulously engineered to help traders identify potential turning points in market trends. By thoroughly analyzing historical price data, it detects significant highs and lows that may signal an impending shift in market momentum. This indicator provides clear and distinct visual signals on your charts, allowing you to pinpoint key areas where trends might reverse. Des
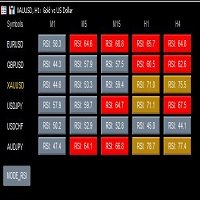
This is a powerful multi cycle, multi currency pair, and multi indicator monitoring tool for MT5 version, with main functions including: 1. Monitor real-time performance of multiple indicators, including RSI, MACD, MA, and STO. 2. Monitor multiple currency pairs, customizable to add or delete currency pairs, and automatically update indicators. 3. Monitor multiple currency pairs over multiple cycles. 4. After clicking, you can directly switch to the chart and cycle you want to view. 5. Click th

AdaptiveMomentumCCI Indicator
The AdaptiveMomentumCCI is a custom technical indicator for MetaTrader 5 that enhances the traditional Commodity Channel Index (CCI) by incorporating adaptive period adjustments, momentum analysis, and signal filtering. It calculates a smoothed CCI based on a user-defined price source (e.g., HLC/3, OHLC/4, or close), with its period dynamically adjusted using the Average True Range (ATR) to reflect market volatility. The indicator features a dual-line system with

Mini Índice Composition: A Revolução na Análise do Mini Índice! O Mini Índice Composition é um indicador inovador que monitora em tempo real as principais ações que compõem o mini índice, trazendo uma visão quantitativa poderosa sobre o fluxo de ordens do mercado! Como Funciona? Diferente de outros indicadores que utilizam apenas dados históricos, o Mini Índice Composition faz uma leitura ao vivo das ordens que entram e saem das ações, pesando o impacto direto no mini índice. Com

Buy Signal Indicator This indicator generates a Bu y Signal when a potential upward movement is detected. A G reen Arrow appears below the price chart, indicating a possible entry point for a long position. The signal helps traders identify moments of strength in the market.
TIP:- USE 1 HOUR OR BIGGER TIMEFRAMES FOR BETTER RESULTS. TRAIL STOP LOSS BY USING NEAREST SWING HIGHS AND LOWS. NOTE:- THIS INDICATOR GIVES ONLY BUY SIGNALS FOR SELL SIGNAL USE MY OTHER INDICATOR.

Sell Signal Indicator This indicator generates a Sell Signal when a potential downward movement is detected. A Red Arrow appears above the price chart, indicating a possible entry point for a short position. The signal helps traders identify moments of strength in the market.
TIP:- USE 1 HOUR OR BIGGER TIMEFRAMES FOR BETTER RESULTS. TRAIL STOP LOSS BY USING NEAREST SWING HIGHS AND LOWS. NOTE:- THIS INDICATOR GIVES ONLY SELL SIGNALS FOR BUY SIGNAL USE MY OTHER INDICATOR.

Trade Like the Big Players! ITZ is the ultimate tool for traders looking to align with institutional movements. It keeps you informed about incoming and outgoing market sessions while leveraging highly optimized strategies for session signals.
Key Features: Multi-Currency Support – Trade across different assets effortlessly. Optimized for M1 to M30 Timeframes – Ideal for scalpers and day traders. 3 Powerful Signal Strategies – Designed for high-probability trades. Session Markers & Alerts
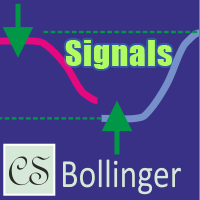
CS Bollinger is a signal indicator based on Bollinger Bands, designed for the rapid identification of key support and resistance levels with visual trading signals. Thanks to an improved level-switching logic, the indicator automatically adjusts levels on the chart, displaying signal arrows when a price reversal is confirmed. This helps traders quickly identify favorable moments for entering and exiting the market. The indicator offers flexible settings that allow it to be adapted to an individu

This is a true trend lines indicator for MT4/MT5.
This indicator draw real trend lines.
Usually the trend line is drawn as a solid line.
The next trend line that is likely to be valid is drawn as a dotted line.
The most recent invalidated trend line is drawn as a dashed line.
Three-touch lines is drawn as a bright colors.
If the starting point of the trend line is new, the blue line is displayed(call shortline),
if it is old, the gold line is displayed(call longline).
The number of bars border

Parabolic SAR + Deviation [BigBeluga] is an enhanced Parabolic SAR indicator designed to detect trends while incorporating deviation levels and trend change markers for added depth in analyzing price movements. Key Features: > Parabolic SAR with Optimized Settings: Built on the classic Parabolic SAR, this version uses predefined default settings to enhance its ability to detect and confirm trends. Clear trend direction is indicated by smooth trend lines, allowing traders to easily visuali

The indicator shows buy and sell signals. Timeframe - any, currency pair - any. Parameters: alertsMessage - enable/disable the message window. alertsSound - enable/disable sound. Arrow Type - select arrow type. There are three simple ways to filter the indicator signals: Compare direction with the indicator from the older timeframe. Use standard MACD diagram. Use Parabolic indicator. Disclaimer of liability : You should also not forget about money management and stop loss . Trading Forex and oth
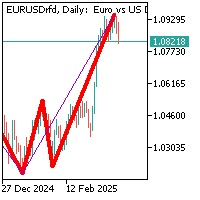
Two zigzags with different periods of 13 and 55 are formed in this indicator.
When two segments of the indicator form and connect in place, thereby forming a minimum or maximum of the price on a certain timeframe, the indicator signals a possible price reversal in the opposite direction. If, when forming a zigzag with the smallest period (period 13), the largest period (period 55) remains at the same minimum or the maximum, this means that a corrective movement to the previous maximum or minim
Trend Risk Analyzer intelligently identifies trends, impulses, and corrections, calculating optimal trade volumes and safe levels for stop-loss and take-profit. Increase your accuracy, reduce risks, and boost your trading profits! This product is also available for MetaTrader 4 => https://www.mql5.com/en/market/product/134800 The key feature of Trend Risk Analyzer is its capability to calculate the average range of each market element, enabling traders to set justified stop-loss and take-profi

API BullBearPower mtf MT5 Designed for traders who rely on BullBearPower, this tool provides a multi-timeframe (MTF) view of BullBearPower, helping you identify possible dominant trends. Key Features: Multi-Timeframe Analysis – Analyze BullBearPower across different timeframes in real time. Dynamic Color Changes – Identify possible BullBearPower per individual timeframe with color changes. Volume Integration – Get a picture of possible trend strength with BullBearPower volume of each time

Elite Market Precision Indicator: Outsmart Institutional Manipulation with Fibonacci & Pivot Synergy The Institutional Trap: Why Most Traders Fail The financial markets are a battlefield where institutional traders manipulate price action to create false breakouts, liquidity hunts, and engineered reversals. Most retail traders fall victim to these deceptive moves, leading to emotional trading, fake signals, and capital losses. The Solution: Precision Trading with Fibonacci, Pivot Points & Candle
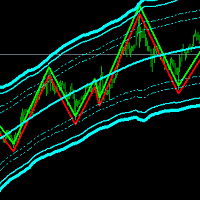
Channel Trend Bands – A Comprehensive Indicator for Market Analysis MetaTrader 4 Version
Simple to Use, Effective in Application User-Friendly and Suitable for All Traders This indicator stands out due to its straightforward functionality. Whether you're a beginner exploring the market or an experienced trader refining your strategy, this tool offers valuable insights. Using a Triangular Moving Average (TMA) with additional ATR-based bands , it provides structured market data to support w

The indicator is a combination of 3 identical moving averages with a JMA calculation option with different smoothing depth settings. When the fast line crosses the middle and slow lines, the color of all lines changes, and only when the fast line crosses the middle and slow lines in the opposite direction will the color change - a trigger is triggered that does not allow switching directions if only the middle or slow line was crossed, so that the readings do not jump and there is a confident

TickATR Indicator for MT5 Description The TickATR indicator is a powerful volatility measurement tool for MetaTrader 5 that displays the Average True Range (ATR) in terms of actual price ticks. This innovative approach provides traders with a more precise and instrument-independent way to gauge market volatility compared to traditional ATR indicators. By measuring volatility in ticks rather than price units, TickATR offers consistent readings across different instruments regardless of their pric

AROS (Adaptive Robust One-Sided Smoother)
is a non-repainting trend indicator designed for live trading .
It plots a smooth adaptive trend line directly in the main chart window , helping traders: identify the current market trend , reduce noise and false signals during sideways markets, adapt automatically to changing volatility conditions. Unlike classic moving averages, AROS: reacts faster during strong trends , becomes more stable during choppy or ranging markets , never uses future data (f

Gold Rush Scalper The Gold Rush Scalper is a simple yet powerful trading indicator designed for scalping gold (XAU/USD) on the 5-minute chart. It provides clear Buy and Sell arrows, helping traders identify potential trade opportunities with ease.
Key Features:
Buy & Sell Arrows Only: No extra indicators, just precise entry signals. 5-Minute Timeframe : Specifically designed for fast-paced gold trading.
Gold ( XAU/USD ) Only: Not intended for other assets .
No Built-in Risk Management: Trade

HMM4 Indicator Documentation HMM4 Indicator Documentation Introduction The HMM4 indicator is a powerful technical analysis tool that uses a 4-Gaussian Hidden Markov Model (HMM) to identify market regimes and predict potential market direction. This indicator applies advanced statistical methods to price data, allowing traders to recognize bull and bear market conditions with greater accuracy. The indicator displays a stacked line chart in a separate window, representing the mixture weights of f

Spike Hunter B500 A precision trading tool designed exclusively for the B500 1-minute chart. It identifies sharp price movements and potential trade opportunities with built-in risk indication features to help manage volatility. Ideal for traders looking to capitalize on quick market spikes. Alert notifications Push notifications
Disclaimer: Trading involves significant risk of capital loss. You trade at your own risk. Past performance does not guarantee future results. Use proper risk manage
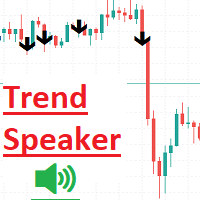
Trend Speaker indicator is a powerful tool designed for traders who want to easily track and analyze market trends in real-time. It provides clear, reliable buy and sell signals on the chart, making it incredibly convenient to assess the market's current trend. With its user-friendly interface, the Trend Speaker ensures you never miss a potential trading opportunity, helping you make informed decisions and enhance your trading strategy. It displays Stop Loss and Take Profit with for all BUY a

Receive notifications for multi-trendline or single trendline breakout. Yes! You heard us right! You will be notified the moment price crosses any and all the timeframe trendlines that you have chosen. 1. ADDING MULTIPLE OR SINGLE TRENDLINES IN THE SAME DIRECTION To trigger a stronger trading opportunity you can require that price breaks one or more trend lines of different timeframes in the same direction. To do this navigate to the timeframe for which you want to add a trendline and click

Max Min Delta Indicator - Market Volume Imbalance Analysis Gain Deeper Insights into Market Volume Imbalance with Delta Analysis What is the Max Min Delta Indicator? The Max Min Delta Indicator is a powerful market volume analysis tool that visually represents maximum and minimum delta values using a histogram. It helps traders identify market strength, weakness, absorption, and aggressive buying/selling activity with precision. Key Features Histogram Visualization: Displays Max Delta (Green) an

Multi Currency Multi Time Market Scan Signals Multi Currency Multi Time Market Scan Signals (MT5 Dashboard) Unlock Smarter Trading with Real-Time Market Insights Across Multiple Currencies & Timeframes! The Multi Currency Multi Time Market Scan Signals dashboard is your all-in-one solution for MetaTrader 5 , designed to simplify complex market analysis and pinpoint high-probability trading opportunities. Say goodbye to manual chart hopping – this powerful tool scans multiple symbols and timef
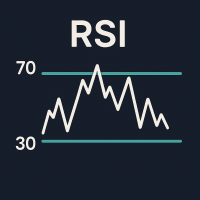
RSI Power Bars – Clear and Precise Momentum Visualization Description: This indicator upgrades the classic RSI into a much more visual and powerful tool. Instead of a flat line, it displays colored bars that instantly show the direction and strength of price movement. Red = bullish momentum
Green = weakness or pullback No more guessing trend shifts or calculating momentum mentally — you see it instantly . Key Benefits: Instantly spot trend reversals Visualize market momentum with bars

Spearman Rank MTF – Momentum Oscillator with Trend Intelligence The Spearman Rank MTF is a powerful oscillator designed to measure trend strength and direction using a statistical approach based on Spearman's Rank Correlation . This indicator excels at detecting trend changes, key reversals, and overbought/oversold conditions with precision and clear visual cues. Key Benefits Multi-Timeframe (MTF) support – analyze higher timeframes without leaving your current chart. Dual smoothing modes –
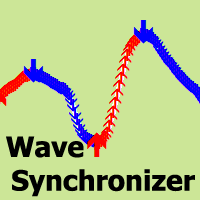
Wave Synchronizer is a visual indicator of wave analysis. Combines candlestick movement sequences and builds directional waves, producing synchronous movements together with the market.
The beginning of each wave begins with a signal arrow, there are also alerts.
The indicator will never redraw or move the arrows on the previous history. Signal arrows appear at the close of the candle. Adapts to work with any trading instruments and time frames. Easy to use and configure, contains only 2 input

The Stats Probability (CStatsBoard) MQL5 Indicator is an advanced analytical tool designed to statistically measure price fluctuations as percentages, presented in a professional, real-time table format within a sub-window. With its high-speed updates and exceptional accuracy, this indicator is a must-have for traders looking to gain deep insights into market behavior and make informed decisions. Key Features:
The tool is displayed in a sub-window as a sleek, professional table (CStatsBoard) t

Fibo Harmonic Levels Indicator Overview The Fibo Harmonic Levels indicator is a powerful MetaTrader 5 (MT5) tool designed to automatically plot harmonic Fibonacci-based support and resistance levels on your chart. These levels and can be applied to different timeframes (Daily, Weekly, Monthly) either automatically or manually. The indicator also includes an alert system that notifies traders when price touches or crosses any harmonic level, with configurable pause intervals to prevent

RTSPattern v10.50 – Elevate Your Price Action to a Data-Driven Strategy RTSPattern v10.50 is more than just an indicator — it’s a precision tool that brings pattern recognition and predictive modeling into your price action workflow. Whether you’re identifying recurring structures or validating market behavior, RTSPattern helps you move from guesswork to statistical confidence. What makes RTSPattern unique: Intuitive Pattern Selection
Simply click the first and last candle of any pattern you see

ReversalRadar: Precision Trend Identification Indicator Trade With Confidence, Trade With The Trend ReversalRadar is a powerful trend identification tool designed to give traders the edge in spotting high-probability trading opportunities. By accurately identifying the current market direction, this indicator allows you to align your trading strategy with the prevailing trend, significantly increasing your potential for profitable trades. Key Features: Real-time Trend Analysis : Dynamic visual s

Full Functionality of the MT5
"TWR MTF BREAKOUT" INDICATOR
FOR APP SOURCE CODE: t.me/KingRennie
APP SOURCE CODE WORKS FOR MT4 AND MT5
FEE =$1500 The MT5 " TWR MTF BREAKOUT " INDICATOR is a comprehensive trading tool designed to help traders make informed decisions by utilizing Fibonacci levels, time-based analysis, and demarcating major trading sessions. This INDICATOR is ideal for both novice and experienced traders who want to enhance their trading strategies with advanced technical analys

What is Linear Regression? Linear regression is a statistical method used to model the relationship between price and time. In forex trading, it helps traders identify trends, potential reversals, and areas of support and resistance. Uses of Linear Regression in Forex Trading Trend Identification The regression line acts as a dynamic trendline, showing whether the market is trending upward or downward. Traders can use the slope of the regression line to measure trend strength. Support and Resist

RSI Divergence Suite Pro - Advanced Divergence Detection Indicator
RSI Divergence Suite Pro is an advanced technical indicator for MetaTrader 5 designed to detect and analyze divergences between price action and RSI momentum. The indicator provides comprehensive divergence analysis with multi-timeframe integration and customizable alert system.
DIVERGENCE DETECTION
Types of Divergences Detected - Regular Bullish Divergence: Price makes lower low, RSI makes higher low - Regular Bearish Diver
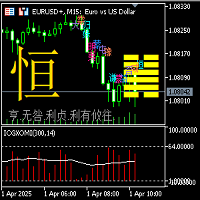
Indicator description of Yijing Guaxiang Oscillation Mean Indicator: (1) This Yijing Guaxiang change indicator is based on the Yin-Yang transformation thought of the "I Ching" philosophy in ancient Chinese culture, integrating the results of the long-short game in each candlestick K-line period of the financial trading K-line chart, using China's oldest prediction coding method, in the form of the 64 hexagrams of the I Ching, combining the Yin-Yang of each line of the hexagram with the Yin-Yang
The MetaTrader Market is a unique store of trading robots and technical indicators.
Read the MQL5.community User Memo to learn more about the unique services that we offer to traders: copying trading signals, custom applications developed by freelancers, automatic payments via the Payment System and the MQL5 Cloud Network.
You are missing trading opportunities:
- Free trading apps
- Over 8,000 signals for copying
- Economic news for exploring financial markets
Registration
Log in
If you do not have an account, please register
Allow the use of cookies to log in to the MQL5.com website.
Please enable the necessary setting in your browser, otherwise you will not be able to log in.