Watch the Market tutorial videos on YouTube
How to buy а trading robot or an indicator
Run your EA on
virtual hosting
virtual hosting
Test аn indicator/trading robot before buying
Want to earn in the Market?
How to present a product for a sell-through
Technical Indicators for MetaTrader 5 - 2
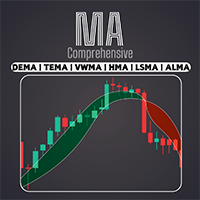
Access a wide range of moving averages, including EMA, SMA, WMA, and many more with our professional Comprehensive Moving Average indicator. Customize your technical analysis with the perfect combination of moving averages to suit your unique trading style / MT4 Version
Features Possibility to activate two MAs with different settings. Possibility to customize chart settings. Possibility to change the color of the candlesticks depending on crossed MAs or price crossed with MAs. Sending of
FREE

Dark Support Resistance is an Indicator for intraday trading. This Indicator is programmed to identify Support and Resistance Lines , providing a high level of accuracy and reliability.
Key benefits
Easily visible lines Only the most important levels will be displayed Automated adjustment for each timeframe and instrument Easy to use even for beginners Never repaints, never backpaints, Not Lag 100% compatible with Expert Advisor development All types of alerts available: Pop-up, Email, Push

Stop Guessing. Start Trading with a Statistical Edge.
Stock indices don't trade like forex. They have defined sessions, they gap overnight, and they follow predictable statistical patterns. This indicator gives you the probability data you need to trade indices like the DAX, S&P 500, and Dow Jones with confidence. What Makes This Different Most indicators show you what happened. This one shows you what's likely to happen next. Every trading day, the indicator analyses your current setup against

Rental/Lifetime Package Options and Privileges
Rent Monthly Six Months Yearly/Lifetime Weis Wave with Speed with Alert+Speed Index x x x Manual x x x Quick Set up Video x x x Blog x x x Lifetime Updates x x x Setup and Training Material
x x Discord Access Channel "The SI traders" x Rectangle Break Alert Tool x
How to trade with it: http://www.tradethevolumewaves.com ** If you purchase please contact me to setup your : Training Room and complete manual access.
Wei

Rtc ML Ai | Predictor CORE MACHINE LEARNING ENGINE
Adaptive ML Market Predictor – Multi-Bar Trend & Candle Forecast What This Indicator Does This indicator is a real-time market prediction engine designed to analyze price behavior and estimate future market tendencies . Unlike conventional indicators, this system does not rely on static parameters or historical curve-fitting , but adapts its internal state dynamically during live market operation. Instead of using static rules, the indic

CLICK HERE TO SEE ALL MY FREE PRODUCTS
When it comes to recognizing perfect market opportunities and trading breakouts precisely, RangeXpert is one of the most effective tools on the market. Developed by me specifically for beginners and semi-professionals, it delivers analysis quality that you usually only know from professional trading tools for banks, institutional traders and hedge funds . The indicator identifies market areas that often lead to strong movements and marks them so clearly a
FREE

Crystal Supply Demand Pro (SD Pro) Don’t trade in every candle – wait for institutional zones. Crystal Supply Demand Pro (SD Pro) is a professional Supply & Demand zone indicator for MetaTrader 5.
It is built for traders who want clean, institutional-quality zones on their charts instead of cluttered boxes or outdated concepts.
With higher-timeframe optimization, dynamic updates, and professional visuals, SD Pro ensures your charts display only the levels that truly matter . Key Features Institu
FREE
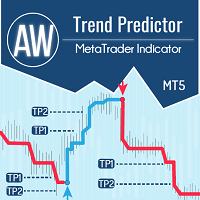
The combination of trend and breakdown levels in one system. An advanced indicator algorithm filters market noise, determines the trend, entry points, as well as possible exit levels. Indicator signals are recorded in a statistical module, which allows you to select the most suitable tools, showing the effectiveness of the signal history. The indicator calculates Take Profit and Stop Loss marks. Manual and instruction -> HERE / MT4 version -> HERE How to trade with the indicator: Trading wit

Introducing Quantum TrendPulse , the ultimate trading tool that combines the power of SuperTrend , RSI , and Stochastic into one comprehensive indicator to maximize your trading potential. Designed for traders who seek precision and efficiency, this indicator helps you identify market trends, momentum shifts, and optimal entry and exit points with confidence. Key Features: SuperTrend Integration: Easily follow the prevailing market trend and ride the wave of profitability. RSI Precision: Detect
The Opening Range Breakouts Indicator is a session based trading tool designed for traders who follow institutional trading concepts, such as ICT (Inner Circle Trader), Smart Money Concepts (SMC), and volume or order flow based strategies. This indicator plots essential session opening ranges, allowing traders to identify potential liquidity sweeps, breakout zones, fakeouts, and key intraday levels across the major global Forex sessions. This strategy is rooted in the concept of the Opening Rang

Special offer : ALL TOOLS , just $35 each! New tools will be $30 for the first week or the first 3 purchases ! Trading Tools Channel on MQL5 : Join my MQL5 channel to update the latest news from me Unlock the power of ICT’s Inversion Fair Value Gap (IFVG) concept with the Inversion Fair Value Gaps Indicator ! This cutting-edge tool takes Fair Value Gaps (FVGs) to the next level by identifying and displaying Inverted FVG zones—key areas of support and resistance formed after price m

Ultimate Boom and Crash Indicator
The Ultimate Boom and Crash Indicator is a cutting-edge tool developed by Coetsee Digital , designed to identify potential spike opportunities in the market. Crafted for traders focusing on Deriv and Weltrade synthetic markets, this indicator is optimized to operate exclusively on the 3-minute (M3), 5-minute (M5), 15-minute (M15), 30-minute (M30), and 1-hour (H1) timeframes and supports only the following pairs: PainX 1200, PainX 999, PainX 800, PainX 600, Pai

The Area of Interest (AOI) Indicator is a powerful tool designed to help traders identify key market zones where price reactions are highly probable. This indicator specifically highlights two critical zones: Seller AOI (Area of Interest) : This zone represents areas where sellers are likely to enter the market, often acting as resistance. When the price approaches or touches this zone, it signals that a potential sell-off could occur. Buyer A OI (Area of Interest) : The BOI zone identifie
FREE

Our Basic Candlestick Patterns indicator makes identifying major candlestick patterns easier than ever. Discover patterns such as the Hammer, the Evening Star, the Three White Soldiers and many more with just a glance at your chart. With an intuitive interface and clear visual cues, our indicator helps you identify trading opportunities quickly and accurately / MT4 version Dashboard Scanner for this indicator: ( Basic Candlestick Patterns Dashboard )
Features
Accuracy : Automatically iden
FREE

- Real price is 200$ - 50% Discount (It is 99$ now) - It is enabled for 2 purchases. Contact me for extra bonus (Gann Trend indicator), instruction or any questions! - Non-repaint, No lag - I just sell my products in Elif Kaya Profile, any other websites are stolen old versions, So no any new updates or support. - Lifetime update free Gann Gold EA MT5 Introduction W.D. Gann’s theories in technical analysis have fascinated traders for decades. It offers a unique approach beyond traditional cha
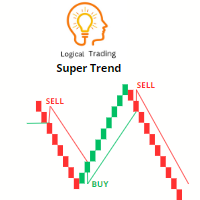
The Super Trend indicator is a popular technical analysis tool used by traders to identify the direction of a trend and potential entry and exit points in the market. It is a trend-following indicator that provides signals based on price action and volatility. The Super Trend indicator consists of two lines - one indicating the bullish trend (usually colored green) and the other indicating the bearish trend (usually colored red). The lines are plotted above or below the price chart, depending on
FREE
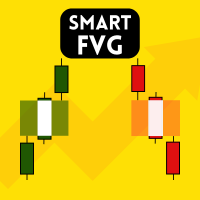
Smart FVG Indicator MT5 – Fair Value Gap and Imbalance Detection Smart FVG Indicator MT5 is a professional Fair Value Gap (FVG) and Imbalance detection tool for MetaTrader 5 . It is designed for traders who use Smart Money Concepts (SMC) and ICT-style analysis to study market structure, liquidity and price inefficiencies. The indicator automatically scans price action to find valid Fair Value Gaps and Imbalance zones , then draws and updates these zones directly on the chart. This helps you see
FREE
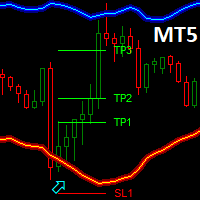
Dark Bands is an Indicator for intraday trading. This Indicator is based on Counter Trend strategy but use also Volatility. We can enter in good price with this Indicator, in order to follow the inversions on the current instrument.
Key benefits
Easily visible take profit/stop loss lines Reliable bands lines with futuristic colors, and Intuitive directional arrows Useful statistics , which indicate the win rate of the signals Plus Package available, leave a feedback to receive it for fr
FREE

Easy Buy Sell is a market indicator for opening and closing positions. It becomes easy to track market entries with alerts.
It indicates trend reversal points when a price reaches extreme values and the most favorable time to enter the market. it is as effective as a Fibonacci to find a level but it uses different tools such as an algorithm based on ATR indicators and Stochastic Oscillator. You can modify these two parameters as you wish to adapt the settings to the desired period. It cannot

Gold & Currency Strength Suite (MT5)
Professional 7-tab dashboard for real-time currency strength analysis, correlation tracking, and session-based trading intelligence across 8 currencies plus Gold.
Overview Currency Strength Suite provides comprehensive multi-currency analysis through seven specialized panels: Strength Meter, Session Performance, Pair Scanner, Analysis Tab, Correlation Matrix, Correlation Clusters, and Settings. The system tracks strength on a -10 to +10 scale using RSI mom
Introdução O Precision Spike Detector V2 é um indicador avançado para MetaTrader 5 (MT5) projetado para identificar potenciais picos de preço (movimentos bruscos de mercado) em índices sintéticos (DERIV: Boom, Crash; WELTRADE: GainX e PainX).
Ele combina análises de RSI (Índice de Força Relativa) e ATR (Amplitude Média Real) para fornecer sinais precisos e confiáveis. Funciona apenas no período M5 (5 minutos) . Em outros períodos, nenhuma seta será exibida. Principais características Filtro ba

After 18 years of experience in the markets and programming, Winner indicator is ready. I would like to share with you! *** Contact me to send you instruction and add you in group for sharing or seeing experiences with other users. Largest Market Cap belongs to Gold, Bitcoin and US30, So they have many traders and great for use in scalping. Gold and Bitcoin Assistant will earn profit on M5 time frames in Gold, Bitcoin and US30. Easy strategy comes from long years experiences, It is a piece of c

Smart Auto Trendline Indicator automatically plots support and resistance trendlines on your MetaTrader 5 chart. The trendlines are updated only when a new bar forms, ensuring optimal performance. Features Customizable parameters for line width, colors, and extremum side ranges. Lines are drawn as support (pink) and resistance (blue) with selectable and adjustable properties Don't forget to leave your review to assist further developments . If you have any questions, feel free to send us a priva
FREE

This indicator identifies the most popular Harmonic Patterns which predict market reversal points. These harmonic patterns are price formations that are constantly repeating in the forex market and suggest possible future price movements / Free MT4 Version Dashboard Scanner for this indicator: ( Basic Harmonic Patterns Dashboard ) Comparison of "Basic Harmonic Pattern" vs. "Basic Harmonic Patterns Dashboard" Indicators Feature Basic Harmonic Pattern
Basic Harmonic Patterns Dashboard
F
FREE

Haven Volume Profile is a multifunctional indicator for volume profile analysis that helps identify key price levels based on the distribution of trading volume. It is designed for professional traders who want to better understand the market and identify important entry and exit points for trades. Other Products -> HERE Main features: Point of Control (POC) calculation - the level of maximum trading activity, which helps identify the most liquid levels Value Area definition (area of increased
FREE

Simple QM Pattern is a powerful and intuitive trading indicator designed to simplify the identification of the Quasimodo (QM) trading pattern. The QM pattern is widely recognized among traders for effectively signaling potential reversals by highlighting key market structures and price action formations. This indicator helps traders easily visualize the QM pattern directly on their charts, making it straightforward even for those who are new to pattern trading. Simple QM Pattern includes d
FREE

Top indicator for MT5 providing accurate signals to enter a trade without repainting! It can be applied to any financial assets: forex, cryptocurrencies, metals, stocks, indices . Watch the video (6:22) with an example of processing only one signal that paid off the indicator! MT4 version is here It will provide pretty accurate trading signals and tell you when it's best to open a trade and close it. Most traders improve their trading results during the first trading week with the help of

VM Trend Candles Indicator - Complete Trend Trading Solution Trend Candles Indicator is a professional, intuitive, and easy-to-use Forex trading system designed to transform complex trend analysis into clear, high-probability trading signals. Based on proven trend-following principles and enhanced with intelligent market filtering, the indicator provides accurate BUY/SELL signals together with automatically calculated Stop Loss and Take Profit levels according to market volatility. The system su
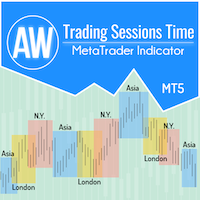
For the convenience of traders in obtaining data on the performance of markets and better formulating trading strategies, we have developed a trading session indicator. The opening hours of various exchanges affect trading as it affects market activity and trading volumes. These factors determine the volatility and trading opportunities of different instruments. The AW Trading Sessions Time indicator displays the trading hours of the Asian, London and New York markets. Traders can show or hide d
FREE

Stratos Pali Indicator is a revolutionary tool designed to enhance your trading strategy by accurately identifying market trends. This sophisticated indicator uses a unique algorithm to generate a complete histogram, which records when the trend is Long or Short. When a trend reversal occurs, an arrow appears, indicating the new direction of the trend.
Important Information Revealed Leave a review and contact me via mql5 message to receive My Top 5 set files for Stratos Pali at no cost !
Down

Breakthrough Solution For Trend Trading And Filtering With All Important Features Built Inside One Tool! Trend PRO's smart algorithm detects the trend, filters out market noise and gives entry signals with exit levels. The new features with enhanced rules for statistical calculation improved the overall performance of this indicator.
Important Information Revealed Maximize the potential of Trend Pro, please visit www.mql5.com/en/blogs/post/713938
The Powerful Expert Advisor Version
Automatin

MACD Intraday Trend is an Indicator developed through an adaptation made of the original MACD created by Gerald Appel in the 1960s. Through years of trading it was observed that by changing the parameters of the MACD with Fibonacci proportions we achieve a better presentation of the continuity of the trend movements, making that it is possible to more efficiently detect the beginning and end of a price trend. Due to its efficiency in detecting price trends, it is also possible to identify very c
FREE
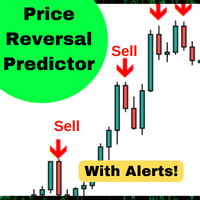
This algorithm predicts short term changes in price with a 90%* accuracy. Predicts if price will be higher or lower than the signal candle. Perfect for mean reversion trading, binary options or futures contracts on larger time frames. The indicator was backtested on 5 years of data and has a 90% accuracy for predicting price reversals over time. Features: Simple setup Drag and drop onto any chart Enable alerts (optional) And you're done! Visual and audio alerts Alerts sent directly to your phon
FREE

KT Higher High Lower Low marks the following swing points with their respective S/R levels: Higher High: The swing high made by the price that is higher than the previous high. Lower High: The swing high made by the price that is lower than the previous high. Lower Low: The swing low made by the price that is lower than the previous low. Higher Low: The swing low made by the price that is higher than the previous low.
Features The intensity of swing high and swing low can be adjusted by chan

Hydra Trend Rider is a non-repainting, multi-timeframe trend indicator that delivers precise buy/sell signals and real-time alerts for high-probability trade setups. With its color-coded trend line, customizable dashboard, and mobile notifications, it's perfect for traders seeking clarity, confidence, and consistency in trend trading. Setup & Guide: Download MT4 Version here. To learn how to use the Indicator: Indicator Manual & Guide - Read Here
Exclusively for you: It's your chance to st

The Market Sessions indicator is a popular tool among forex and stock traders for visually representing global trading sessions on a price chart. It highlights the time periods for major trading sessions — such as the Asian (Tokyo) , European (London) , and American (New York) sessions — directly on the chart. This helps traders identify when markets open and close, allowing for better decision-making based on session-specific trading behavior. - Asian Session (Default: 00:00-09:00) - London Se
FREE
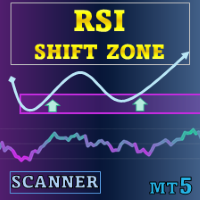
Special offer : ALL TOOLS , just $35 each! New tools will be $30 for the first week or the first 3 purchases ! Trading Tools Channel on MQL5 : Join my MQL5 channel to update the latest news from me RSI Shift Zone Scanner identifies moments when market sentiment may change by linking RSI signals with price action. Whenever the RSI moves above or below preset levels (default 70 for overbought, 30 for oversold), the indicator draws a channel directly on the chart. These channels mark

Effortless trading: non-repainting indicator for accurate price reversals This indicator detects price reversals in a zig-zag fashion, using only price action analysis and a donchian channel. It has been specifically designed for short-term trading, without repainting or backpainting at all. It is a fantastic tool for shrewd traders aiming to increase the timing of their operations. [ Installation Guide | Update Guide | Troubleshooting | FAQ | All Products ]
Amazingly easy to trade It provides

Basic supply demand indicator is a powerful tool designed to enhance your market analysis and help you identify key areas of opportunity on any chart. With an intuitive and easy-to-use interface, this free Metatrader indicator gives you a clear view of supply and demand zones, allowing you to make more informed and accurate trading decisions / Free MT4 version Dashboard Scanner for this indicator: ( Basic Supply Demand Dashboard )
Features The indicator automatically scans the chart fo
FREE

This information indicator will be useful for those who always want to be aware of the current situation on the account.
- More useful indicators
The indicator displays data such as profit in points, percentage and currency, as well as the spread for the current pair and the time until the bar closes on the current timeframe. There are several options for placing the information line on the chart: - To the right of the price (runs behind the price); - As a comment (in the upper left corner of
FREE

Identify ranges | Get earliest signals of Trends | Get clear exits before reversal | Spot the Fibo levels the price will test | Non-repainting, non-delayed indicator - ideal for manual and automated trading - for all assets and all time units After purchase, please contact me to get your FREE TrendDECODER_Scanner Version MT4 - MT5 | Check our 3 steps MetaMethod to maximise your profits: 1. TrendDECODER 2. PowerZONES 3. BladeSCALPER
What is it about?
TrendDECODER is a concen

King Smart Liquidity MT5 is an advanced analytical indicator specifically designed to track institutional money flows and major banks in forex, gold, indices, Bitcoin, and other markets. This indicator was developed based on the "Smart Money Concept" methodology, which relies on understanding price action, liquidity zones, and how major financial institutions behave in the market. The indicator doesn't merely draw lines or zones, but provides a comprehensive analysis of the real market structur

The " Dynamic Scalper System MT5 " indicator is designed for the scalping method of trading within trend waves.
Tested on major currency pairs and gold, compatibility with other trading instruments is possible.
Provides signals for short-term opening of positions along the trend with additional price movement support.
The principle of the indicator.
Large arrows determine the trend direction.
An algorithm for generating signals for scalping in the form of small arrows operates within trend wav

This is an astronomy indicator for the MT4 / MT5 platform like optuma program that performs a variety of functions. It uses complex algorithms to perform its own calculations, which are so accurate. The indicator has a panel that provides astronomical information such as planets' geo/heliocentric cords, distance of sun/earth, magnitude, elongation, constellation, ecliptic cords, equatorial cords, and horizontal cords depending on the vertical line that generated by the indicator depend on the t

This free algorithm predicts short term changes in price with a 86%* accuracy. When there is a large move as determined by the ATR, during an overbought or oversold condition, the indicator will alert you. Predicts if price will be higher or lower than the signal candle. Perfect for mean reversion trading, binary options or futures contracts on larger time frames. The indicator was backtested on 5 years of data and has a 90% accuracy for predicting price reversals over time. Features: Simple set
FREE

SynaptixQuant Commodities Dominance – Professional Market Intelligence Professional MT5 commodity strength dashboard with real-time dominance scoring, correlation analysis, and smart entry detection for Gold, Silver, Oil, and Metals traders. Institutional Commodity Intelligence for MetaTrader 5 The SynaptixQuant Commodities Dominance is a professional-grade market intelligence indicator built for traders who demand precision, structure, and clarity when trading commodities. Designed by Synapti

Unlock hidden profits: accurate divergence trading for all markets Tricky to find and scarce in frequency, divergences are one of the most reliable trading scenarios. This indicator finds and scans for regular and hidden divergences automatically using your favourite oscillator. [ Installation Guide | Update Guide | Troubleshooting | FAQ | All Products ]
Easy to trade
Finds regular and hidden divergences Supports many well known oscillators Implements trading signals based on breakouts Displays

Dark Oscillator is an Indicator for intraday trading. This Indicator is based on Counter Trend strategy, trying to intercept changes in direction, in advance compared trend following indicators. We can enter in good price with this Indicator, in order to follow the inversion of the trend on the current instrument. It is advised to use low spread ECN brokers. This Indicator does Not repaint and N ot lag . Recommended timeframes are M5, M15 and H1. Recommended working pairs: All. I nst

Auto Order Block with break of structure based on ICT and Smart Money Concepts (SMC)
Futures Break of Structure ( BoS )
Order block ( OB )
Higher time frame Order block / Point of Interest ( POI ) shown on current chart
Fair value Gap ( FVG ) / Imbalance - MTF ( Multi Time Frame )
HH/LL/HL/LH - MTF ( Multi Time Frame )
Choch MTF ( Multi Time Frame )
Volume Imbalance , MTF vIMB
Gap’s Power of 3
Equal High / Low’s

Dark Power is an Indicator for intraday trading. This Indicator is based on Trend Following strategy, also adopting the use of an histogram to determine the right power . We can enter in good price with this Indicator, in order to follow the strong trend on the current instrument. The histogram is calculated based on the size of the bars and two moving averages calculated on the histogram determine the direction of the signal
Key benefits
Easily visible take profit/stop loss lines Intui
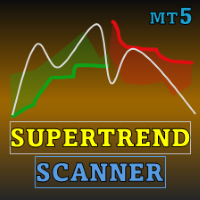
Special offer : ALL TOOLS , just $35 each! New tools will be $30 for the first week or the first 3 purchases ! Trading Tools Channel on MQL5 : Join my MQL5 channel to update the latest news from me Introducing the SuperTrend ATR Multiplier with Scanner for MT5 – a versatile and powerful tool designed to help you stay ahead of market trends, complete with customizable features and real-time alerts. Following the trusted logic of SuperTrend by Kivanc Ozbilgic , this indicator provid
FREE

Special limited-time offer. Important Note: The image shown in the screenshots includes two indicators: the “Suleiman Levels” indicator and the “RSI Trend V” indicator.
NEW UPDATE v 7.9: A remarkable and special update for Mode #3, which is dedicated to detecting levels. The Suleiman Levels indicator is a professional, advanced, and integrated analysis tool. With nearly 9,800 lines of code, it makes your analysis charts clearer than ever before. It is not just an indicator. Powerful features o

** All Symbols x All Timeframes scan just by pressing scanner button ** *** Contact me to send you instruction and add you in "Market Structure group" for sharing or seeing experiences with other users. Introduction: Market structure is important for both new and professional traders since it can influence the liquidity and price action of a market. It’s also one of the most commonly used techniques to understand trends, identify potential reversal points, and get a feel for current mar
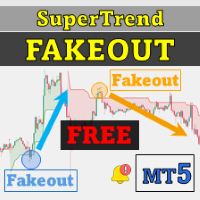
Special offer : ALL TOOLS , just $35 each! New tools will be $30 for the first week or the first 3 purchases ! Trading Tools Channel on MQL5 : Join my MQL5 channel to update the latest news from me The Supertrend Fakeout Indicator is an enhanced version of the classic Supertrend indicator, designed to deliver more reliable trend signals. By incorporating advanced features like the Fakeout Index Limit and Fakeout ATR Mult, this indicator helps to filter out false trend reversals cau
FREE
Hello everyone, I will try to explain how you can use the “All in One Screen” feature for free, which allows you to view multiple data points on a single indicator and on three different indicator screens at the same time.
First, what is this feature used for? ; Fibonacci Levels FVG and Order Block Levels Ichimoku Indicator Envelopes, Bollinger Bands Donchian Channels Retest Zones Support and Resistance Zones Stochastic, and finally ATR Indicators.
1. What is on the Control Panel Scre
FREE
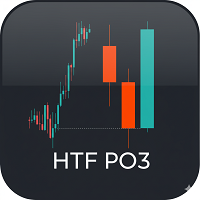
Your valuable feedback and ratings are the driving force behind our ongoing efforts to improve. Product Name: HTF PO3 - Higher Timeframe Candle Display Description HTF PO3 is a powerful visualization tool designed for MetaTrader 5. Its primary function is to draw Higher Timeframe (HTF) candles directly on your main chart, cleanly positioned in the right-hand margin. This allows traders to conduct multi-timeframe analysis without switching charts, providing a clear view of the larger market st
FREE

Smart Volume Box is designed to give MetaTrader users a powerful, analytical tool for uncovering the hidden dynamics in the market. This precision-built tool, complete with user-friendly settings, integrates essential volume insights and advanced features like Volume Profile, VWAP (Volume Weighted Average Price), and Point of Control (POC) levels. Unlike typical indicators, Smart Volume Box doesn’t provide specific trade signals but instead offers a clearer perspective on market trends, makin

This is the best Support and Resistance Indicator on the market, and it shows both confirmed Support and Resistance as well as Retests. Support & Resistance: Support marks where buying demand halts price declines, acting as a safety net. Resistance caps price surges, driven by selling pressure. Traders leverage these levels to predict reversals, plan entries, exits, and manage risks, making them trading's fundamental guideposts. Join To Learn Market Depth - https://www.mql5.com/en/channels/su
FREE

One of the very few indicators that calculate levels solely based on price. The indicator is not affected by time frames, trends, or market cycles. One of the most logical indicators ever made. The indicator automatically calculates the daily levels of interest for market participants based on the activity from the previous day.
It also calculates weekly, monthly, and yearly levels based on the activity from the previous week, month, or year.
Combining everything this way, every day you know exa

Market Structure Order Block Dashboard MT5 is a visual analysis indicator for MetaTrader 5 based on market structure and ICT / Smart Money concepts. Important: This product does not place any orders and does not manage positions . It is an analysis tool (not an Expert Advisor). Key Points Quick reading of market structure (HH/HL/LH/LL, BOS, ChoCH) Highlighting of Smart Money zones (Order Blocks, FVG, liquidity) Asian / London / New York sessions + Kill Zones Local Volume Profile (POC, VAH, VAL)

Order Flow Pro: Synthetic Order Flow & Footprint Analysis Order Flow Pro is a comprehensive analysis suite designed to synthesize professional-grade Order Flow metrics using standard broker Tick Data. It combines Footprint Charts, Volume Profile, CVD, and VWAP into a single optimized indicator without requiring Level 2 data feeds. This tool allows scalpers and day traders to analyze aggressive buying/selling pressure, potential reversals, and market imbalances in real-time based on technical da

The volume profile indicator of the market + a smart oscillator. It works on almost all instruments-currency pairs, stocks, futures, cryptocurrency, on real volumes and on tick ones. You can set both the automatic definition of the profile range, for example, for a week or a month, etc., and set the range manually by moving the boundaries (two vertical lines red and blue). It is shown as a histogram. The width of the histogram at this level means, conditionally, the number of transactions condu

Indicator for determining flat and trend.
If the price is below any of the two histograms and two lines (red and blue), this is a sell zone.
When purchasing this version of the indicator, MT4 version for one real and one demo account - as a gift (to receive, write me a private message)!
If the price is above any of the two histograms and two lines (red and blue), this is a buy zone. MT4 version: https://www.mql5.com/ru/market/product/3793 If the price is between two lines or in the zone of
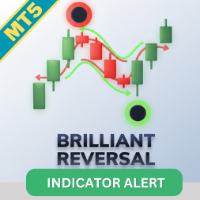
Elevate your trading precision with the Brilliant Reversal Indicator MT5 , a sophisticated tool engineered to detect potential trend reversals by analyzing historical price patterns and bar formations. Drawing from advanced reversal detection algorithms, this indicator stands out in the forex community for its non-repainting nature, ensuring signals remain consistent even after bar closures. Popularized through platforms like MQL5, IndicatorsPot, and trading forums since its introduction, the Br

The Supply and Demand Zone Indicator is a powerful and easy-to-use tool designed to help traders identify critical supply and demand zones on the chart. These zones can provide valuable insight into potential market reversals, breakouts, and important price levels where buyers or sellers are likely to take control. The best FREE Trade Manager . If you want to create your own Hedging or Grid strategies without any coding make sure to check out the ManHedger Key Features: Automatic Zone Detect
FREE

Most traders see engulfing candles. Few know how to trade them profitably. Engulfing Pro Trader gives you dead-simple signals and real stats—trades, wins, profits—to trade reversals with confidence. No hopes, just the real numbers you need. At Real Trades, we show you what’s true, not what’s dreamy. Did you like to see the reality of the engulfing strategy? Leave us a 5-star review and message me privately for an exclusive free product from our Real Trades as a thank you!
Check our other p
FREE

LIMITED TIME SALE - 30% OFF!
WAS $50 - NOW JUST $35! Profit from market structure changes as price reverses and pulls back. The market structure reversal alert indicator identifies when a trend or price move is approaching exhaustion and ready to reverse. It alerts you to changes in market structure which typically occur when a reversal or major pullback are about to happen. The indicator identifies breakouts and price momentum initially, every time a new high or low is formed near a po

ATy Gold and BTC Join my MQL5 channel to update the latest news from me. My community of over 80,000 members on MQL5
ATbot : How It Works and How to Use It How It Works The "AtBot" indicator for the MT5 platform generates buy and sell signals using a combination of technical analysis tools. It integrates Simple Moving Average (SMA), Exponential Moving Average (EMA), and the Average True Range (ATR) index to identify trading opportunities. Additionally, it can utilize Heikin Ashi candles to en

Ultimate Trend-Following Indicator: MACD-Based Signal Generator Unlock the power of trend-following with our advanced indicator, designed to optimize your trading strategy using the MACD (Moving Average Convergence Divergence) and a 200-period Moving Average (MA). This indicator not only provides precise buy and sell signals but also helps you manage risk with dynamic support and resistance levels. What is the MACD? The MACD is a popular trend-following momentum indicator that shows the relation
FREE

Special offer : ALL TOOLS , just $35 each! New tools will be $30 for the first week or the first 3 purchases ! Trading Tools Channel on MQL5 : Join my MQL5 channel to update the latest news from me Volumatic VIDYA (Variable Index Dynamic Average) is an advanced indicator designed to track trends and analyze buy-sell pressure within each phase of a trend. By utilizing the Variable Index Dynamic Average as a core dynamic smoothing technique, this tool provides critical insights into
MetaTrader Market - trading robots and technical indicators for traders are available right in your trading terminal.
The MQL5.community payment system is available to all registered users of the MQL5.com site for transactions on MetaTrader Services. You can deposit and withdraw money using WebMoney, PayPal or a bank card.
You are missing trading opportunities:
- Free trading apps
- Over 8,000 signals for copying
- Economic news for exploring financial markets
Registration
Log in
If you do not have an account, please register
Allow the use of cookies to log in to the MQL5.com website.
Please enable the necessary setting in your browser, otherwise you will not be able to log in.