Watch the Market tutorial videos on YouTube
How to buy а trading robot or an indicator
Run your EA on
virtual hosting
virtual hosting
Test аn indicator/trading robot before buying
Want to earn in the Market?
How to present a product for a sell-through
Technical Indicators for MetaTrader 5 - 16

The Indicator show Daily Pivot Points. It is possible to specify the number of days to display. For forex it doesn't consider the sunday session data. It is possibile to modify the color, style and width for every level. It is better to use this indicator with timeframe not higher than Н1. 4 Levels of support and resistance with also Intermediate Levels that is possible to hide.
FREE

Aroon Trend Indicator Aroon Trend Indicator – Complete Explanation The Aroon indicator is a powerful trend-tracking tool designed to help traders identify the beginning, strength, and maturity of market trends. It consists of two main components: Aroon Up and Aroon Down . Together, these lines show how long it has been since price has reached a recent high or low, allowing traders to detect bullish or bearish momentum with precision. When Aroon Up stays near 100 while Aroon Down remains low, the
FREE
FiboPivot TrendLines - Comprehensive Market Analysis Indicator
This powerful indicator combines Fibonacci pivot point analysis with automatic trend line detection, providing traders with a complete technical analysis toolkit in a single tool.
Key Features : - Fibonacci Pivot Points: Automatically calculates and displays R1-R3, Pivot, and S1-S3 levels using previous day's data - Fractal-Based Trend Lines: Automatically draws channel trend lines based on fractal patterns - Interactive
FREE

This indicator forms a channel based on the readings of the ADX (Average Directional Movement Index) indicator, displays and informs the trader of a price reversal at the boundaries of this channel, and can also report when the price touches the channel boundaries. It also draws additional dotted lines, which depend on the readings of the + DI and -DI of the ADX indicator. It also has an option for filtering signals depending on the readings of the stochastic. The channel drawn by this indicato
FREE

Overview: The US Dollar Index (DXY) is a key financial indicator that measures the strength of the US Dollar against a basket of six major world currencies. This index is crucial for traders and investors as it provides a comprehensive view of the overall market sentiment towards the US Dollar and its relative performance. All Products | Contact Composition: The DXY's composition is as follows: Euro (EUR): 57.6% Japanese Yen (JPY): 13.6% British Pound (GBP): 11.9% Canadian Dollar (CAD): 9.1%
FREE

KT Trend Trading Suite is a multi-featured indicator that incorporates a trend following strategy combined with multiple breakout points as the entry signals.
Once a new trend is established, it provides several entry opportunities to ride the established trend successfully. A pullback threshold is used to avoid the less significant entry points.
MT4 Version is available here https://www.mql5.com/en/market/product/46268
Features
It combines several market dynamics into a single equation to
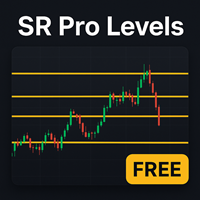
BIG NEWS: GOLD EA RELEASED You asked for automation? We delivered. DRX Equilibrium AI is now available for Gold Prop Trading. ️ CLICK HERE TO VIEW THE EA Launch Price: $149 (Limited Time) Get crystal-clear market structure in seconds – without manual drawing!
The HTF Auto Support & Resistance Indicator automatically marks the key support and resistance levels directly on your chart. These levels are based on a higher timeframe (HTF), making them far more reliable than random short-term
FREE
Its our anniversary! To give back enjoy this 60% discount for the next week (original price $239)
We have combined all of our beloved indicators the likes of: Key level order block , Key level supply and demand , Key level liquidity grab and Key level wedge into one single indicator and dashboard.
Whats new Dashboard : There is an easy access dashboard for all your needs. Multi-timeframe button : There is now a multi-timeframe option for Order Blocks and Supply and demand zones, maki
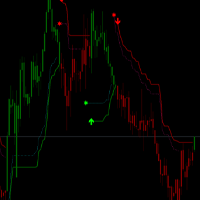
OV-VCS_ATR Trading Rules The OV-VCS_ATR indicator is a popular trend-following technical analysis tool that helps traders identify the current market trend and potential entry/exit points. Below are the general trading rules for using the OV-VCS_ATR indicator: 1. Indicator Overview The OV-VCS_ATR indicator consists of a line plotted on the price chart, which changes color to indicate the trend direction: Green Line: Indicates an uptrend (buy signal). Red Line: Indicates a downtrend
FREE

Este indicador traça uma reta baseada em regressão linear, esta reta é dinâmica e é atualizada a cada tick. O cálculo de regressão linear é feito considerando o número de candles definido pelo tamanho da janela fornecida pelo usuário. São traçadas duas linhas, uma superior e uma inferior, para guiar a estratégia do usuário, a distância dessas linhas para a linha central deve ser configurada. É possível definir os estilos, cores e espessuras de cada uma das linhas.
Esse indicador foi inicialmen
FREE
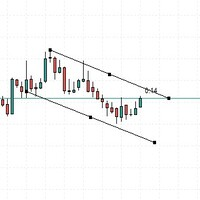
This indicator serves to give sound alerts when the price passes the manually placed line. A very useful tool, which allows you not to spend too much time sitting in front of the computer.
Note that the alert issued will always refer to the current candle, you can use multiple lines on the past chart to analyze.
This indicator will always receive better updates.
FREE

** All Symbols x All Timeframes scan just by pressing scanner button ** Discount: The price is $50$, But now it is just $39, Limited time offer is active.
*** Contact me to send you instruction and add you in "Trend Reversal group" for sharing or seeing experiences with other users. Introduction: Trendlines are the most famous technical analysis in trading . Trendlines continually form on the charts of markets across all the different timeframes providing huge opportunities for traders

The trend is your friend!
Look at the color of the indicator and trade on that direction. It does not repaint. After each candle is closed, that's the color of the trend. You can focus on shorter faster trends or major trends, just test what's most suitable for the symbol and timeframe you trade. Simply change the "Length" parameter and the indicator will automatically adapt. You can also change the color, thickness and style of the lines. Download and give it a try! There are big movements w

The ACB Breakout Arrows indicator provides a crucial entry signal in the market by detecting a special breakout pattern. The indicator constantly scans the chart for a settling momentum in one direction and provide the accurate entry signal right before the major move.
Get multi-symbol and multi-timeframe scanner from here - Scanner for ACB Breakout Arrows MT 5
Key features Stoploss and Take Profit levels are provided by the indicator. Comes with a MTF Scanner dashboard which tracks the brea

The Supertrend indicator is a trend-following technical analysis tool designed to help traders identify the direction of market trends and potential entry/exit points. It operates based on price data and Average True Range (ATR) to create a dynamic signal line that changes color depending on the current trend. Green color: Indicates an uptrend. Red color: Indicates a downtrend. Supertrend is a useful indicator for both short-term and long-term trading, helping to filter out market noise and focu
FREE
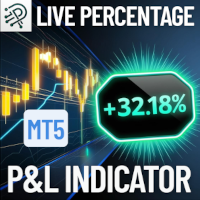
Quickly monitor your floating profit or loss as a percentage of your account balance live and always visible right on your chart! Key Features: Real-Time Calculation: Instantly calculates the combined floating profit or loss from all open trades as a percentage of your current account balance. Easy On-Chart Display: The result is conveniently shown as a label in the lower-right corner of your chart no distractions, always visible. Clear Color Coding: Green for profit, red for loss for immediate
FREE

Multi Kernel Regression Indicator MT5 Professional Non-Repainting Trend Following System with 17 Advanced Kernel Functions Overview The Multi Kernel Regression indicator is a sophisticated technical analysis tool that applies advanced statistical kernel regression methods to price data, offering traders a powerful edge in identifying trends and potential reversal points. Unlike traditional moving averages, kernel regression provides adaptive smoothing that responds intelligently to market dynam

This indicator finds Three Drives patterns. The Three Drives pattern is a 6-point reversal pattern characterised by a series of higher highs or lower lows that complete at a 127% or 161.8% Fibonacci extension. It signals that the market is exhausted and a reversal can happen. [ Installation Guide | Update Guide | Troubleshooting | FAQ | All Products ] Customizable pattern sizes
Customizable colors and sizes
Customizable breakout periods Customizable 1-2-3 and 0-A-B ratios
It implements visual/s
FREE

Channel Searcher MT5 — Multi-Currency Price Channel Detection Indicator An auxiliary tool for automatic detection and visualization of price channels based on fractal peaks and geometric analysis. The indicator is intended exclusively for manual trading and suits traders who follow a structural market approach. It identifies channels using multiple criteria: number of touches, slope, filling density, breakout depth, and relative position of fractals. Flexible customization is available for any
FREE
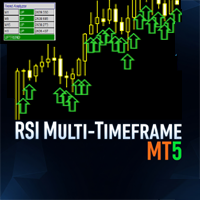
The MultiFrameRSIIndicator is a powerful MetaTrader 5 (MT5) indicator that leverages the Relative Strength Index (RSI) to analyze trends across multiple timeframes. This indicator synchronizes RSI-based trend signals from up to nine timeframes (M1, M5, M15, M30, H1, H4, D1, W1, MN1) and presents them with clear visual feedback, including a colored RSI line, signal arrows, and a customizable dashboard. Ideal for traders seeking momentum-based trend confirmation. Features Multi-Timeframe Analysis
FREE

Welcome to RSI Colored Candles, an innovative indicator designed to enhance your trading experience by integrating the Relative Strength Index (RSI) directly onto your price chart. Unlike traditional RSI indicators, RSI Colored Candles utilizes a four-color scheme to represent RSI levels directly on your candlesticks, providing you with valuable insights at a glance. Features and Benefits: Space-saving Design: Say goodbye to cluttered indicator windows! RSI Colored Candles saves valuable chart
FREE

This indicator is the mql version of the Smoothed Heiken Ashi Candles. Find out more here: https://www.mql5.com/en/users/rashedsamir/seller Heikin-Ashi charts resemble candlestick charts , but have a smoother appearance as they track a range of price movements, rather than tracking every price movement as with candlesticks.
Because the Heikin Ashi candlesticks are calculated based on averages, the candlesticks will have smaller shadows than a regular Japanese candlestick. Just like with
FREE

HMA Color – Master Smoothed A clean, high-precision visual Hull Moving Average indicator with fully smoothed trend color display. Designed for professional scalpers and algorithmic traders who want a simple, fast, powerful trend view without noise. This indicator is built with a " true double smoothing system" , making the Hull curve extremely soft and responsive.
When the trend is bullish, the HMA line automatically switches to Green and shows upward candles.
When the trend is bearish, the HM
FREE

Description of the Harmonic Patterns + Fib Indicator
The Harmonic Patterns + Fib indicator is a technical analysis tool designed for MetaTrader 5 (MT5). It automatically detects and visualizes harmonic price patterns on financial charts, leveraging Fibonacci ratios to identify potential reversal points in markets such as forex, stocks, cryptocurrencies, and commodities. The indicator scans for classic harmonic formations like Butterfly, Bat, Crab, Shark, Gartley, and ABCD, drawing them with lin
FREE
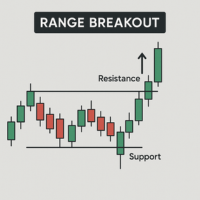
If you love this indicator, please leave a positive rating and comment, it will be a source of motivation to help me create more products <3 Key Takeaways Automatically draws Range High and Range Low boundaries for a chosen time period. Alerts when price breaks above or below the defined range. Support sending notifications via alert, email, notification when breakout occurs. Can be used as a trade signal in breakout-based strategies. However, like all indicators, it isn't foolproof, to avoid
FREE
If you love this indicator, please leave a positive rating and comment, it will be a source of motivation to help me create more products <3 Key Takeaways Provides both trend and momentum signals in a single view. Entry and exit signals are based on the crossover of the RSI and Signal Line. Market Base Line offers insight into the overall trend direction. Volatility Bands help identify overbought and oversold market conditions.
FREE

https://www.mql5.com/en/users/gedeegi/seller GEN (Trend Line) automatically detects swing highs and lows, plots dynamic upper & lower trendlines with adaptive slope (ATR, Standard Deviation, or Linear Regression approximation), and marks breakout points visually when the price crosses the trend boundaries. Perfect for price action, breakout, and trend confirmation strategies across multiple timeframes.
FREE

Trend Hunter is a trend indicator for working in the Forex, cryptocurrency, and CFD markets. A special feature of the indicator is that it confidently follows the trend, without changing the signal when the price slightly pierces the trend line. The indicator is not repaint; a signal to enter the market appears after the bar closes. When moving along a trend, the indicator shows additional entry points in the direction of the trend. Based on these signals, you can trade with a small StopLoss. Tr
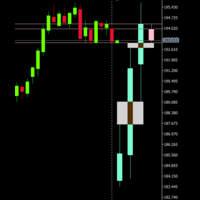
If you like this product, please give it a 5 star rating as a token of appreciation. This indicator projects Higher-Timeframe (HTF) candles onto the current chart and optionally shows their OHLC lines and Fair Value Gaps (FVGs) using ICT 3-candle logic.
Projects multiple higher timeframe candles.
Accurately preserves HTF OHLC on any lower timeframe.
Allows spacing adjustment between projected candles.
Optionally displays OHLC horizontal reference lines.
Automatically detects and draws HTF Fair
FREE
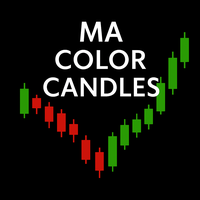
MA Color Candles Indicator MA Color Candles is an indicator for visually displaying market trends by coloring chart candles. It does not add objects or distort price data, instead coloring real candles based on the state of two moving averages. This enables quick trend assessment and use as a filter in trading strategies. How It Works Bullish trend: Fast MA above slow MA, slow MA rising (green candles). Bearish trend: Fast MA below slow MA, slow MA falling (red candles). Neutral state: Candles
FREE
The Ultimate Dashboard New Year Sale - save $20 (normal price $79) Indicators are useful for traders, but when you put them into a dashboard that can scan 28 symbols at once they become even better, and when you can also combine different indicators and timeframes to give you synchronized alerts, then they become awesome. This easy to use dashboard provides you with 32 leading indicators, use them individually or together, to create powerful combination alerts. So when you want to know that RS

Nova Oscillator Advanced Oscillator Matrix — Five Analytical Layers in One Indicator Most oscillators only show one dimension of the market. You see momentum or volume, but rarely both together in a meaningful way. This forces traders to stack multiple indicators, each telling a different story, making it harder to find high-conviction setups. Nova Oscillator solves this by combining five powerful analytical layers into a single sub-window: Hyper Wave momentum, Smart Money Flow tracking, Conflue

If you heard about The Wyckoff Method, Volume Spread Analysis, etc... You are probably searching for the candlestick indicator that shows you the Volume spread all over the current bar, signaling every types of market status... You can control the several Market Levels with custom colors...
It is up to you to decide how to use it. Our job is provide you with the indicator...
If you like this indicator, all I am asking is a little Review (not a Comment, but a REVIEW! )... This will mean A LO
FREE
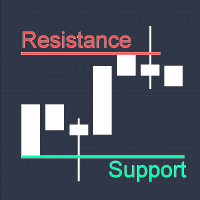
True Support Resistance Indicator: Your Ultimate Tool for Precise Trading Decisions Quick Overview It's a simple indicator that elevates your trading strategy. True Support Resistance Indicator is a powerful tool designed to identify key support/resistance levels in real-time. Experience clean visuals, instant alerts on breakouts, and dynamic updates that keep you ahead of market movements. Why Choose True Support Resistance Indicator? 1. Simplicity Meets Precision - Two clearly colored
FREE

What is this indicator? This indicator is for comparing multiple charts and verifying the chart pattern. Synchronize each chart position with the common vertical line. By changing the chart mode, you can also display the chart like a real trade.
How to set up
1. Scroll the chart of the target currency pair to the end in the past direction and download all the historical data of that currency pair. 2. Install this indicator in the main window of each chart. 3. Customize each parameter on the In
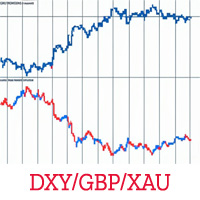
Overview Unlock a fresh perspective on your charts with the KS Invert Chart Pro Indicator – a powerful, zero-lag tool designed exclusively for MetaTrader 5. This innovative indicator inverts bars or candles mathematically (by multiplying price data by -1), revealing hidden patterns, contrarian opportunities, and inverse correlations that traditional views might miss. Perfect for advanced traders employing correlation strategies, multi-timeframe analysis, or hedge monitoring. Whether you're spott
FREE

The " YK Find Support And Resistance " indicator is a technical analysis tool used to identify key support and resistance levels on a price chart. Its features and functions are as follows:
1. Displays support and resistance levels using arrow lines and colored bands, with resistance in red and support in green.
2. Can be adjusted to calculate and display results from a specified timeframe using the forced_tf variable. If set to 0, it will use the current timeframe of the chart.
3. Uses th
FREE

The ATR Exit indicator uses the candle close + ATR value to draw trailing stop lines (orange under buys, magenta over sells) that advance with the trend until the trend changes direction. It uses a multiple of the Average True Range (ATR), subtracting it’s value from the close on buy, adding its value to the close on sell. Moreover, the trailing stop lines are generated to support the order’s trend direction (long or short): In an upward trend, the long trailing stop line (orange line under bu
FREE

Linear Regression Trending indicator analyzes price trends by plotting a linear regression channel based on user-defined parameters such as source (for example, close prices), channel length, and deviation multiplier.
How It Works: - The indicator calculates a linear regression line over the specified length, forming a channel with upper and lower boundaries offset by the deviation value. - It detects price breaks from the channel and optionally displays broken channel lines (in a customizable
FREE

This indicator calculates the volume profile and places labels that correspond to the VAH, VAL and POC levels, for each candle individually.
Indicator operation features The indicator works on the timeframes from M3 to MN, but it uses the history data of smaller periods: M1 - for periods from M3 to H1, M5 - for periods from H2 to H12, M30 - for the D1 period, H4 - for the W1 period, D1 - for the MN period. The color and location of the VAL, VAH and POC labels on the current candle are considere
FREE

The Volume Weighted Moving Average (VWMA) is calculated based on Prices and their related Volumes giving importance to those candles with more Volume. During periods of almost equal volume distributed along the observed period (commonly, in low volume periods) the VWMA will be graphically similar to a Simple Moving Average. Used along other moving averages a VWMA could be used as an alert, filter or whatever your imagination could think of...
HOW TO "READ" THIS INDICATOR As any Moving Average.
FREE

A indicator for detecting FVGS
I hope this helps you scalp and generate money for yourself
NOTE BETTER:
Trading is risky and you can lose all your funds , use the money you are willing to lose
NOTE BETTER:
Trading is risky and you can lose all your funds , use the money you are willing to lose
NOTE BETTER:
Trading is risky and you can lose all your funds , use the money you are willing to lose
FREE

Smart Finder Order Block The Ritz Smart Finder Order Block is a next-generation market structure recognition tool, designed to intelligently detect and highlight institutional footprints within price action. Built on a dynamic blend of order block theory, consolidation tracking, and adaptive volatility modeling, it provides traders with a sophisticated lens to anticipate high-probability market reactions. Core Capabilities Smart Order Block Detection Identifies both Bullish and Bearish Order Blo
FREE

This indicator can send alerts when a Heiken Ashi Smoothed color change occurs. Combined with your own rules and techniques, this indicator will allow you to create (or enhance) your own powerful system. Features Can send all types of alerts. Option to delay the alert one or more bars in order to confirm the color (trend) change. Input parameters Candle shift for alert: Default is 1. Setting it to 0 will alert you on color change on the current candle. This should be regarded as a pending (uncon
FREE

Please Good Review on this indicator, and i will maybe produce more indicators, Coming soon, EA base on this indicators
Linear Weighted Moving Average with HLCC applied price, and Bollinger bands with LWMA as applied price. Interesing Buy and Sell arrow based on this indicator , non Lag indicator as arrow will appear 1 candle after crossed...............
FREE

Volume & Liquidity Hunter – Scalping is a professional-grade scalping indicator designed to track real-time volume surges and liquidity zones across multiple timeframes. It combines smart money concepts with live trading conditions, making it an ideal tool for precision scalping.. Whether you’re trading reversals, breakouts, or fair value gaps — this indicator helps you identify where real buying and selling pressure is concentrated.
Real-Time Volume Detection Tracks tick volume spikes and com
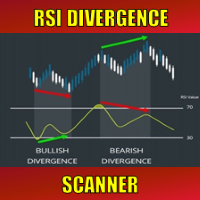
Special offer : ALL TOOLS , just $35 each! New tools will be $30 for the first week or the first 3 purchases ! Trading Tools Channel on MQL5 : Join my MQL5 channel to update the latest news from me In the dynamic financial markets, identifying trend reversal signals is essential for effective trading. The RSI Divergence Scanner is designed to help you detect RSI divergence signals across various currency pairs and timeframes accurately and efficiently. See more MT4 version at: R
FREE
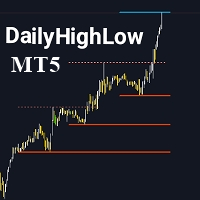
Please remember to rate the indicator to help me with visibility.
The DailyHighLow Indicator for MetaTrader 5 (MT5) provides a sophisticated tool for tracking daily price movements. Designed for traders who need clear, actionable insights into market highs and lows, this indicator automatically plots trend lines based on the highest and lowest prices over a customizable number of days. Key Features: Trend Lines Customization: Define colors, line styles, and widths for both broken and unbroken
FREE

Adaptive Hull MA Pro – Trend & Momentum Filter
We value your feedback and believe that your experience with the Hull Moving Average (HMA) is essential to us and other traders. Help us continue to improve and refine our product by sharing your thoughts and insights through a review!
The Hull Moving Average (HMA) Indicator – Your Key to Smoother Trends and Profitable Trades! Are you tired of lagging and choppy moving averages that hinder your ability to spot profitable trading opportunities? Loo
FREE
XAU Scalper MT5 MT4 Version An analytical tool for observing short-term price movements in gold pairs. The XAU Scalper Indicator provides buy and sell signals based on candle stability, RSI, and short-term momentum. It is designed to help traders identify potential entry points during brief market movements in XAU pairs. Features Candle Stability Index: Measures the proportion between candle body and wicks to assess price action reliability. RSI Index: Tracks relative strength to indicate
FREE

The indicator displays minimized charts of any symbol from any timeframe. The maximum number of displayed charts is 28. The charts can be located both in the main and bottom window. Two display modes: candles and bars. Amount of displayed data (bars and candles) and chart sizes are adjustable. To work with a mini chat, you must first put the desired indicator(s) on a regular chart, then save it as a template and apply a template for the mini chart via the appropriate parameter, for example, for
FREE

Neon Trend – Advanced Trend & Momentum System Professional Multi-Timeframe Analysis Tool Neon Trend is a comprehensive trading system designed to provide clarity in modern market environments. This tool combines a Normalized Momentum Oscillator with a high-performance Multi-Timeframe (MTF) Dashboard to identify market structures across various periods. Core Features Integrated MTF Dashboard: The built-in panel automatically scans M15, H1, and H4 timeframes in real-time. It provides an instant ma
FREE
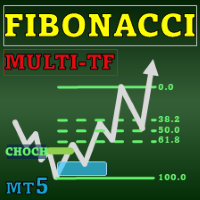
Special offer : ALL TOOLS , just $35 each! New tools will be $30 for the first week or the first 3 purchases ! Trading Tools Channel on MQL5 : Join my MQL5 channel to update the latest news from me The Fibonacci Confluence Toolkit Multi-Timeframe is an advanced technical analysis tool designed for professional traders, helping to identify potential price reversal zones by combining key market signals and patterns. With multi-timeframe display capabilities through the Timeframe Sele

BEHOLD!!!
One of the best Breakout Indicator of all time is here. Multi Breakout Pattern looks at the preceding candles and timeframes to help you recognize the breakouts in real time.
The In-built function of supply and demand can help you evaluate your take profits and Stop losses
SEE THE SCREENSHOTS TO WITNESS SOME OF THE BEST BREAKOUTS
INPUTS
MaxBarsback: The max bars to look back
Slow length 1: Period lookback
Slow length 2: Period lookback
Slow length 3: Period lookback
Slow
FREE

The Weis Waves RSJ Indicator sums up volumes in each wave. This is how we receive a bar chart of cumulative volumes of alternating waves. Namely the cumulative volume makes the Weis wave charts unique. It allows comparing the relation of the wave sequence characteristics, such as correspondence of the applied force (expressed in the volume) and received result (the price progress).
If you still have questions, please contact me by direct message: https://www.mql5.com/en/users/robsjunqueira/
FREE
N/B: All our product purchase comes with our free ‘’DAILY SCALPER EA’’ - bit.ly/4qlFLNh Whatsapp Developer for yours after successful purchase
HolyGrail Premium System: The Ultimate Supply & Demand Trading Solution
Finally Discover the "Unfair Advantage" That Professional Traders Have Been Using For Years
"I went from inconsistent guessing to precision trading with 83% accuracy once I started combining multi-timeframe confirmation with institutional order flow zones"
Note: After pur

The Ultimate Ichimoku MTF Dashboard: Your All-In-One Trading Edge Transform Your Trading with One Powerful Indicator Imagine having a professional trading assistant that monitors multiple timeframes simultaneously, identifies high-probability entries, warns you of potential reversals, and provides clear risk management guidance-all in one clean, intuitive display. That's exactly what the Ichimoku MTF Dashboard delivers. Why This Isn't Just Another In

Heiken Ashi Dynamic is an indicator for MetaTrader 5 that displays Heiken Ashi candles directly on your chart. You can choose between the classic mode or a smoothed mode, making color changes clearer and easier to follow. Green represents upward movement, red represents downward movement. The Classic mode reacts quickly to help spot early reversals, while the Smoothed mode makes long trends look cleaner and more continuous. Wicks are always preserved to keep the real market shape. Works on any
FREE

FREE Bookmap Volume Heatmap Indicator Overview The Bookmap Volume Heatmap is a custom MetaTrader 5 (MQL5) indicator that creates a visual heatmap of trading volume distribution across price levels, similar to professional trading platforms like Bookmap. It provides traders with a clear visualization of where significant trading activity has occurred within a specified price range. Key Features 1. Volume Distribution Visualization Creates color-coded rectangles on the chart representing vol
FREE

The Period separators indicator separates time periods, specified by user.
It supports all timeframes, greater or aliquot to current timeframe. In case of the incorect timeframe, the indicator modifies it to closest correct value. Additional bonus - the separation of non-standard time periods - MOON, MOON/2, MOON/4 (moon phases). The separators are plotted using the indicator's buffers. The indicator uses one graphic object for information about the progress and current bar properties. The graph
FREE

Experience the power of Demark Trends Indicator for comprehensive trend analysis and trading insights. Demark indicators are renowned for their effectiveness in assessing market trends and exhaustion points. Our Demark Trends Indicator takes this expertise to the next level, automatically drawing precise trendlines on your charts. With customizable parameters, including the number of candles in calculations, alarm settings, and line colors, you have full control over your analysis. Whether you'
FREE

The MACD 2 Line Indicator is a powerful, upgraded version of the classic Moving Average Convergence Divergence (MACD) indicator.
This tool is the embodiment of versatility and functionality, capable of delivering comprehensive market insights to both beginner and advanced traders. The MACD 2 Line Indicator for MQL4 offers a dynamic perspective of market momentum and direction, through clear, visually compelling charts and real-time analysis.
Metatrader4 Version | All Products | Contact
FREE
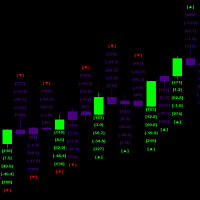
This indicator helps identify the start of significant market movements by analyzing candle patterns and their relative price action strength
the indicator runs multiple simultaneous calculation every millisecond and it also does a triple set verification historically in order to calculate future probabilities the historical processing has to be completed before new Candlestick can be processed as one total set out of the total available history from the starting date and time in order to
FREE

INFOPad is an information panel that creates information on the selected currency pair in the MetaTrader 5 terminal. There are 5 functions of this indicator: Shows the main and main information on the selected symbol: Ask BID, Spread, Stop Level, Swap, Tick value, Commission prices; Shows the future targets of SL target and TP Target (The number of points of the established stop loss and take profit, the dollar amount); It shows the profit received for the periods: Today, Week, Month, Year, Tot
FREE

[ My Channel ] , [ My Products ] The Lorentzian Distance Classifier is a machine-learning-based trading indicator that uses Lorentz distance as its core metric within the Approximate Nearest Neighbors (ANN) framework. Instead of relying on traditional Euclidean distance, it treats financial price action as if it occurs in a “distorted” price–time space (similar to how massive objects bend spacetime in relativity). This approach makes the classifier significantly more robust to market noise, outl

This Mt5 Indicator Signals when there is two opposite direction bars engulfed by current bar. has a recent Exponential Moving Average Cross and past bar was oversold/bought Expert Advisor Available in Comments Free Version Here : https://www.mql5.com/en/market/product/110114?source=Site  ; Full Alerts for mt5 terminal , phone , email, print to file, print to journal Buy Signal ( blue line ) Past ema cross ( set at 30 bars back ) Past bar rsi is oversold ( level 40 ) Engulfing bar closes
FREE
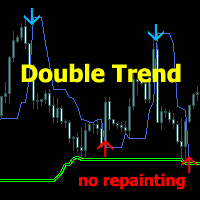
Trading System Double Trend MT5 - an independent trading system consisting of several indicators. Determines the direction of the general trend and gives signals in the direction of price movement.
Can be used for scalping, intraday or weekly trading.
Features
Works on any time frames and trading instruments (forex, cryptocurrencies, metals, stocks, indices.) Simple visual reading of information that does not load the chart The indicator does not repaint and does not complete signals Works onl

Volume Profile Indicator – User Guide Description: The Volume Profile Indicator is a powerful tool designed for MetaTrader 5. It visualizes market activity using volume distribution across price levels, showing: Histogram of volume at each price bin POC (Point of Control) – the price with the highest traded volume Value Area – the range covering a configurable percentage of volume (e.g. 70%) Support levels: Min, Max, and Pivot Average tick size for BUY and SELL movements Inputs and Parameters:
FREE

Purpose of the Inside Bar and Outside Bar Breakout Scanner Indicator: The Inside Bar & Outside Bar Breakout Scanner is an advanced dashboard designed to scan multiple instruments and timeframes simultaneously. Its primary function is to identify two powerful candlestick patterns—the Inside Bar (IB) and the Outside Bar (OB) —and then to detect and classify breakouts from these formations. The indicator presents its findings in a clean, organized table, signaling potential trend continuation o

Stop Loss Pro – Precision Risk Management for Every Trader
Stop Loss Pro is a powerful, free MetaTrader indicator designed to take the guesswork out of risk management. Built on advanced market structure analysis, it automatically identifies and displays the most reliable stop‑loss levels directly on your chart. With this tool, traders can protect their trades with confidence, knowing that each suggested level is backed by a blend of technical logic, volume dynamics, and volatility filters. Ho
FREE
MetaTrader Market - trading robots and technical indicators for traders are available right in your trading terminal.
The MQL5.community payment system is available to all registered users of the MQL5.com site for transactions on MetaTrader Services. You can deposit and withdraw money using WebMoney, PayPal or a bank card.
You are missing trading opportunities:
- Free trading apps
- Over 8,000 signals for copying
- Economic news for exploring financial markets
Registration
Log in
If you do not have an account, please register
Allow the use of cookies to log in to the MQL5.com website.
Please enable the necessary setting in your browser, otherwise you will not be able to log in.