Watch the Market tutorial videos on YouTube
How to buy а trading robot or an indicator
Run your EA on
virtual hosting
virtual hosting
Test аn indicator/trading robot before buying
Want to earn in the Market?
How to present a product for a sell-through
Technical Indicators for MetaTrader 5 - 8
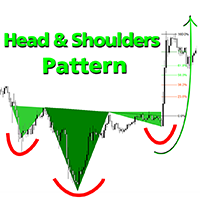
Welcome price: 35 $
Pattern Head and Shoulders is ideal for traders seeking reliable pattern recognition, including both bullish and bearish Head and Shoulders formations, with integrated Fibonacci levels, neckline break detection, and early prediction techniques. A powerful MT5 tool for those who value technical analysis, and precision in identifying chart structures and trend reversals.
Dual Detection Methods
Method 1 – Classic Pattern Detection Detects standard Head and Shoulders pattern

Was: $99 Now: $49 Blahtech Daily Range indicator displays the average daily range alongside the individual session ranges. Using the daily open price as a reference the indicator shows fixed range and dynamic range targets as lines on the charts. These lines clearly show when the average range has been exhausted. Daily and session ranges can be useful for confirming entries or setting targets and is an excellent odds enhancer for many trading systems. Links [ Documentation | Install | U

Unlock key market insights with automated support and resistance lines Tired of plotting support and resistance lines? This is a multi-timeframe indicator that detects and plots supports and resistance lines in the chart with the same precision as a human eye would. As price levels are tested over time and its importance increases, the lines become thicker and darker, making price leves easy to glance and evaluate. [ Installation Guide | Update Guide | Troubleshooting | FAQ | All Products ] Boos
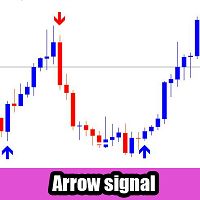
This indicator is designed to support traders by providing non-repainting arrow signals combined with dynamic period adjustment technology .
Its focus is on consistency, clarity, and flexibility, making it suitable for different timeframes and trading styles. Once a signal is generated, it does not repaint, drift, or disappear, ensuring that historical chart signals remain identical to real-time usage.
Recommendations Best Pairs: EURUSD, AUDUSD, XAUUSD, and similar liquid instruments Multi-Curre

TrueStrength Oscillator v1.00 What you see on the chart: Thick blue line : main TSI, follows market momentum Thick red line ️: signal line (perfect for spotting crossovers) Thin blue bars : from zero line up to the blue line Dotted gray line in the middle : zero level, easy to spot direction changes Why it's practical every day: Scale always fixed (-0.000001 to +0.000001), no surprises Zero repaint : calculated only on closed bars Works on all timeframes (M1 to MN1)

Indicator for determining flat and trend.
If the price is below any of the two histograms and two lines (red and blue), this is a sell zone.
When purchasing this version of the indicator, MT4 version for one real and one demo account - as a gift (to receive, write me a private message)!
If the price is above any of the two histograms and two lines (red and blue), this is a buy zone. MT4 version: https://www.mql5.com/ru/market/product/3793 If the price is between two lines or in the zone of

DRX Smart Risk | Professional Trade Planner Stop guessing. Start planning with precision. Drawing Fibonacci lines or calculating lot sizes manually is slow and error-prone. The DRX Smart Risk tool brings the intuitive workflow of professional charting platforms (like TradingView) directly into your MetaTrader 5 terminal—but faster, smarter, and fully integrated. The Problem: Standard MT5 lines are clunky. You struggle to grab them, they disappear when you change timeframes, and you have to calcu
FREE

The "Sniper MACD" indicator is an improved version of the classic MACD, designed to enhance trading efficiency. It features additional filtering and multiple smoothing methods, allowing for more accurate signals. Features: Additional Filtering: Improves signal quality, reducing the likelihood of false triggers and increasing forecast accuracy. Multiple Smoothing: Reduces market noise, providing more reliable signals. Volume Integration: The built-in volume indicator helps assess market conditio
FREE

It is a MetaTrader 5 integrated drawing tool inspired on the "Pointofix" software. You can paint, make annotations and drawings on the chart in real time. It works in multiple timeframes, that is, the drawings can be visualized in different timeframes. The drawings are also saved in files and can be restored even on MetaTrader restarting.
Simple and Pratical
Chart Pen is designed as simple, beautiful and innovative way to create and manage all your chart analysis. There is no existing drawing
FREE

Pips Hunter PRO has been developed over several years and is an improved version of its predecessor. This powerful indicator analyzes the market and price history to generate buy and sell entries. For the calculation of these entries it uses different indicators that work together as well as a complex statistical logarithm that filters out less favorable entries and eliminates them / MT4 version .
Features No repainting
This indicator does not change its values when new data arrives
No l
FREE
The Omega Trend Indicator is an advanced tool that has been specifically designed to detect market trends early, and follow them efficiently. The indicator draws two lines. The main (thicker) Trend Line represents the presumed lower or upper volatility limits of the current market trend. A break in the main Trend Line indicates a potential reversal or shift in the movement of the trend. The Trend Line also indicates the best point to place a stop loss order. In Omega Trend Indicator, the Trend L
FREE

### Best Order Block Detector Indicator for MT5
The Order Block Detector is a technical analysis indicator designed for MetaTrader 5 (MT5). It identifies potential order blocks (OBs) in the market, which are key price levels where significant buying or selling activity has occurred, often acting as support or resistance zones. These blocks are detected based on volume pivots and market structure swings, helping traders spot areas of institutional interest for potential reversals or continuation
FREE

This indicator plots the volume profile by Price on the chart
There are 5 ways to view it:
By Total Volume Traded (Premium Version); Volume Ticks(Forex) Separated by Buyers and Sellers (Premium Version); Buyers Only (Premium Version); Sellers Only (Premium Version); Business balance (Buyers - Sellers) (Premium Version); .
It is possible to select how many days the profiles will be calculated.( Premium Version)
On the current day it recalculates the histogram data for each new candlestick.
FREE

The SuperTrend Strategy is a widely-used technical indicator based on the Average True Range (ATR), primarily employed as a trailing stop tool to identify prevailing market trends. The indicator is designed for ease of use while providing reliable insights into the current market trend. It operates based on two key parameters: the period and the multiplier . By default, it uses a period of 15 for the ATR calculation and a multiplier of 3 . The Average True Range (ATR) plays a crucial role in th
FREE

This is the Cumulative Volume Delta (CVD) , it's an indicator that calculates the long and short volumes plotting it then as a line on the chart, the most efficient way to use this indicator is by comparing the CVD line to the current chart and looking at the Divergence beetween the two of them, so that you can identify fake-outs and liquidty sweeps. for example in the picture that i put below you can see that the price has made a lower low but the CVD didn't, that means the volumes didn't suppo
FREE
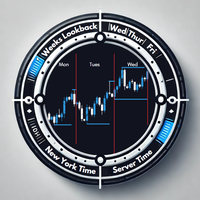
Overview The Daily Session Separator indicator is a powerful tool designed to enhance your trading experience by clearly marking daily trading sessions on your chart. It helps traders visualize daily boundaries, session highs and lows, and essential day-specific data to make informed decisions. With its seamless integration into any chart and dynamic adaptability, this indicator is a must-have for traders who rely on precision and clarity. Key Features Daily Session Separators Automatically adds
FREE

The indicator identifies divergence by analyzing the slopes of lines connecting price and MACD histogram peaks or troughs. Bullish Divergence (Convergence): Occurs when the lines connecting MACD troughs and corresponding price troughs have opposite slopes and are converging. Bearish Divergence: Occurs when the lines connecting MACD peaks and corresponding price peaks have opposite slopes and are diverging. When a divergence signal is detected, the indicator marks the chart with dots at the pric

Rental/Lifetime Package Options and Privileges
Rent Monthly Six Months Yearly/Lifetime Weis Wave with Speed with Alert+Speed Index x x x Manual x x x Quick Set up Video x x x Blog x x x Lifetime Updates x x x Setup and Training Material
x x Discord Access Channel "The SI traders" x Rectangle Break Alert Tool x
How to trade with it: http://www.tradethevolumewaves.com ** If you purchase please contact me to setup your : Training Room and complete manual access.
Wei

indikator Visual Panel Strengt MultiTimeframe : English Description Visual Panel Strength MultiTimeframe is a real-time trend strength indicator panel that displays the buy/sell pressure across multiple selected timeframes—such as M1, M3, and M5. The indicator utilizes ATR-based volatility analysis and a smoothed trend algorithm to calculate trend signals. Visually presented as a horizontal bar chart at the corner of your main chart, this tool helps traders instantly identify the prevailing

A top-quality implementation of the famous Super Trend indicator, which needs no introduction. It is completely loyal to the original algorithm, and implements many other useful features such as a multi-timeframe dashboard. [ Installation Guide | Update Guide | Troubleshooting | FAQ | All Products ] Easy to trade It implements alerts of all kinds It implements a multi-timeframe dashboard It is non-repainting and non-backpainting Input Parameters
ATR Period - This is the average true range peri
FREE

Institutional Tick Engine Lite: Tick Velocity & Reversal Tool Institutional Tick Engine Lite is a technical indicator designed to analyze market velocity and micro-structure logic using raw tick data. As the entry-level version of the professional market analysis suite, it processes real-time tick data to provide metrics for scalping and day trading, offering an alternative to traditional lagging indicators. Included Features Tick Velocity Monitor: Real-time histogram displaying "Ticks Per Secon
FREE
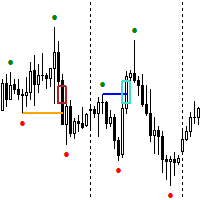
YouTube Channel: https://www.youtube.com/@trenddaytrader FREE EA for GOLD , Anticipation can be found here: https://www.mql5.com/en/market/product/123143
The Expert Advisor for this Indicator can be found here: https://www.mql5.com/en/market/product/115476 The Break of Structure (BoS) and Change of Character indicator with Fair Value Gap (FVG) filter is a specialized tool designed to enhance trading strategies by pinpointing high-probability trading opportunities on price charts. By
FREE
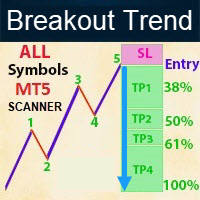
Contact me for instruction, any questions! - Lifetime update free - Non-repaint - I just sell my products in Elif Kaya Profile, any other websites are stolen old versions, So no any new updates or support. Introduction Breakout Trend Scanner indicator works based on the Elliott Wave in technical analysis describes price movements in the financial market that are related to changes in trader sentiment and psychology and finds end of movement and breakout trend. The Elliott Wave pattern that is f
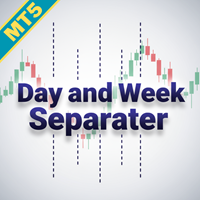
Streamline your trading analysis with the Day and Week Separator MT5, an intuitive tool designed to plot customizable daily and weekly separator lines, perfect for traders navigating broker time zone differences. Widely appreciated in trading communities like Forex Factory and Reddit’s r/Forex for its simplicity and effectiveness, this indicator addresses the common challenge of aligning chart timeframes with local or market-specific times, as highlighted in discussions on platforms like Invest
FREE

Integrated Dashboard Scanner – Version 4.00 The Ultimate Market Command Center just got smarter. Now with Programmable Logic Presets. The Integrated Dashboard Scanner (IDS) monitors multiple symbols and timeframes from a single, DPI-aware panel. Version 4.00 introduces a revolutionary Preset Editor , allowing you to combine signals from different modules into complex, custom strategies without writing a single line of code. NEW IN VERSION 4.00: Filter Presets & Logic Editor Stop scanning for

This is Heiken Ashi smoothed version, where you can choose on what type smoothness you want to make your strategy base. You can choose between EMA or MA, on the period you want. And you can choose colors.
Definition:
The Heikin-Ashi technique averages price data to create a Japanese candlestick chart that filters out market noise. Heikin-Ashi charts, developed by Munehisa Homma in the 1700s, share some characteristics with standard candlestick charts but differ based on the values used to cre
FREE

MA3 Trend MT5 - is the good trend indicator on three MAs . Benefits of the indicator: The indicator produces signals with high accuracy.
The confirmed signal of the indicator does not disappear and is not redrawn.
You can trade on the MetaTrader 5 trading platform of any broker.
You can trade any assets (currencies, metals, cryptocurrencies, stocks, indices etc.).
You can trade on any timeframes (M5-M15 scalping and day trading / M30-H1 medium-term trading / H4-D1 long-term trading). Indi
FREE
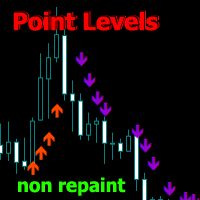
Point Directions MT5 - An indicator showing point levels of support and resistance when the price moves. The arrows show price bounces in the indicated directions.
The arrows are not redrawn, they are formed on the current candle. Works on all time frames and trading instruments. There are several types of alerts.
Has advanced settings to customize signals for any chart. Can be configured to trade with the trend and corrections.
For drawing arrows, there are 2 types of moving averages and an in

Are you looking for a signal indicator that actually works? Meet Phoenix Quantum Signals , the professional Price Action tool designed for traders who demand precision, not guesswork.
Unlike traditional indicators that "repaint" (change their past signals to look good), Phoenix Quantum uses a proprietary "Smart Swing Breakout" logic. It identifies confirmed Market Structure points and only generates a signal when a true breakout occurs.
Why Phoenix Quantum? The #1 problem with arrow indicator

Gravity Bands
A powerful all-in-one market structure, momentum, and trend framework for any intraday trader. Pay attention only 10 copies are sold at 49 USD! Next Price 69 USD (only 3 copies left!!!) With the indicator you get a full mechanical trading plan and free EA code to automate your trading! Contact us after you have purchased the indicator! The Gravity Bands Indicator is designed for traders who want clarity — not noise.
Whether you scalp or day-trade, this tool gives you a clean v

Welcome to the EPo-CreW Forex Super ORB-H4 Indicator! This guide will teach you how to use this powerful tool to identify high-probability trading opportunities based on the market's first 4-hour opening range. Whether you're a beginner or experienced trader, this system will help you trade with more confidence and consistency. THIS IS A DEMO PRODUCT, IT WILL EXPIRE AFTER 30 DAYS FROM THE DAY OF INSTALLATION. Full version available here: https://www.mql5.com/en/market/product/160926?source=Site
FREE
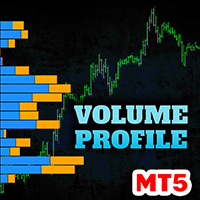
Contact me after payment to send you the user manual PDF file. Download the MT4 version here. Volume Profile Indicator A functional and useful tool that can improve your trading plan.
This indicator calculates volume in price levels(typical volume indicator shows only candle volumes).
With the volume of price levels, you can identify important areas that have the potential to reverse. You can also see the volume of support and resistance levels and decide on them.
Using volume profiles along

Improved MACD Histogram (Momentum-Based) The default MACD in MetaTrader 5 displays histogram bars using the MACD line itself ,
which may react slowly during rapid momentum changes or ranging markets. This version follows the classic MACD histogram definition: Histogram = MACD − Signal This approach focuses on momentum acceleration and deceleration ,
often revealing changes in market strength before price reversals become obvious. Important notes: This is not a standalone trading system It does
FREE
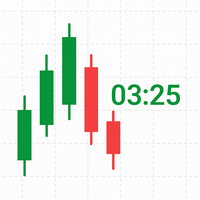
TimeLeftCandle – Countdown Clock for Candles in MT5 Overview
TimeLeftCandle is an indicator for MetaTrader 5 that displays in real time the remaining time until the current chart candle closes. Its design is minimalist, clear, and movable, adapting to any type of chart and trading style. Ideal for traders who need to precisely track candle closing times and make timely decisions. Main Advantages Clear and precise display: A digital-style counter to know exactly how much time is left before the
FREE

Bar Countdown is a simple indicator for MetaTrader 5 that shows the time remaining of the each candle. It can be placed in any corner of the chart or near of the price close and it'll help you to know
if the current candle is ending. Choose the counter format between HR:MIN:SEC and MIN:SEC It is so easy to use, configure the color, size and counter position on the chart and that's it!!! The Countdown starts now!
Updates: 2021/02/28; v1.0: Initial release 2021/03/16; v1.1: Minor code changes
FREE

Introducing Indicator for PainX and GainX Indices Traders on Weltrade Get ready to experience the power of trading with our indicator, specifically designed for Weltrade broker's PainX and GainX Indices. Advanced Strategies for Unbeatable Insights Our indicator employs sophisticated strategies to analyze market trends, pinpointing optimal entry and exit points. Optimized for Maximum Performance To ensure optimal results, our indicator is carefully calibrated for 5-minute timeframe charts on

OBV MACD
Calculating MACD based on OBV data Features
3 outputs: MACD & Signal & Histogram 4 Colored Histogram Smoothing factor show/hide option for MACD & Signal lines Description
Among the few indicators developed for working with volume data, OBV (On Balance Volume) is the simplest yet most informative one. Its logic is straightforward: when the closing price is above the previous close, today's volume is added to the previous OBV; conversely, when the closing price is below the previous close
FREE
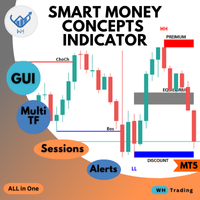
Welcome to the ultimate Smart Money Concepts indicator ,, this indicator is All-in-One package the only thing you need to empower
all the Smart Money Concepts in one place with interactive advanced gui panel with all the features and customization you need. MT4 Version : WH SMC Indicator MT4 *This Price For Limited Number of Copies.
Features: Main Section: User-Friendly Panel (GUI): Designed for traders of all experience levels, the indicator integrates seamlessly into your MT5 platform
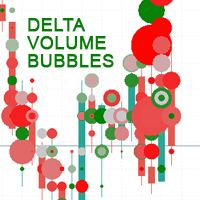
Delta Volume Bubbles is an advanced MetaTrader 5 indicator designed to visually display buy and sell pressure through dynamic, colored bubbles plotted directly on the price chart.
It calculates the net volume delta (difference between buy and sell volume) and represents it as bubbles of different sizes and colors giving traders a clear, intuitive picture of order flow activity. This indicator provides a visual form of order flow analysis , allowing traders to interpret market pressure even with
FREE

Ichimoku Trend Alert is the Ichimoku Kinko Hyo indicator with Alerts and signal filters.
Ichimoku Trend Alert features: Optional check of Ichimoku cloud, Tenkan sen(Conversion Line), Kijun sen(Base Line), Senkou span A, Senkou span B, and Chikou span relative to price, and more. Popup, email, and phone notification alerts for selected symbols and timeframes.
There are 9 classic Ichimoku trend filters you can enable/disable in settings: Price/Cloud Order: Checks the price position relative to
FREE

Discover the MSG Method: Master the Major Session Gap for Consistent Forex Profits Unlock the power of the MSG Method – our proprietary Major Session Gap strategy designed to capture high-probability trades during key market session transitions. Developed by the T1 FX Team, this innovative approach leverages algorithmic precision to identify and exploit price gaps between major trading sessions (London, New York, and Tokyo). Why Choose the MSG Method? High-Probability Setups : Focuses on session

GoldStructure Pro – XAUUSD Structure & Volatility Analysis Gold requires a unique approach compared to other currency pairs.
Most losses on XAUUSD occur from trading during low-volatility ranges or entering during false breakouts. GoldStructure Pro is a decision-support system built for Gold traders who want to avoid low-probability entries and focus on alignment between volatility and market structure. The Challenge with Gold Trading Traders often experience accumulated small losses during com

Watermark Centralized
Adds a watermark centered with the asset name and chosen period.
It is possible to override the font type, font size, font color and separator character.
The watermark is positioned behind the candles, not disturbing the visualization.
It has automatic re-centering if the window is resized.
Hope this indicator helps you, good trading ;)
FREE
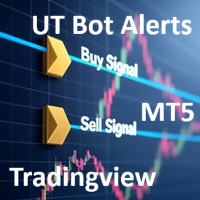
UT Bot with Alerts The UT Bot Alerts Indicator for MetaTrader 5 is a versatile trading tool that generates buy and sell signals based on ATR-based trailing stop logic. It displays signals with arrows, draws an entry price line, and includes a candle countdown timer. The indicator offers customizable alerts (pop-up, email, push notifications) and a text label showing signal details. Users can adjust ATR sensitivity, label positions, and timer settings, making it suitable for various markets and
FREE

CATALYST Indicator Version: 1.03
Author: KWAKU BONDZIE GHARTEY
Released: 1st Feb @ 2025 Description The CATALYST Indicator is not just another tool on your chart—it is a revolutionary, next-generation technical analysis system engineered to transform your trading experience. Designed with cutting-edge algorithms and multi-timeframe analysis capabilities, the CATALYST Indicator delivers lightning-fast, pinpoint signals that have redefined performance analysis for traders across all major market
FREE

This indicator implements the QQE (Qualitative Quantitative Estimation) algorithm for MetaTrader 5, incorporating volatility bands logic. The indicator combines the Relative Strength Index (RSI) with Average True Range (ATR) to determine market direction. The histogram changes color based on the interaction between the RSI momentum and the calculated volatility channel. Technical Logic: The algorithm smoothes the RSI values and constructs upper and lower bands. When the smoothed RSI breaks these
FREE

CDV Candle Engine Pro is a MetaTrader 5 indicator designed to visualize Cumulative Delta Volume (CDV) directly on the price chart. It helps traders read market pressure more clearly by showing the balance between buying and selling activity in a clean, customizable layout. If you trade on MetaTrader 4, the MT4 edition is available here: CDV Candle Engine Pro MT4 Public channel: CLICK HERE
Main Features CDV candle visualization on the main chart for easy reading in real time. Optional subwind
Expert Advisor Version If you prefer automated trading instead of manual signals, you can find the Expert Advisor version of this indicator here: https://www.mql5.com/en/market/product/148310
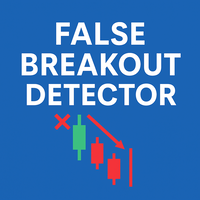
False Breakout Detector is an indicator designed to identify situations where the price temporarily breaks a recent support or resistance level but quickly returns to the previous range. These false breakouts can be useful for discretionary analysis or contrarian trading strategies. Main Features: Automat
FREE
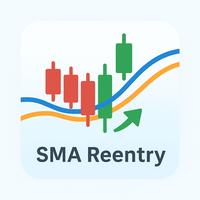
What is SMA Reentry SMA Reentry is a professional indicator that signals reentry points in the direction of the trend using two simple moving averages (SMA): one fast and one slow. The indicator clearly shows when the price re-enters above or below the fast moving average, in the presence of a trend defined by the slow SMA. It is the ideal tool for those seeking clear pullback, breakout, and trend reentry signals. How It Works Identifies the main trend through the crossover of the fast and slow
FREE

Spike Trap is a simple but powerful tool that identifies sharp market spikes and waits for price pullbacks to highlight high-probability entry and exit zones. By combining volatility detection with smart retracement logic, it helps traders capitalize on fast price moves with precision and reduced risk. Ideal for scalping or short-term trading in volatile markets. Spike Trap can be used to trade synthetic indices such as Boom and Crash offered by Deriv Broker as well as Pain and Gain indices offe

Market Profile 3 MetaTrader 5 indicator version 4.70— is a classic Market Profile implementation that can show the price density over time, outlining the most important price levels, value area, and control value of a given trading session. This indicator can be attached to timeframes between M1 and D1 and will show the Market Profile for daily, weekly, monthly, or even intraday sessions. Lower timeframes offer higher precision. Higher timeframes are recommended for better visibility. It is als
FREE

Smart Elliott Wave is a sophisticated technical indicator that automatically detects Elliott Wave patterns with complete 5-wave impulse structures (1-2-3-4-5) and validates ABC corrective patterns for high-probability trading setups. This indicator eliminates manual wave counting and provides clear visual signals with confidence scoring. Key Features Automatic Wave Detection Detects complete Elliott Wave 5-wave impulse patterns automatically Identifies ABC corrective patterns for optimal entry p
FREE

FOR CRASH 500 ONLY!! MT5
*This is a smooth heiken ashi setup meant to be used on CRASH 500 in combination with other indicators. *You are welcome to test it on other markets aswell. *I will be posting other indicators aswell to help with trading the crash 500 market. *You can use this to help smooth out price if you do struggle with reading the charts as is. * Just note heiken ashi doesnt represent real price action only smoothes it out for ease of read.
FREE

The Volume Weighted Average Price is similar to a moving average, except volume is included to weight the average price over a period. Volume-Weighted Average Price [VWAP] is a dynamic, weighted average designed to more accurately reflect a security’s true average price over a given period . Mathematically, VWAP is the summation of money (i.e., Volume x Price) transacted divided by the total volume over any time horizon, typically from market open to market close.
VWAP reflects the capitali
FREE

The indicator that shows the countdown to the change of candles is equipped with an alert when the bar changes (the alert is not active if installed on the M1 time frame). Displays seconds if installed in time frame M1, displays minutes and seconds if installed in time frame above M1, and displays hours and minutes if installed in time frame h1 and above. The time displayed is calculated based on the running time.
FREE

See "What's New" for a breakdown of the newest functions. v1.4 was just a tidy up, nothing special
//+---------------------------------------------------------------------------------------------------------------+ I've created this because I needed a customisable fractal indicator. It also checks for decreasing volumes to have some kind of confirmation. Breakdown below: Overview This indicator is designed to help identify key swing points in the market by analyzing price action and volume dyna
FREE

This indicator allows to display Renko charts in the indicator window. Renko charts show only price movements that are bigger than the specified box size. It helps to eliminate noise and allows to focus on main trends.
Time is not a factor here. Only price movements are taken into account. That's why Renko chart is not synchronized with the main chart it is attached to. Indicator works in two modes: CLOSE - only close prices are taken into account while building the chart HIGH_LOW - only high/l
FREE
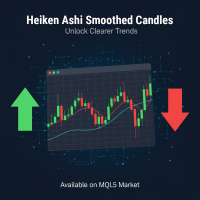
Heiken Ashi Smoothed Indicator for MT5 Advanced Heiken Ashi with smoothing filter. Reduces noise, eliminates false signals, and identifies trends early. Ideal for Forex, indices, stocks, and crypto on H1-D1. How It Works and How It Is Smoothed The traditional Heiken Ashi calculates candles by averaging open, close, high, and low values from previous periods, which already reduces the impact of minor fluctuations. However, the Heiken Ashi Smoothed takes this approach further by applying an addit
FREE

Introducing Quantum Breakout PRO , the groundbreaking MQL5 Indicator that's transforming the way you trade Breakout Zones! Developed by a team of experienced traders with trading experience of over 13 years, Quantum Breakout PRO is designed to propel your trading journey to new heights with its innovative and dynamic breakout zone strategy.
Quantum Breakout Indicator will give you signal arrows on breakout zones with 5 profit target zones and stop loss suggestion based on the breakout b
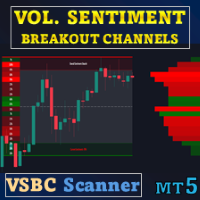
Special offer : ALL TOOLS , just $35 each! New tools will be $30 for the first week or the first 3 purchases ! Trading Tools Channel on MQL5 : Join my MQL5 channel to update the latest news from me Volume Sentiment Breakout Channels is an indicator that visualizes breakout zones based on volume sentiment inside dynamic price channels. Instead of looking only at pure technical breakouts, it focuses on how buy/sell volume is distributed within consolidation areas, thereby expressin
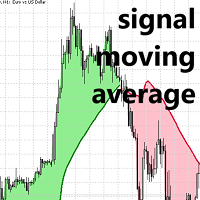
Signal Moving Average Lux Algo for MT5
Discover a unique moving average indicator designed specifically for signal line use in moving average crossover systems. This advanced tool differentiates itself by diverging from price in ranging markets, while closely mirroring a standard moving average in trending markets. This characteristic helps traders avoid unnecessary noise and potential over-trading due to market fluctuations. The moving average will diverge from the price during ranging markets
FREE

Was: $69 Now: $49 Blahtech VWAP - Volume Weighted Average Price (VWAP) is the ratio of price to total volume. It provides an average price over a specified time interval. Links [ Install | Update | Documentation ] Feature Highlights
Configurable VWAP Line Sessions, intervals, anchored or continuous Previous day settlement line Standard Deviation bands Alerts at bar close or real time Automatic Broker or Tick volumes Significantly reduced CPU usage
Input Parameters
Expert Advisor Mo

Royal Scalping Indicator is an advanced price adaptive indicator designed to generate high-quality trading signals. Built-in multi-timeframe and multi-currency capabilities make it even more powerful to have configurations based on different symbols and timeframes. This indicator is perfect for scalp trades as well as swing trades. Royal Scalping is not just an indicator, but a trading strategy itself. Features Price Adaptive Trend Detector Algorithm Multi-Timeframe and Multi-Currency Trend Low

General Description This indicator is an enhanced version of the classic Donchian Channel , upgraded with practical trading functions.
In addition to the standard three lines (high, low, and middle), the system detects breakouts and displays them visually with arrows on the chart, showing only the line opposite to the current trend direction for a cleaner view. The indicator includes: Visual signals : colored arrows on breakout Automatic notifications : popup, push, and email RSI filter : to val
FREE

The Simple ICT Concepts Indicator is a powerful tool designed to help traders apply the principles of the Inner Circle Trader (ICT) methodology. This indicator focuses on identifying key zones such as liquidity levels, support and resistance, and market structure, making it an invaluable asset for price action and smart money concept traders.
Key Features Market Structure: Market structure labels are constructed from price breaking a prior swing point. This allows a user to determine the curren

Simplify your trading experience with Trend Signals Professional indicator. Easy trend recognition. Precise market enter and exit signals. Bollinger Bands trend confirmation support. ATR-based trend confirmation support. (By default this option is OFF to keep interface clean. You can turn it ON in indicator settings.) Easy to spot flat market conditions with ATR-based trend confirmation lines. Highly customizable settings. Fast and responsive. Note: Do not confuse ATR-based trend confirmation
FREE

Phoenix Auto Fibonacci Monitor (MT5)
Professional Fibonacci intelligence and swing analysis tool for MetaTrader 5. Automatically detects dominant market swings and delivers advanced Fibonacci retracement insight through a real-time visual dashboard.
Overview
Phoenix Auto Fibonacci Monitor automatically identifies major market swings using higher-timeframe pivot and ATR validation, then plots intelligent Fibonacci retracement levels directly on the chart. The system continuously tracks the 0.
FREE

Fractal Model Indicator for Metatrader , meticulously crafted around the renowned Fractal Model by TTrades. This powerful tool empowers traders to navigate price action with precision, leveraging multi-timeframe analysis to anticipate momentum shifts, swing formations, and trend continuations. Designed for MetaTrader , the Fractal Model Indicator combines advanced algorithmic insights with customizable features, making it an essential addition for traders seeking to capitalize on expansive mar

This indicator shows the TLH and TLL and some trendlines that allow us to estimate the trend of market. It also shows the values of the angles of the lines in percentage in points (pip) , the standard deviation, and the trend of each line, and when it breaks the lines of support and resistance (TLH and TLL). And finally, it also shows the points identified as supports and resistances through the fractal algorithm in the graph. The high and low trend lines are supported by the highs and lows, th
FREE

Peak Trough Analysis is the great tool to detect peaks and troughs in your chart. Peak Trough Analysis tool can use three different peaks and troughs detection algorithm. The three algorithm include the orignal Fractals Indicator by Bill Williams, the Modified Fractals indicator and ZigZag indicator. You can use this peak and trough analysis tool to detect the price pattern made up from Equilibrium Fractal-Wave process. For further usage, there are good guide line on how to use this peak trough
FREE
The MetaTrader Market is a simple and convenient site where developers can sell their trading applications.
We will help you post your product and explain you how to prepare your product description for the Market. All applications on the Market are encryption-protected and can only be run on a buyer's computer. Illegal copying is impossible.
You are missing trading opportunities:
- Free trading apps
- Over 8,000 signals for copying
- Economic news for exploring financial markets
Registration
Log in
If you do not have an account, please register
Allow the use of cookies to log in to the MQL5.com website.
Please enable the necessary setting in your browser, otherwise you will not be able to log in.