Watch the Market tutorial videos on YouTube
How to buy а trading robot or an indicator
Run your EA on
virtual hosting
virtual hosting
Test аn indicator/trading robot before buying
Want to earn in the Market?
How to present a product for a sell-through
Technical Indicators for MetaTrader 5 - 33

Definition : VPO is a Volume Price Opportunity. Instead of using bars or candles with an Open, High, Low, and Close price, each "bar" in a Market Profile is represented by horizontal bars against the price It is called Market Profile terminology.
In other words volume-price-opportunity (VPO) profiles are histograms of how many volumes were traded at each price within the span of the profile.
By using a VPO chart, you are able to analyze the amount of trading activity, based on volume, for each
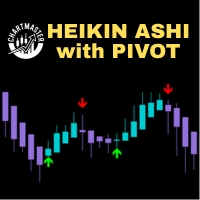
ChartMaster Heikin Ashi with Pivot Indicator for MT5 Take your trading to the next level with ChartMaster Heikin Ashi with Pivot Indicator , a powerful tool that combines the clarity of Heikin Ashi candles with advanced pivot-point analysis. This indicator is designed for traders who want to identify market trends, reversals, and key support/resistance zones with precision. Key Features: Heikin Ashi Visualization – Smooths out market noise for cleaner trend identification.
Automatic Pivot
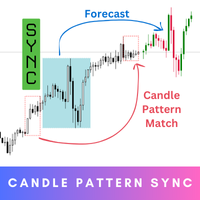
Candle Pattern Sync is your ultimate tool for precision and insight in trading. Step into the future of trading with this innovative indicator that’s designed to help you understand market behavior by analyzing historical patterns and giving you an idea of what might come next. While the forecasts provide valuable probabilities based on history, they’re not guarantees – think of them as a powerful guide to inform your decisions, not a definitive answer. MT4 Version - https://www.mql5.com/en/m

This indicator is based on Mr. Mark Fisher's ACD strategy, based on the book "The Logical Trader."
- OR lines - A lines - C lines - Daily pivot range - N days pivot range - Customizable trading session - Drawing OR with the desired time Drawing levels A and C based on daily ATR or constant number - Possibility to display daily and last day pivots in color zone - Displaying the status of daily PMAs (layer 4) in the corner of the chart - Show the order of daily pivot placement with multi-day piv
FREE

Multi-currency and multitimeframe Heikin Ashi indicator. Shows the current state of the market. On the scanner panel you can see the direction, strength and number of bars of the current trend. The Consolidation/Reversal candles are also shown using color. You can specify any desired currencies and periods in the parameters. Also, the indicator can send notifications when the trend changes or when reversal and consolidation candles (dojis) appear. By clicking on a cell, this symbol and period wi
CISD (Change In State Delivery) Indicator TradingLabs ID – ICT Concept Tool The Change In State Delivery (CISD) Indicator is designed based on the ICT (Inner Circle Trader) concept, where price transitions from one delivery state to another often signal high-probability trade opportunities. This tool automatically detects and marks CISD levels on your MT4 charts, helping traders identify potential breakout and retest zones with great accuracy. It is especially useful for traders applying Smart

TrendFuze Pro Precision Manual Trading Dashboard for Clear, Confident Decisions Stop guessing the trend
Stop reacting to conflicting indicators Trade with structure, confirmation, and clarity What Is TrendFuze Pro? TrendFuze Pro is a FREE manual trading dashboard for MT5 , designed to help traders make clearer and more confident decisions by combining: Higher-timeframe trend bias (HTF) Current-timeframe trend context (CTF) Momentum conditions Candle confirmation logic This tool does not
FREE

The index makes it easy for traders to know the opening and closing times of global markets :
- Sidney - Tokyo - London - New York
Where it misleads each time zone and enables us to know the times of overlapping the markets when the liquidity is high.
To get more indicators and signals, follow us on the Telegram channel link
https://t.me/tuq98
Or our YouTube channel, which has explanations in Arabic and a technical analysis course
https://www.youtube.com/@SSFX1
FREE
XAU Precision Pro (PAID VERSION) Description: Professional Gold Trading Solution with Multi-Timeframe Analysis & USD Correlation Intelligence
XAU Precision Pro is an advanced technical analysis indicator specifically designed for Gold (XAUUSD) trading. It combines multi-timeframe support/resistance detection with sophisticated USD correlation analysis to provide institutional-grade trading insights. The system automatically identifies key market structure levels, trend directions, and high-pro

This product receives information from indicators/signal tools and displays arrows or notifications when specific conditions are met.
For example, arrows and notifications are shown when MA25 and MA50 cross, when SAR reverses, when MACD changes its plus/minus, or when the closing price crosses the Bollinger Bands.
Please refer to the sample settings image for specific configurations.
For detailed manuals and configuration files: https://www.mql5.com/en/blogs/post/755082 A free version is als
FREE

Indicator introduction:
The indicator draws trend line and histogram, It has small price lag, and has no future functions, the signals will not drift. When the market is under inter-area oscillations, If the indicator appears red and green histogram, this is a low price zone, if the indicator appears magenta and yellow histogram , this is a high price zone. It can also be used to analyze market's trend according to the high and low price zone. The indicator can send emails, alerts and notificat
FREE

Proxima Scalper is a precision-engineered indicator designed to identify high-probability buy and sell signals across all timeframes and instruments. Built for traders seeking clear, actionable entries with defined risk management. Key Features Advanced signal detection algorithm that adapts to changing market conditions Clear buy and sell arrows with visual text labels for instant recognition Automatic Stop Loss and Take Profit level calculation using ATR Three progressive take profit targets

Fractal Volatility Map — Hurst Heatmap (MT5) Fractal Volatility Map highlights volatility compression before expansion. It paints a five-row heatmap of the Hurst metric over multiple lookback windows and confirms compression with an ATR-based quiet-volatility check. When several rows cluster near neutral and volatility is suppressed, a Compression signal is shown on the last closed bar. This is an analysis/visualization indicator; it does not provide trading signals and does not guarantee any p
FREE

Candle size oscillator is an easy to use tool to figure out candle size from highest to lowest price of each candle. It's a powerful tool for price action analysts specifically for those who works intraday charts and also a perfect tool for short term swing traders. Kindly note that you can also edit the Bullish and Bearish candles with different colors.
#Tags: Candle size, oscillator, price action, price range, high to low, candle ticks __________________________________________________________
FREE

Market Hours Pro is a time-based Forex session calculator that displays scheduled market session information directly on your MT5 chart. The indicator provides visual tracking of standard Tokyo, London, and New York trading sessions with dynamic timezone adjustment capabilities. Key Features Scheduled Session Tracking Session Time Calculation : Calculates scheduled times for all three major Forex sessions (Tokyo, London, New York) based on standard hours Time-Based Calculations : Minute-by-m
FREE

Here is the full technical and strategic description for the Gann Square of 9 indicator. Full Name Gann Square of 9 - Intraday Levels (v2.0) Overview This is a mathematical Support & Resistance indicator based on W.D. Gann's "Square of 9" theory. Unlike moving averages which lag behind price, this indicator is predictive . It calculates static price levels at the very beginning of the trading day (based on the Daily Open) and projects them forward. These levels act as a "road map" for the day,
FREE

Pivot Points Classic – L’indicatore essenziale per ogni trader tecnico Questo indicatore disegna automaticamente i livelli di Pivot Point più utilizzati dai trader professionisti, con supporto completo a 4 metodi di calcolo: Metodi supportati :
• Traditional
• Fibonacci
• Woodie
• Camarilla Caratteristiche principali :
Calcolo su timeframe superiore (multi-timeframe)
Visualizzazione chiara dei livelli P, R1, R2, R3, S1, S2, S3
Etichette dinamiche con nome e valore del livello
Colori per
FREE
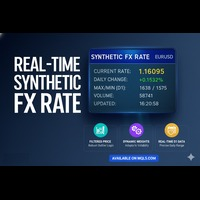
Real-Time Synthetic FX Rate Real-Time Synthetic FX Rate is an advanced indicator designed to calculate a robust, synthetic exchange rate estimate for any currency pair available on your broker (including Majors, Minors, and Exotics). Its goal is to offer a dynamic reference that reflects price formation minute-by-minute , providing an orientational guide before the publication of official rates or institutional validations. How It Works: The Robust Hybrid Model The indicator generates its synthe
FREE
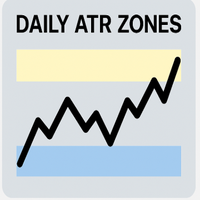
Daily ATR Zones – Precision Intraday Range Mapping Daily ATR Zones is a clear tool that plots intraday high/low targets using the Average True Range (ATR) of the previous days. These zones help traders anticipate potential price extremes , identify liquidity pockets , and define reversal or breakout levels — all based on objective volatility data. Key Features: Flat Zone Logic — Based on Open ± ATR , not bands around price
Custom Zone Thickness — Adjustable via ATR ratio ( ZoneHeightRatio )
FREE

'Circle Rising Point' is an indicator based on the cycle theory. No matter whether your trading cycle is short or long, you can use this indicator to find the rise and fall points of different cycles and different bands. Therefore, the signals displayed to you on charts of different cycles are different, and applicable to left side transactions. This indicator is recommended to be used together with the multi cycle window for analysis. Indicator introduction Applicable products This indicator is
FREE

I've combined two trading strategies, the Order Block Strategy and the FVG Trading Strategy, by utilizing a combination of the FVG indicators and Order Blocks. The results have been surprisingly effective.
This is a two-in-one solution that makes it easy for traders to identify critical trading zones. I've optimized the settings so that all you need to do is install and trade; it's not overly complex to explain further. No need for any usage instructions regarding the trading method. You shoul

Entry Helper - Professional MT5 Indicator Documentation
Overview
Entry Helper is a professional-grade MetaTrader 5 indicator that combines 15 advanced analysis layers for comprehensive market analysis
Designed for serious traders requiring institutional-level analysis capabilities
## Core Features
1 - 15 simultaneous analysis layers 2 - Machine learning price prediction 3 - Smart Money Concepts detection 4 - Institutional order flow analysis 5 - Multi-timeframe confluence system 6 - AI pa

MOST is applied on this RSI moving average with an extra default option added VAR/VIDYA (Variable Index Dynamic Moving Average)
MOST added on RSI has a Moving Average of RSI and a trailing percent stop level of the Moving Average that can be adjusted by changing the length of the MA and %percent of the stop level.
BUY SIGNAL when the Moving Average Line crosses above the MOST Line
LONG CONDITION when the Moving Average is above the MOST
SELL SIGNAL when Moving Average Line crosses below MOS

Magnetic levels for MT5 is a great addition to your trading strategy if you use support and resistance levels, supply and demand zones. The price very often gives good entry points to the position exactly at the round levels and near them.
The indicator is fully customizable and easy to use: -Choose the number of levels to be displayed -Choose the distance Between The levels -Choose the color of the levels.
Can be added to your trading system for more confluence. Works very well when combined

The " Stochastic Advanced " indicator displays the signals of the 'Stochastic" indicator directly on the chart without the presence of the indicator itself at the bottom of the screen. The indicator signals can be displayed not only on the current timeframe, but also on a timeframe one level higher. In addition, we have implemented a filter system based on the Moving Average indicator.
Manual (Be sure to read before purchasing) | Version for MT4 Advantages
1. Displaying the signals of the "Stoch

If you love this indicator, please leave a positive rating and comment, it will be a source of motivation to help me create more products <3 Key Takeaways Fisher is a repaint indicator. It recalculates previous bars when new bars become available. Modified to avoid repainting to accommodate some merchants. Fisher indicator is quite a simple histogram indicator that detects the trend's direction and strength and signals about trend changes. Traders look for extreme readings to signal potential p
FREE

GPF Stochastic: a momentum indicator that compares a specific closing price of an asset to a range of its prices over a certain period. It helps traders identify potential overbought or oversold conditions in the market. The indicator consists of two lines: %K Line : The main line, which represents the current closing price relative to the price range over a set period. %D Line : The signal line, which is a moving average of %K. The Stochastic Oscillator ranges from 0 to 100 , with levels typic
FREE

The script tries to determine the overall direction of the market, using smoothed Heiken Ashi candles. The coloring system (using bright and dark colors) is an attempt to detect strong market and weak market conditions. There's also an oscillator within the script
These are the features: Alert condition Features: You can now set alerts in the alert dialog for events like trend switch, trend strengthening and weakening; all for both Bullish and Bearish trend.
I also added the code for custom a
FREE
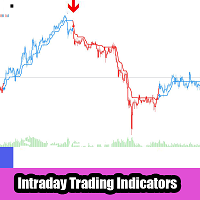
This trading indicator is non-repainting, non-redrawing, and non-lagging, making it an ideal choice for both manual and automated trading. It is a Price Action–based system that leverages price strength and momentum to give traders a real edge in the market. With advanced filtering techniques to eliminate noise and false signals, it enhances trading accuracy and potential.
By combining multiple layers of sophisticated algorithms, the indicator scans the chart in real-time and translates comple
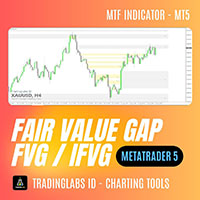
Fair Value Gap (FVG) & Inversion Fair Value Gap (iFVG) – TradingLabs ID In the ICT (Inner Circle Trader) concept, a Fair Value Gap (FVG), also known as Imbalance, occurs when price moves too quickly, leaving behind a gap without sufficient order balance. These areas are highly valuable for professional traders as they often signal potential retracement or entry zones with high probability. The FVG & iFVG Indicator is designed to automatically detect Fresh, Mitigated, and Inversion Fair Value Gap
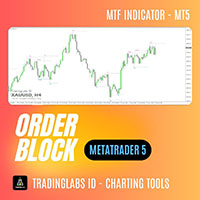
Order Block + Fair Value Gap (FVG) Indicator Multi-Timeframe Order Block + FVG Tool In the ICT (Inner Circle Trader) concept, Order Blocks (OB) + Fair Value Gaps (FVG) are among the most critical areas used by professional traders to read market structure, identify supply & demand zones, and spot high-probability entry points. The Order Block + FVG Indicator automatically detects and displays both Order Block zones and Fair Value Gaps directly on your MT4 charts. With multi-timeframe support, yo
Alpha Edge Pro – The Manual Trader’s Edge - If you prefer trading manually without stress, this indicator is for you. Get your copy now. Tired of missing the big moves or holding on to losing trades too long? Alpha Edge Pro is your new secret weapon. This high-performance, plug-and-play MT5 indicator gives you crystal-clear BUY and SELL signals — so you can trade with confidence, precision, and speed. If you prefer manual trading profitably , this indicator is made for you. Alpha Edge Pro does
FREE

For those who needs a levels of a first day of a month fully coded with Grok AI Standard settings: * line width * historic Lvl's * Line colors/type *************************************************************************************** Inspired by trader, to use these levels, but i wanted to mark these levels fast and not waste my time on drawing them.
FREE
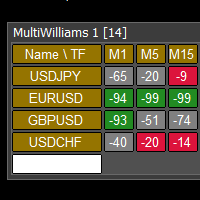
This tool monitors WilliamsPR indicators on all time frames in the selected markets. Displays a table with signals to open a BUY trade (green) or SELL trade (red). You can set the conditions for the signal. You can easily add or delete market names / symbols. If the conditions for opening a trade on multiple time frames are met, you can be notified by e-mail or phone message (according to the settings in MT5 menu Tools - Options…) You can also set the conditions for sending notifications. The li

Highly configurable Volume indicator.
Features: Highly customizable alert functions (at levels, crosses, direction changes via email, push, sound, popup) Multi timeframe ability Color customization (at levels, crosses, direction changes) Linear interpolation and histogram mode options Works on strategy tester in multi timeframe mode (at weekend without ticks also) Parameters:
Volume Timeframe: You can set the lower/higher timeframes for Volume. Volume Bar Shift: you can set the offset of the l
FREE

This indicator calculates the difference between the SELL aggression and the BUY aggression that occurred in each Candle, plotting the balance of each one graphically. Note: This indicator DOES NOT WORK for Brokers and/or Markets WITHOUT the type of aggression (BUY or SELL).
Be sure to try our Professional version with configurable features and alerts: Delta Agression Volume PRO
Settings
Aggression by volume (Real Volume) or by number of trades (Tick Volume) Start of the Aggression Delta
FREE

The Custom Alert Lines.mq5 Indicator is designed to create two horizontal lines on the chart that serve as levels for alerts when the price crosses them. Key Functions and Features Two Customizable Lines (L1 and L2): The indicator allows the user to set the color, style, and thickness for each of the two lines via input parameters. Crossing Alerts: The indicator monitors when the closing price of the current bar crosses the level of one of the lines. Upon crossing, a pop-up alert is generated a
FREE

# 33% off - limited time only # ChartSync Pro MT5 is an indicator, designed for the MetaTrader 5 trading terminals. It enables the trader to perform better multi-timeframe technical analysis, by synchronizing symbols and objects into virtually unlimited charts. Built by traders for traders! Telegram Premium Support - Dd you purchase the Chart Sync indicator and need a bit of help? Send us a screenshot with your purchase and your Telegram ID so we can add you to our premium support Telegram g

Seeing and interpreting a sequence of Candlesticks is easy to spot when you are a human... Higher Highs, Higher Lows, are the panorama of a Buying trend, at least in a short period of time... Seeing a current candlestick higher high and a lower candlestick low, as a human, you can immediately spot a "divergence", an "alert", a "starting range", but in the end and based on other analysis a human trader can understand and behave accordingly to this kind of candlestick data... But what about EAs (r
FREE

Looks for strong price movements and draws levels upon their completion.
You determine the strength of the movement yourself by specifying in the settings the number of points and the number of candles of the same color in a row in one direction.
There are 2 types of building in the settings: extrenum - high / low close - close price You can also adjust the number of displayed levels and the number of candles for calculations.
By default, the settings indicate 5 levels for 360 candles.
That
FREE

Introducing our latest innovation in MetaTrader 5 indicators, designed to dramatically improve your trading workflow with high functionality and ease-of-use. It features a robust collection of features designed to help you streamline chart analysis and make the most of your trading decisions. Here's a quick rundown of its incredible features: Fast Drawing of Objects : Save precious time with the quick draw feature. With just a click of a button, you can create various trading objects on your ch
FREE

The Expert Advisor for this Indicator can be found here: https://www.mql5.com/en/market/product/116472 Introducing the Rejection Candle MT5 Indicator, a robust tool designed to revolutionize your trading experience on the MetaTrader 5 platform. Built to pinpoint potential reversals with precision, this indicator offers unparalleled insights into market sentiment shifts, empowering traders to seize profitable opportunities with confidence. Key Features: Advanced Rejection Candle Detection: Uncov
FREE

CustomRSI50 - Customized RSI Indicator with Level 50 Description CustomRSI50 is a customized technical indicator based on the popular Relative Strength Index (RSI). This indicator provides a clear and customizable view of the RSI, with a special emphasis on the 50 level, which is crucial for many traders in momentum analysis. Main Features Configurable RSI period Highlighted 50 reference level Customizable applied price type Displayed in a separate window Fixed scale from 0 to 100 for easy inter
FREE

Introducing Assembler:
The best value for money, Designed for advanced traders and professionals, yet accessible for ambitious beginners ready to elevate their trading game. Great for ICT, SMC, TREND and breakout traders . Combining advanced analytics, a sleek graphical interface, and highly customizable features, Assembler empowers you to trade with precision, clarity, and confidence.
Key Features of Assembler 1. Dynamic Graphical User Interface (GUI): A fully draggable, customizable interf

Ideal for scalpers, day traders and swing trades. Automatically identifies key support and resistance levels based on historical price data. It displays real-time trading zones and a precise countdown timer for each candle, helping traders make faster and more confident decisions. Fully customizable for multiple timeframes and instruments. The indicator analyzes historical price data to draw horizontal levels that represent key trading areas. It also displays, in real time, the current zone whe
FREE

The indicator is based on Robert Miner's methodology described in his book "High probability trading strategies" and displays signals along with momentum of 2 timeframes. A Stochastic oscillator is used as a momentum indicator.
The settings speak for themselves period_1 is the current timeframe, 'current' period_2 is indicated - the senior timeframe is 4 or 5 times larger than the current one. For example, if the current one is 5 minutes, then the older one will be 20 minutes The rest of the s
FREE
XAU Scalper MT5 MT4 Version An analytical tool for observing short-term price movements in gold pairs. The XAU Scalper Indicator provides buy and sell signals based on candle stability, RSI, and short-term momentum. It is designed to help traders identify potential entry points during brief market movements in XAU pairs. Features Candle Stability Index: Measures the proportion between candle body and wicks to assess price action reliability. RSI Index: Tracks relative strength to indicate

The Volume Heatmap indicator visually shows the INTENSITY of the volume taking into account the concept of standard deviation. Purpose of the Indicator: High volumes are common where there is a strong consensus that prices will increase. An increase in volume often occurs at the beginning of a new upward trend in the price of an asset. Some technical analysts do not rely on trend confirmations without a significant increase in volume. Low volumes usually occur when an asset is heading for a down
FREE
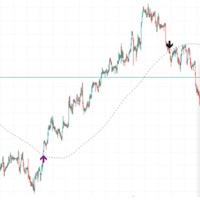
If the price is cutting above the slow length moving average, a breakout may occur. If the price is cutting below, a pullback may occur in the market. This was known for a long time, but there aren't many indicators which signal on the event. Candlestick pattern validation is also used in this indicator so that signals will not be drawn on doji candles or small "uncertainty" candles. The length of the moving average period can be defined by the user (default is 200). The number of price movement
FREE
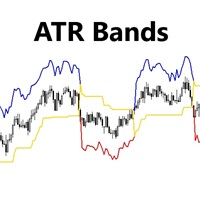
Indicator Shows ATR bands and Trailing Stop Line. Use it in your trend following strategy to improve your stop loss trailing and Trend. Adjust ATR Period and ATR Factor for your Symbol. This indicator has 3 outputs: 0- Upper Channel Data 1- Lower Channel Data 2- Main Line Data Please call me if you need more input parameters or modified version of this indicator.
FREE

Tyr Bands Indicator (IC MARKETS GOLD). Just drag and drop. This indicators gets you entry points for the market. it is for gold, but you can configure for any other currency. Tyr Band works with BB and 3 different deviations, plus the Stochastic confirmation. So when the price closes below/above the BB Reversal Band (Red) and the Stochcastic is in the confirmation zone, then the arrow (buy/sell) appears. This arrow indicates that we can entry to the market up/down on the next opening. Since it i
FREE
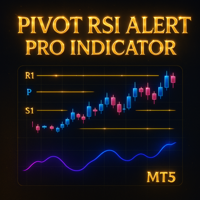
Detailed Description: The Pivot RSI Alert Pro Indicator is a powerful all-in-one indicator that combines five pivot point methods (Classic, Fibonacci, Woodie, Camarilla, DeMark) with a customizable RSI filter. It automatically plots daily pivot levels and midpoints, highlights key reversal zones and sends alerts when price approaches these levels, especially under RSI overbought/oversold conditions. Ideal for intraday and swing traders who rely on dynamic support/resistance and momentum confirm

Price and Spread Indicator
Version: 1.0 Developer: Creative Tech Solutions Website: https://www.creativetechsolutions.co.uk
Overview The Price and Spread Indicator is a great tool for MetaTrader 5 that displays the Ask and Bid prices along with the spread directly on the chart. This indicator provides real-time updates and allows traders to make informed decisions based on accurate price information.
Features - Real-time Price Updates: Continuously updates Ask and Bid prices. - Spread Disp
FREE

Contact me for any queries or custom orders, if you want to use this in an EA. Key Features: Pattern Recognition : Identifies Fair Value Gaps (FVGs) Spots Break of Structure (BOS) points Detects Change of Character (CHoCH) patterns Versatile Application : Optimized for candlestick charts Compatible with any chart type and financial instrument Real-Time and Historical Analysis : Works seamlessly with both real-time and historical data Allows for backtesting strategies and live market analysis Vis

This indicator is a volume indicator it changes the color of the candles according to a certain number of ticks, and this number of ticks can be informed by the user both the number of ticks and the color of the candles, this indicator works in any graphical time or any asset, provided that the asset has a ticker number to be informed.
This indicator seeks to facilitate user viewing when analyzing candles with a certain number of ticks.
FREE

Alligator Window Indicator : Potencialize suas análises no MetaTrader com o Alligator Window. Este indicador coloca o clássico Alligator de Bill Williams em uma janela separada, permitindo uma visualização mais clara e organizada. Ideal para traders que buscam precisão e eficiência em suas operações, o Alligator Window proporciona insights nítidos e facilita a identificação de tendências sem poluir o gráfico principal. Experimente agora e leve suas estratégias de trading a um novo patamar!
FREE

This is just a ADX with multi symbols, multi timeframes, and colors. features. different symbols and timeframes from the main chart. draw ADX and ADX moving average. easy to identify if ADX is above 25 or not. e asy to identify if ADX is above moving average or not. easy to identify the direction of the trend by color, not by DI line. unnecessary DI lines can be erased
FREE

This product is designed to display the trading sessions of 15 countries based on the time zone of your broker server and various display modes based on your desired settings to prevent chart congestion and the possibility of setting a session with the user's desired time.
The sun never sets on the forex market, but its rhythm dances to the beat of distinct trading sessions. Understanding these sessions, their overlaps, and their unique atmospheres is crucial for any forex trader who wants to
FREE

TickVelocity with Smart Alert : Real-Time Buyer vs Seller Speed Dominance **️ Discover the raw energy of the market with the TickVelocity with Smart Alert indicator. Go beyond standard volume and price action to measure the speed and momentum of price changes, revealing the true underlying dominance of buyers or sellers in real-time. This essential tool provides a clear, separate-window view of market dynamics and features a sophisticated Smart Alert System to catch explosive moves early!
FREE

T3 Matrix Pro – Adaptive Trend Fusion EA T3 Matrix Pro is an advanced trend-following Expert Advisor that blends the power of T3 Moving Averages , Parabolic SAR , and Heikin-Ashi analysis into a single precision-driven system.
Designed for both scalping and swing trading, it identifies market structure shifts early and confirms them with multi-layered momentum logic. Core Logic T3 Fast & Slow Algorithm – Detects early trend transitions with exceptional smoothness. PSAR Confirmation Layer – Valid

The ultimate signal filter. Get clear, non-repainting arrows only when the trend on M1, M5, M15, and H1 timeframes are fully aligned, confirming strong momentum for scalping or short-term trades. Full Product Description Non-Repainting Arrows: Built using precise closing price data ( rates_total - 1 and iBarShift ), ensuring signals are final and never shift or disappear after the bar closes. What you see is what you get. High-Confidence Signals: Filters out noise by requiring agreement acros
FREE

The Ultimate Multi-Asset Dashboard: Monitor Forex, Crypto, and Indices on a single synchronized timeline.
Don’t just watch candles—see the heartbeat of the market with precision second-level data.
Compare Bitcoin volatility vs. EURUSD stability in real-time on a unified 0–100 scale. Key Features 1️⃣ The "Seconds" Engine (CSecondsEngine) Precision Technology: Maintains independent second-based history for every symbol. M1 Exclusive: Unlocks high-definition micro-movements unavailabl
FREE

An analogue of the Stochastic oscillator based on algorithms of singular spectrum analysis (SSA) SSA is an effective method to handle non-stationary time series with unknown internal structure. It is used for determining the main components (trend, seasonal and wave fluctuations), smoothing and noise reduction. The method allows finding previously unknown series periods and make forecasts on the basis of the detected periodic patterns. Indicator signals are identical to signals of the original i
FREE
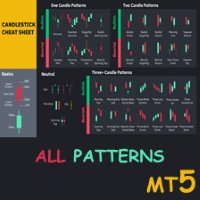
Special offer : ALL TOOLS , just $35 each! New tools will be $30 for the first week or the first 3 purchases ! Trading Tools Channel on MQL5 : Join my MQL5 channel to update the latest news from me Mastering candlestick patterns is essential for any trader looking to make well-informed decisions in the market. Introducing All Candlestick Patterns – a comprehensive tool designed to elevate your technical analysis and provide powerful insights into market trends and potential reversa
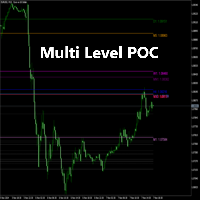
Detailed Description:
The Multi Level POC Indicator is designed for traders who want to identify critical price levels based on volume analysis across multiple timeframes. Key Features:
Multi-Timeframe POC Calculation: Automatically calculates and displays the POC from multiple timeframes, including M1, M5, H1, D1, and more. Intermediate Levels Display: In addition to the primary POC levels, the indicator also plots intermediate levels based on the POC. Custom Precision and Depth Settings: Us
FREE

New Candle Alert is a simple indicator that notify you when a new candle is formed. Func tions : Alert type - option to choose between message with sound or only sound. Message - alert message. Push notifications - enable push notifications. Show timeframe - show the symbol timeframe. Show hour - show the alarm time. Test message - if you don't want to wait a new candle formed to see the message. MT4 version: https://www.mql5.com/pt/market/product/37988 Hope you enjoy it. Any doubt or su
FREE

The Andean Oscillator is a powerful momentum-based indicator designed to help traders identify trends, reversals, and market strength with high precision. Inspired by traditional oscillators like the MACD and RSI, this unique tool smooths out price fluctuations and provides clearer signals for both entry and exit points.
Key Features: • Momentum & Trend Detection – Helps traders spot bullish and bearish momentum shifts early. • Smoothed Oscillator – Reduces noise and provides more reliable t
FREE

This is the demo version of "All Harmonics 26" indicator . "All Harmonics 26" searches for 26 types of harmonic patterns and outputs them in a convenient way. You can check out the documentation here . This demo version has the following limitations: The indicator searches only for one type of harmonic patterns out of 26:- Gartley. The indicator outputs new patterns with a lag of 10 bars.
FREE

O Touch VWAP é um indicador que permite calcular uma Média Ponderada por Volume (VWAP) apenas apertando a tecla 'w' no seu teclado e após clicando no candle do qual deseja realizar o calculo, clicando abaixo do candle é calculada a VWAP baseado na minima dos preços com o volume, clicando sobre o corpo do candle é calculado uma VWAP sobre o preço medio com o volume e clicando acima do candle é calculado uma VWAP baseado na máxima dos preços com o volume, voce tambem tem a opção de remover a VWAP
FREE

Trend magic indicator uses cci and atr to create buy and sell in the market . this a a line that changes its color when any of the conditions occur ie buy and sell . I find the indicator given you a bit of a better entry when you change the parameters to CCI=20, ATR=100, ATR MULTIPLIER= 2.
Set up entry just above the indicatror afetr a retracement. Set your stop loss a 20 cents to a dollar (depending on share size) below your entry. Be ready to enter a new position above indicator again if you
FREE
The MetaTrader Market offers a convenient and secure venue to buy applications for the MetaTrader platform. Download free demo versions of Expert Advisors and indicators right from your terminal for testing in the Strategy Tester.
Test applications in different modes to monitor the performance and make a payment for the product you want using the MQL5.community Payment System.
You are missing trading opportunities:
- Free trading apps
- Over 8,000 signals for copying
- Economic news for exploring financial markets
Registration
Log in
If you do not have an account, please register
Allow the use of cookies to log in to the MQL5.com website.
Please enable the necessary setting in your browser, otherwise you will not be able to log in.