Watch the Market tutorial videos on YouTube
How to buy а trading robot or an indicator
Run your EA on
virtual hosting
virtual hosting
Test аn indicator/trading robot before buying
Want to earn in the Market?
How to present a product for a sell-through
Technical Indicators for MetaTrader 5 - 17
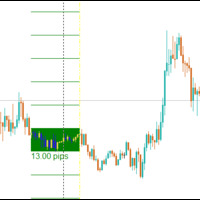
The Central Bank Dealers Range (CBDR) is a key ICT concept, used to project potential highs and lows for the day based on market conditions during a specific time window. The CBDR is utilized to forecast price movements in both bullish and bearish market conditions. By identifying this range, traders can better anticipate the price levels that may form as the day progresses.
CBDR and Standard Deviation A key feature of the CBDR is its application of standard deviation , a statistical measure u
FREE

Using the Stochastic Oscillator with a Moving Average is a simple but very efficient strategy to predict a trend reversal or continuation.
The indicator automatically merges both indicators into one. It also gives you visual and sound alerts.
It is ready to be used with our programmable EA, Sandbox, which you can find below: Our programmable EA: https://www.mql5.com/en/market/product/76714 Enjoy the indicator!
This is a free indicator, but it took hours to develop. If you want to pay me a coff
FREE

After working during many months, with the help of Neural Networks, we have perfected the ultimate tool you are going to need for identifying key price levels (Supports and Resistances) and Supply and Demand zones. Perfectly suitable to trigger your trades, set up your future actions, decide your Take Profit and Stop Loss levels, and confirm the market direction. Price will always move between those levels, bouncing or breaking; from one zone to another, all the remaining movements are just mark

MOVING AVERAGE RIBBON Ritz MA Ribbon Dynamics – The Next-Gen Trend Visualizer Ritz MA Ribbon Dynamics is a futuristic multi-layer Moving Average system engineered to visualize trend momentum, volatility balance, and market rhythm in one adaptive ribbon.
Designed for modern traders who demand clarity, flexibility, and automation — this tool transforms the classic MA visualization into a dynamic analytical framework. Core Concept The indicator creates a multi-tier MA Ribbon that adapts to the cho
FREE
What is the Chart Sync Indicator? This custom MQL5 tool enables multi-timeframe chart synchronization, addressing a common pain point in technical analysis: the inconsistencies when switching between chart windows or timeframes. Instead of managing each chart separately, this indicator links them so actions such as panning, zooming, drawing objects, or changing symbols are mirrored across all synced charts of the same symbol. The result is a smoother, unified analysis experience. Key Advantages:
FREE

Best Solution for any Newbie or Expert Trader! This indicator is a unique, high quality and affordable trading tool because we have incorporated a number of proprietary features and a secret formula. With only ONE chart it gives Alerts for all 28 currency pairs. Imagine how your trading will improve because you are able to pinpoint the exact trigger point of a new trend or scalping opportunity! Built on new underlying algorithms it makes it even easier to identify and confirm potential trades.
Haven Trend Tracker PRO - Your Navigator in the World of Trends Introducing Haven Trend Tracker PRO – a powerful multi-timeframe indicator designed for traders who want to trade in harmony with the market. Its main goal is to eliminate your doubts by showing the trend direction on both your working (LTF) and higher (HTF) timeframes simultaneously. My other products -> HERE . Trading with the trend is the most reliable strategy. The indicator helps you identify the dominant market force and

Market Structure Highs and Lows Overview:
Market Structure Highs and Lows is a professional indicator that automatically detects and visualizes key price structure points — Higher Highs (HH), Higher Lows (HL), Lower Highs (LH), and Lower Lows (LL). It helps traders clearly see trend direction, reversals, and market flow through a clean ZigZag structure. How it works:
The indicator analyzes swing points using a ZigZag algorithm to define structural highs and lows. Uptrend: Sequence of HH and H
FREE
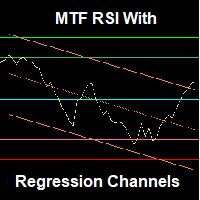
An advanced RSI indicator that displays dynamic linear regression channels in both the indicator window and the price chart, with predefined horizontal levels to detect overbought and oversold zones. Main Features (Summary): Synchronized linear regression channels on both price and RSI Multi–timeframe support Smart and ready-to-use horizontal levels Professional design with optimized performance Feedback & Support We value your experience! If you have any questions, suggestions, or encounter any
FREE

This SMT (Smart Money Technique) divergence indicator identifies discrepancies in price movement between two different trading symbols, helping traders detect potential market reversals. This tool compares the price action of two correlated assets, such as two currency pairs or indices, to spot divergences where one asset's price moves in the opposite direction of the other. For example, while one symbol may be making higher highs, the other might be making lower highs, signaling a divergence. T
FREE

Mouse You can draw fibonaccis moving the mouse over the zigzag indicator Pin them You can click on fibonacci with this option and it will no longer be deleted unless you click on it again :) Precision The tuned fibonacci gets the precise point in lower timeframes Enjoy it You can ask me for add more features, so please comment and leave your ranting for me to be happy, thank you :)
FREE

Overview Magic 7 Indicator is a comprehensive MetaTrader 5 (MQL5) indicator that identifies seven different trading scenarios based on candlestick patterns and technical analysis. The indicator combines traditional price action patterns with modern concepts like Fair Value Gaps (FVG) to provide trading signals with precise entry points and stop loss levels. Features 7 Trading Scenarios : Each scenario identifies specific market conditions and trading opportunities Visual Signals : Clear buy/sell
FREE
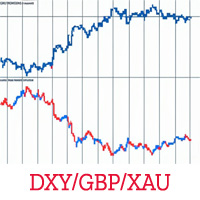
Overview Unlock a fresh perspective on your charts with the KS Invert Chart Pro Indicator – a powerful, zero-lag tool designed exclusively for MetaTrader 5. This innovative indicator inverts bars or candles mathematically (by multiplying price data by -1), revealing hidden patterns, contrarian opportunities, and inverse correlations that traditional views might miss. Perfect for advanced traders employing correlation strategies, multi-timeframe analysis, or hedge monitoring. Whether you're spott
FREE
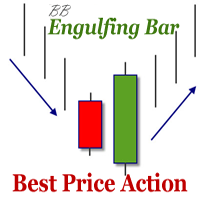
The indicator defines the Bullish and Bearish Engulfing Bar. The pattern has greater reliability when the open price of the engulfing candle is well above the close of the first candle, and when the close of the engulfing candle is well below the open of the first candle. For an engulfing bar to be valid it must fully engulf at least one previous bar or candle - includes all the body and the wick. The engulfing bar can engulf more than one bar as long as it completely engulfs the previous bar.
FREE
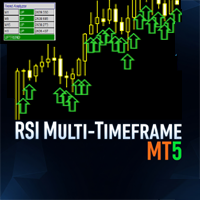
The MultiFrameRSIIndicator is a powerful MetaTrader 5 (MT5) indicator that leverages the Relative Strength Index (RSI) to analyze trends across multiple timeframes. This indicator synchronizes RSI-based trend signals from up to nine timeframes (M1, M5, M15, M30, H1, H4, D1, W1, MN1) and presents them with clear visual feedback, including a colored RSI line, signal arrows, and a customizable dashboard. Ideal for traders seeking momentum-based trend confirmation. Features Multi-Timeframe Analysis
FREE

Stochastic indicator alerts when EA Available in comments , must have indicator installed buys stochastic main line is above signal line stochastic is below 30 rsi 5 is below 20 sell stochastic main line is below signal line stochastic is above 70 rsi 5 is above 80 ADD to chart Stochastic k 30 - d 9 - slowing 3, levels 30/70 rsi 5 lelels 20.80
Full alerts push, mobile , email ect All input settings variable feel free to contact for more information or alert sugestions
FREE

This indicator draw a line on high and low levels of X number of days. It is possible to have an alert (in the software and mobile app) for when the price breaks the high or low of the current day. Configurações: Days - past days to calculate (1 = actual day only).
Alert when reach levels - activate the alert for specific levels or both.
Push notification - enable the alert to the mobile MT5 app.
Appearance
High - high level color.
Low - low level color.
Size actual day - thickness
FREE

# DAILY SUPPORT AND RESISTANCE LEVELS - SEO OPTIMIZED DESCRIPTION
## SHORT DESCRIPTION (160 characters max)
```
Free pivot points indicator with daily support resistance levels for MT5. Perfect for intraday forex day trading and scalping strategies.
```
**Character count:** 159
**Keywords included:** pivot points, support, resistance, MT5, forex, day trading, scalping, free
---
## FULL DESCRIPTION (HTML Formatted for MQL5)
### Main Title
**Daily Support and Resistance Levels - Free Pivot
FREE

IQ FX Gann Levels a precision trading indicator based on W.D. Gann’s square root methods . It plots real-time, non-repainting support and resistance levels to help traders confidently spot intraday and scalping opportunities with high accuracy. William Delbert Gann (W.D. Gann) was an exceptional market analyst, whose trading technique was based on a complex blend of mathematics, geometry, astrology, and ancient mathematics which proved to be extremely accurate. Setup & Guide:
Download MT4 Ver

The Advanced Support and Resistance Indicator for MetaTrader 5 leverages sophisticated pivot point detection algorithms to autonomously identify and visualize critical price levels on the chart. Utilizing a configurable pivot period (default: 20 bars) and data source (High/Low or Open/Close), it intelligently scans historical price action within a user-defined loopback window (default: 290 bars) to pinpoint pivot highs and lows with strict validation criteria for enhanced precision. Pivots are d
FREE

Phoenix Moving Average Meter (MT5) Professional moving average trend analysis and visualization tool for MetaTrader 5. Combines intelligent slope analysis, cloud width measurement, and regime classification into a clean, real-time dashboard. Overview Phoenix Moving Average Meter analyzes the relationship between a fast and slow moving average to determine trend direction, strength, and maturity. The indicator continuously monitors MA slope angle, cloud width expansion or contraction, and time s
FREE
If you love this indicator, please leave a positive rating and comment, it will be a source of motivation to help me create more products <3 How to use Gann High-Low Activator? The Gann HiLo Activator helps the trader identify the current trend of the market. When the indicator is below the closing price, it can indicate that an uptrend is taking place. Conversely, when the indicator is above the closing price, it can indicate a downtrend. The Gann HiLo Activator also generates buy and sell sig
FREE
The Moving Average Ribbon is a technical indicator that overlays a series of moving averages (MAs) on a price chart to visualize trend direction, strength, and potential reversals or reentries. It supports both Exponential Moving Averages (EMA) and Simple Moving Averages (SMA), configurable via user input.
Key Features:
Ribbon Composition: Displays 18 moving averages with periods ranging from 5 to 90 in increments of 5 (e.g., MA5, MA10, ..., MA90), plus an internal MA100 for reference. The MA5
FREE

FiboPivot TrendLines - Comprehensive Market Analysis Indicator
This powerful indicator combines Fibonacci pivot point analysis with automatic trend line detection, providing traders with a complete technical analysis toolkit in a single tool.
Key Features : - Fibonacci Pivot Points: Automatically calculates and displays R1-R3, Pivot, and S1-S3 levels using previous day's data - Fractal-Based Trend Lines: Automatically draws channel trend lines based on fractal patterns - Interactive
FREE

The behavior of different currency pairs is interconnected. The Visual Correlation indicator allows you to display different Symbols on a single chart while preserving the scale. You can determine a positive, negative correlation, or lack thereof. Some instruments begin to move earlier than others. Such moments can be determined when overlaying charts. To display a tool on a chart, enter its name in the Symbol field.
Version for MT4 https://www.mql5.com/en/market/product/33063
FREE

ICT Silver Bullet
If you are searching for a reliable indicator to trade the ICT Silver Bullet concept, or ICT concepts, Smart Money Concepts, or SMC, this indicator will respond to your need! Before version 2.2, this indicator was focused only on ICT Silver Bullet, but moving forward, we will include the different elements for smart money concept trading. This indicator will help you identify the following: FVG - fair value gaps Market structure: BOS and CHOCH. It is based on swing high and l

Introduction
The PF Maximizer is a game-changing non-repainting technical tool engineered to help traders distinguish genuine trend signals from erratic market fluctuations. By employing sophisticated algorithms and cutting-edge data analysis, this indicator efficiently filters out unwanted noise, empowering traders to identify the precise starting and ending points of substantial market moves.
Signal
Potential buy signal is generated when moving average is going up and the blue line cross a
FREE

LZ Multi-Timeframe Candle Timer displays the remaining time before the current bar closes for multiple timeframes simultaneously on a single dashboard. Monitor up to 9 timeframes (M1, M5, M15, M30, H1, H4, D1, W1, MN1) without switching charts. The indicator uses server time, updates every second, and is optimized for smooth display with minimal CPU use.
Feature highlights
- Multi-timeframe display: select which timeframes to show (M1 through MN1) via boolean inputs. Display only the interval
FREE

Seconds Chart For MetaTrader 5 The Indicators allows you to create charts in the MetaTrader 5 terminal with a timeframe in seconds. The timeframe on such a chart is set in seconds, not in minutes or hours. Thus, you can create charts with a timeframe less than M1. For example, S15 is a timeframe with a period of 15 seconds. You can apply indicators, Expert Advisors and scripts to the resulting chart. You get a fully functional chart on which you can work just as well as on a regular chart. The t
A lightweight digital indicator that combines the most important momentum tools directly on the chart. It displays real-time values of RSI, ADX, +DI, −DI, and DI Spread in a clean and compact format, without drawing any lines or graphical objects on the chart. Designed to provide fast insight into trend strength and the balance between buyers and sellers, without the need to open additional indicator windows. Fully customizable—font, size, and screen position can be adjusted easily.
FREE

Introduction to Fractal Pattern Scanner Fractal Indicator refers to the technical indicator that makes use of the fractal geometry found in the financial market. Fractal Pattern Scanner is the advanced Fractal Indicator that brings the latest trading technology after the extensive research and development work in the fractal geometry in the financial market. The most important feature in Fractal Pattern Scanner is the ability to measure the turning point probability as well as the trend probabil

The KT HalfTrend is a moving average-based trend indicator that draws zones. It marks a trend shift by drawing bearish and bullish invalidation zones on the chart. It also displays the trend buy-sell strength with arrows on the main chart. The indicator will be flat if no trend indicates accumulation, temporary price, or distribution zones. If there is a trend, there will be a slope in that direction. The trend signals are substantial if the slope is steep, either to the upside or the downside.

This is a Market Depth (DOM - Depth of Market) Indicator for MetaTrader 5 that displays real-time order book data in a visual ladder format. The DOM provides a comprehensive view of market depth with clear visual cues for volume imbalances, making it useful for both scalping and swing trading decisions This indicator provides traders with a professional-grade market depth visualization that can be customized to match individual trading preferences and strategies. You can easily switch betwe

Product: Phantom Shadow Reversal Engine Version: 3.0 (Elite Edition) Developer: Trade With Thangam
THE ULTIMATE SCALPING TOOL FOR XAUUSD & MAJOR PAIRS
The Phantom Shadow Reversal Engine is not just another indicator; it is a complete trading system designed for precision scalping and day trading.
Instead of relying on lagging signals, this system uses a "Proprietary Shadow Engine" that analyzes Market
FREE

Gann Hilo — Precision and Clarity in Trend YouTube Channel: @BotPulseTrading
GannHilo is a technical indicator designed to identify precisely and visually trend changes in the market. Combining price structure with Gann theory, this system draws dynamic lines that act as smart guides of direction and support . Its minimalist design and optimized algorithm allow for a clean and effective reading, showing exactly when momentum shifts direction without noise or unnecessary delays. Ideal for both
FREE
Reverse RSI Signals Indicator
The Reverse RSI Signals indicator is a versatile technical analysis tool designed for MetaTrader 5 (MT5). It transforms traditional RSI calculations into dynamic price-based bands, integrates Supertrend for trend identification, and includes divergence detection for potential reversal signals. This overlay indicator provides visual and alert-based insights to help traders spot overbought/oversold conditions, trend shifts, and momentum divergences directly on the p
FREE
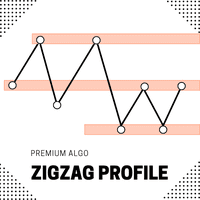
Introducing the ZigZag Profile — a powerful tool designed to identify high-probability pivot zones where price action frequently reverses. This indicator analyzes historical price data to pinpoint key areas where price has pivoted multiple times, providing traders with actionable insights into potential support and resistance levels. The ZigZal Profile indicator continuously scans for zones where price has reversed direction the most, highlighting these critical areas on your chart. By focusing
FREE

Zenith Session Flux is a professional-grade technical indicator for MetaTrader 5 designed to identify and visualize institutional trading windows known as ICT Killzones. The indicator automates the process of time-alignment by synchronizing your broker's server time with New York local time, ensuring that session boxes and price pivots appear at the precise institutional moments regardless of your broker's timezone. Indicator Features: Automatic Timezone Sync: Automatically calculates the offset
FREE

In information security, a brute force attack consists of a systematic trial and error method to discover passwords, login credentials or cryptographic keys. Inspired by this approach, we developed Brute Force Trend, a market analysis tool that uses algorithms to identify patterns and reversal points.
Main Features:
Multiple calculation methods – Nine different ways to process the price, allowing adaptation to different trading styles.
Non-repainting indicator – Signals are fixed after the c
FREE

trend, pullback, trend indicator, volatility, atr, moving average, ema, momentum, oscillator, order flow, delta, trend trading, scalping, day trading, swing trading, price action, market flow
What it does
Identifies the main trend using moving averages.
Draws dynamic pullback zones based on volatility.
Shows directional price flow (buying or selling pressure).
Helps with market context reading for more precise trades.
How I use this indicator in practice:
When price is trading below the

RSI ABCD Pattern Finder: Technical Strategy 1. How the Indicator Works Combines the classic RSI with automatic detection of ABCD harmonic patterns . Key Components Standard RSI (adjustable period) Peak and Trough Markers (arrows) ABCD Patterns (green/red lines) Overbought (70) and Oversold (30) Filters 2. MT5 Setup period = 14 ; // RSI period size = 4 ; // Maximum pattern size OverBought = 70 ; // Overbought level OverSold = 30 ; // Oversold level Filter = USE_FILTER_ YES ; // Confirmation filte
FREE
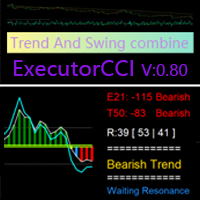
Based on the CCI Trend-Following Principle, Improved to Identify Trend Reversals
This indicator is designed to confirm trends after identifying them using the ( Executor Trend Indicator ) indicator, making it a tool for both trend confirmation and reversal detection. Features Green and Red Histogram: Represents the development of bullish (green) or bearish (red) trends in the current timeframe. Blue Line and Green Histogram (Bullish Confirmation): When the blue line rises above +10
FREE

Overlay indicator on chart between 2 pairs
The Timeframe Overlay indicator displays the price action of timeframes on a single chart, allowing you to quickly assess different timeframes from a single chart. The advantage is to observe and follow the correlations of price movements in real time to help you find potential trades at a glance.
---- Symbol 1 ----
Symbol = EURUSD
Correlation Inverse = false
Display = true
Ratio
FREE

ATREND: How It Works and How to Use It How It Works The " ATREND " indicator for the MT5 platform is designed to provide traders with robust buy and sell signals by utilizing a combination of technical analysis methodologies. This indicator primarily leverages the Average True Range (ATR) for volatility measurement, alongside trend detection algorithms to identify potential market movements. Leave a massage after purchase and receive a special bonus gift.
Key Features: ⦁ Dynamic Trend Detect

Neon Trend – Advanced Trend & Momentum System Professional Multi-Timeframe Analysis Tool Neon Trend is a comprehensive trading system designed to provide clarity in modern market environments. This tool combines a Normalized Momentum Oscillator with a high-performance Multi-Timeframe (MTF) Dashboard to identify market structures across various periods. Core Features Integrated MTF Dashboard: The built-in panel automatically scans M15, H1, and H4 timeframes in real-time. It provides an instant ma
FREE
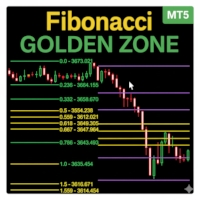
The Fibonacci Session Indicator is a powerful trading tool designed for precision scalping and intraday strategies. Thanks to Leandro López for this idea. MT4 version: https://www.mql5.com/en/market/product/150580 It automatically plots key Fibonacci levels for the New York, London, and Asia sessions, giving traders a clear view of price action dynamics across the major market sessions.
Unique "Golden Zones" are highlighted within each session, where price reacts the most. This creates highly
FREE

This indicator shows colored candles when price are strongly distorted in relation to their averages.
A good time for buy can be seen after the closing of a silver candle. The pattern becomes more reliable if the purchase is opened when the price of the candle after the silver candle is above the maximum price of the silver candle.
A good time for sell can be seen after the closing of a pink candle. The pattern becomes more reliable if the sale is opened when the price of the candle after
FREE
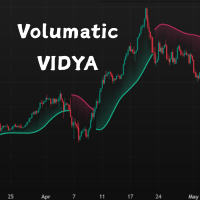
This is a custom VIDYA-based trend-following indicator for MetaTrader 5 (MT5), enhanced with ATR-band logic to adapt to market volatility. It provides dynamic trend zones and intelligent direction switching to support better trading decisions.
Unlike traditional moving averages, this indicator uses a momentum-adjusted VIDYA (Variable Index Dynamic Average) and combines it with ATR-based bands to detect trend shifts with greater precision. Features
Volatility-Adaptive Trend Logic – Uses ATR ban
FREE

This indicator finds Double Top and Double bottom Example : What is Double Top When price establishes a new high and then falls, then reverse to the same candle area of High then its considered a valid double top and vice versa for double bottom. 1. It plots and high and low on visible chart if ChartChange is set to true else it searches on new bar opening
2. If there is double top and double bottom found in visible chart window then it plots a line 3. It has options to customize text color, tex
FREE

Swing BOS Structure is a market structure indicator for MetaTrader 5.
The indicator automatically detects: • Swing High (SH) • Swing Low (SL) • Break of Structure (BOS) • Change of Character (CHoCH)
Swings are confirmed only after a defined number of candles, ensuring no repainting. BOS signals indicate trend continuation. CHoCH signals indicate a potential change in market structure and may appear less frequently depending on market conditions and timeframe.
The indicator is lightweight, fa
FREE

TRUE TIMER - Candle Countdown Real-time countdown timer (MM:SS) showing seconds until candle close on any timeframe. Features hint messages that alert you on new candles. Key Features: Precise server-time countdown. Auto color detection (light/dark backgrounds). Smart "New Candle" & timing alerts on huge movements. Works on all timeframes M1 → Monthly. Perfect for: Scalpers & precise entry timing. Please share your experience via Reviews :)
FREE
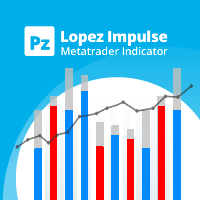
Transform your trading approach with reliable bullish and bearish patterns This indicator evaluates volatility and price directionality simultaneously, which finds the following events. Decisive and sudden price movements Large hammers/shooting stars patterns Strong breakouts backed by most market participants Indecisive but volatile market situations It is an extremely easy to use indicator... The blue histogram represents the bullish impulse The red histogram represents the bearish impulse The
FREE
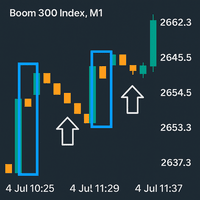
boom Spike Mitigation Zone Pro
A professional spike pattern indicator built for synthetic traders who scalp and swing Boom 500/300/1000/600/900with precision.
This indicator: Detects powerful 3-candle spike formations (Spike → Pullback → Spike) Automatically draws a clean box around the pattern Marks the entry price from the middle candle Extends a horizontal mitigation line to guide perfect sniper entries Automatically deletes & redraws the line once price touches it (mitiga
FREE

Product Name: Harmonic Confluence Indicator (Basic Edition) !!!—-Leave a 5-star review and receive a free indicator version with trade levels (limited to the first 20 people only)——!!! Headline: Automated Harmonic Pattern Scanner with Supply & Demand Confluence. Description: Unlock the power of geometric market structure with the Harmonic Confluence Indicator (Basic Edition) . This powerful tool is designed to automatically scan your charts for high-probability reversal zones based on validated
FREE

Deep Momentum Analyzer is an AI-powered trend detection indicator that visualizes market momentum through an intuitive histogram display, helping traders identify bullish and bearish market conditions with precision and clarity. Overview The Deep Momentum Analyzer transforms complex market data into clear, actionable trading signals using advanced analytical algorithms. This professional-grade indicator gives traders instant visual feedback on market momentum shifts, making it easier to time ent
FREE

Phoenix News Countdown Calendar (MT5) Real-time economic news countdown panel for MetaTrader 5. Displays upcoming high-impact events with precise countdown timers to help traders manage risk around volatility spikes. Purpose Economic news releases create unexpected volatility, slippage, and drawdown. Trading blindly into high-impact events can instantly invalidate technical setups and risk controls. The Phoenix News Countdown Calendar retrieves scheduled economic events and aligns them
FREE
Accurate Buy Sell System is a clean and reliable swing-based indicator designed to identify trend reversals and entry zones with high precision. The algorithm follows the original “Accurate Swing Trading System” concept from TradingView (by ceyhun) and has been fully re-engineered for MetaTrader 5. 1:1 match with TradingView behavior
Works on all symbols and timeframes
Clean non-repainting signals when used after candle close
Visual BUY/SELL arrows + colored dynamic trendline
Popup al
FREE
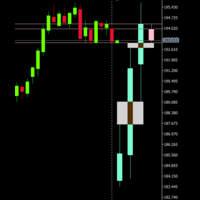
If you like this product, please give it a 5 star rating as a token of appreciation. This indicator projects Higher-Timeframe (HTF) candles onto the current chart and optionally shows their OHLC lines and Fair Value Gaps (FVGs) using ICT 3-candle logic.
Projects multiple higher timeframe candles.
Accurately preserves HTF OHLC on any lower timeframe.
Allows spacing adjustment between projected candles.
Optionally displays OHLC horizontal reference lines.
Automatically detects and draws HTF Fair
FREE
XAU Scalper MT5 MT4 Version An analytical tool for observing short-term price movements in gold pairs. The XAU Scalper Indicator provides buy and sell signals based on candle stability, RSI, and short-term momentum. It is designed to help traders identify potential entry points during brief market movements in XAU pairs. Features Candle Stability Index: Measures the proportion between candle body and wicks to assess price action reliability. RSI Index: Tracks relative strength to indicate
FREE

General Description The Fair Gap Value Indicator identifies and highlights “fair value gaps” on the MetaTrader 5 chart. A fair gap occurs when a price void forms between the low of one bar and the high of another, separated by an intermediate bar. The indicator draws colored rectangles (bullish and bearish) to emphasize these areas, providing clear visual support for price-action strategies. Key Features Bullish Gap Detection : highlights gaps between a bar’s low and the high of two bars prior w
FREE

MarketTime - Professional Multi-Timezone Clock & Session Indicator Never Miss a Trading Session Again - Monitor Global Market Hours in Real-Time MarketTime is a professional-grade indicator that displays multiple time zones, live session countdowns, and visual trading session zones directly on your MetaTrader 5 charts. In forex trading, timing is everything - knowing when major financial centers are active and when sessions overlap can significantly impact your trading success. This comprehensiv
FREE

The "Rejection Block" MetaTrader 5 Indicator offers traders a comprehensive tool for identifying and visualizing rejection candlestick patterns, commonly known as rejection blocks. These patterns are pivotal in discerning potential market reversals or continuations, making them invaluable for traders seeking to enhance their analysis. Key Features: Rejection Block Detection: The indicator diligently scans price data, pinpointing instances of rejection candlestick patterns. These patterns typical
FREE
This indicator provides a clear, at-a-glance dashboard for monitoring both the Relative Strength Index (RSI) and Stochastic Oscillator on any instrument or timeframe.
Whenever both RSI and Stochastic %K simultaneously exceed their respective overbought or oversold levels, the indicator displays an arrow signal in the indicator window.
These signals highlight strong momentum and can help traders quickly identify high-probability reversal zones. As with all my free tools, the arrow symbol can be e
FREE

For traders, monitoring price movements is a constant activity, because each price movement determines the action that must be taken next.
This simple indicator will helps traders to display prices more clearly in a larger size.
Users can set the font size and choose the color that will be displayed on the chart. There are three color options that can be selected to be displayed on the chart.
FREE

With this easy to set up indicator you can display and set alerts for the following candlestick formations: Bull Breakout, Bear Breakout, Hammer, Pin, Bullish Engulfing, Bearish Engulfing. Input parameters: ShortArrowColor: The color of the Arrows, displaying a Bearish candle formation LongArrowColor: The color of the Arrows displaying a Bullish candle formation BullishEngulfing: Disabled/Enabled/EnabledwithAlert BearishEngulfing: Disabled/Enabled/EnabledwithAlert Pin: Disabled/Enabled/Enabledw
FREE

This is the latest offering from tr1cky.com. This is a session time indicator with customisable start and finish times. The indicator draws a vertical coloured line at the start and finish of the three institutional trading time zones. The session colours are as follows: Tokyo - Red London - Green New York - Blue Times are in Coordinated Universal Time (UTC)
FREE

This indicator displays pivot points in the chart, including historical vales, and supports many calculation modes for Pivot Points and S/R levels. [ Installation Guide | Update Guide | Troubleshooting | FAQ | All Products ] It plots historical levels for backtesting purposes
It allows you to select the reference timeframe It implements different Pivot Point calculation modes It implements different SR calculation modes
It implements customizable colors and sizes
Calculation Modes The indicato
FREE

Adaptive Hull MA Pro – Trend & Momentum Filter
We value your feedback and believe that your experience with the Hull Moving Average (HMA) is essential to us and other traders. Help us continue to improve and refine our product by sharing your thoughts and insights through a review!
The Hull Moving Average (HMA) Indicator – Your Key to Smoother Trends and Profitable Trades! Are you tired of lagging and choppy moving averages that hinder your ability to spot profitable trading opportunities? Loo
FREE

Smart Finder Order Block The Ritz Smart Finder Order Block is a next-generation market structure recognition tool, designed to intelligently detect and highlight institutional footprints within price action. Built on a dynamic blend of order block theory, consolidation tracking, and adaptive volatility modeling, it provides traders with a sophisticated lens to anticipate high-probability market reactions. Core Capabilities Smart Order Block Detection Identifies both Bullish and Bearish Order Blo
FREE

Are you tired of plotting Fibonacci retracements or extensions manually? This indicator displays Fibo retracements or extensions automatically, calculated from two different price points, without human intervention or manual object anchoring. [ Installation Guide | Update Guide | Troubleshooting | FAQ | All Products ] Easy to use Manual anchoring is not needed Perfect for price confluence studies The indicator evaluates if retracements or extensions are needed Once drawn, you can manually edit t
FREE
MetaTrader Market - trading robots and technical indicators for traders are available right in your trading terminal.
The MQL5.community payment system is available to all registered users of the MQL5.com site for transactions on MetaTrader Services. You can deposit and withdraw money using WebMoney, PayPal or a bank card.
You are missing trading opportunities:
- Free trading apps
- Over 8,000 signals for copying
- Economic news for exploring financial markets
Registration
Log in
If you do not have an account, please register
Allow the use of cookies to log in to the MQL5.com website.
Please enable the necessary setting in your browser, otherwise you will not be able to log in.