Watch the Market tutorial videos on YouTube
How to buy а trading robot or an indicator
Run your EA on
virtual hosting
virtual hosting
Test аn indicator/trading robot before buying
Want to earn in the Market?
How to present a product for a sell-through
Technical Indicators for MetaTrader 5 - 20
The Moving Average Ribbon is a technical indicator that overlays a series of moving averages (MAs) on a price chart to visualize trend direction, strength, and potential reversals or reentries. It supports both Exponential Moving Averages (EMA) and Simple Moving Averages (SMA), configurable via user input.
Key Features:
Ribbon Composition: Displays 18 moving averages with periods ranging from 5 to 90 in increments of 5 (e.g., MA5, MA10, ..., MA90), plus an internal MA100 for reference. The MA5
FREE

Magic Candles is a new product that allows identifying the current market phase (uptrend, downtrend or flat). This indicator paints bars in different colors depending on the current state of the market and signals the user about trend changes with alerts. Magic Candles is perfect for trading currencies (including cryptocurrencies) and binary options.
Advantages Suitable for scalping and intraday trading. The indicator does not redraw (recalculate), signals are generated strictly on the "Clo

KT Candlestick Patterns finds and marks the 24 most dependable Japanese candlestick patterns in real-time. Japanese traders have been using candlestick patterns to predict the price direction since the 18th century. It's true that not every candlestick pattern can be equally trusted to predict the price direction reliably. However, when combined with other technical analysis methods like Support and Resistance, they provide an exact and unfolding market situation.
This indicator includes many

AstroCycles: Advanced Financial Astronomy Indicator Overview AstroCycles is a sophisticated technical analysis tool developed for the MetaTrader 5 (MQL5) platform. It bridges the gap between orbital mechanics and financial market analysis by calculating precise astronomical cycles and visualizing them directly on your trading chart. Unlike standard indicators that rely on past price data, AstroMaster utilizes high-precision astronomical algorithms (Keplerian Elements and Brown’s Lunar Theory)
FREE

Advanced momentum oscillator that automatically adjusts its period based on market volatility for more accurate overbought and oversold signals.
How It Works The indicator uses an adaptive period calculation that shortens during high volatility and lengthens during low volatility. This dynamic adjustment provides faster signals when the market is trending and reduces false signals during ranging conditions.
The RSI value is calculated based on this variable period, making it more responsive t
FREE

My Fibonacci MT5 An automated Fibonacci indicator for MetaTrader 5 that combines ZigZag swing detection with comprehensive Expert Advisor integration through a 20-buffer system. More details about data specification and EA integration: https://www.mql5.com/en/blogs/post/764114 Core Features Automated Fibonacci Detection The indicator identifies swing points using configurable ZigZag parameters and draws Fibonacci retracements and extensions automatically. It updates levels as new swing formatio
FREE
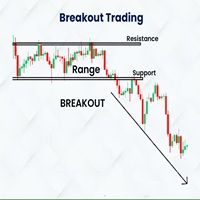
Indicador Basado en la estrategia de ruptura del rango de londres de Amaury Benedetti.
Este indicador dibuja automaticamente el rango, el maximo y minimo y sus correspondientes lineas de stoploss, entrada y takeprofit.
SE RECOMIENDA USAR EN M1 EN EL US30 (DE ACUERDO A LA ESTRATEGIA)
Los valores se pueden modificar de acuerdo a la necesidad del usuario, tambien se tienen mas configuraciones para dibujar cualquier rango en diversos horarios y con diferentes configuraciones de sl, tp, etc
Detal
FREE

FVG Smart Zones – Free Edition Fair Value Gap Detection Indicator for MetaTrader 5 (MT5) Are you looking for a real trading tool – not just another random indicator?
FVG Smart Zones – Free Edition gives you professional market insight by automatically detecting Fair Value Gaps (FVGs) and highlighting high-probability trading zones directly on your chart. Built for traders following:
Smart Money Concepts (SMC)
ICT Trading Concepts
Price Action
Supply & Demand Analysis
Institutiona
FREE

If you love this indicator, please leave a positive rating and comment, it will be a source of motivation to help me create more products <3 Key Takeaways Provides both trend and momentum signals in a single view. Entry and exit signals are based on the crossover of the RSI and Signal Line. Market Base Line offers insight into the overall trend direction. Volatility Bands help identify overbought and oversold market conditions.
FREE

AnomalyLogReturn: Statistical Edge & Mean Reversion AnomalyLogReturn is a high-precision statistical tool based on Log Returns . It identifies volatility anomalies and exhaustion points before price reversals occur. Why Log Returns? Unlike standard price action, Log Returns reveal "abnormal" movements that are invisible to the naked eye, providing a true statistical edge. Key Features: Anomaly Detection: Automatically flags when price is statistically overextended. Smart Ad
FREE

Deriv Synthetic Indices Symbol Changer Developed by Tshepo David The Symbol Changer for Deriv Synthetic Indices is a professional utility designed for MetaTrader 5 (MT5) to streamline your market analysis. Instead of manually dragging symbols from the Market Watch or right-clicking to change timeframes, this tool places a sleek, interactive dashboard directly on your chart. It is specifically pre-configured for synthetic indices (Step Index, Jump Index, and Volatility Index), but it is fully c
FREE

Product Name: Harmonic Confluence Indicator (Basic Edition) !!!—-Leave a 5-star review and receive a free indicator version with trade levels (limited to the first 20 people only)——!!! Headline: Automated Harmonic Pattern Scanner with Supply & Demand Confluence. Description: Unlock the power of geometric market structure with the Harmonic Confluence Indicator (Basic Edition) . This powerful tool is designed to automatically scan your charts for high-probability reversal zones based on validated
FREE

Multi-currency and multi-timeframe indicator MACD. The dashboard can display both the Traditional (true) MACD and the MACD which is built into MetaTrader. On the panel you can see the current state of the indicator — the direction of movement of the MACD lines, their intersection and a pop-up window with the indicator chart. In the parameters you can specify any desired pairs-symbols and timeframes. The scanner can also send notifications about lines crossing each other and about lines crossing

Swiss VWAPsimple Motivation Did not find free VWAP that works, the one that I found craseh. So I created a VWAP which calculates values only for the actual day. So computer resouces are not over stressed.
What is VWAP, how is it used? VWAP stands for Volume Weighed Average Price, it calculates the running sum of tick volume and the runnung sum of price times tickvolume. The division of these sums result in a weighed price (Sum P*V/Sum V). The calculation starts normally at midnight. The values
FREE

This indicator is a simple tool to spot a possible trend.
When the ribbon below the price bars, It will turn to Green color and the trend is seen to be bullish When the ribbon above the price bars, it will turn to Red color and the trend is seen to be bearish. It can be used a either Entry Signal Exit Signal or trailing stop, so it is very versatile. By default color : Green is UP trend and Red is Down trend and this work perfect with Bar4Colors.ex5
FREE

This indicator is especially for the binary trading. Time frame is 1 minutes and exp time 5 or 3 minutes only. You must be use martingale 3 step. So you must put lots size is 10 % at most. You should use Mt2 trading platform to connect with my indicator to get more signal without human working. This indicator wining rate is over 80% but you may get 100% of profit by using martingale 3 step. You should use MT2 Trading Platform to connect meta trader platform and binary platform . You can get mt2
FREE

Advanced Market Analysis Tool : Dive into market depth with the MT5 Volume Profile Indicator. Seamless MT5 Integration : Perfectly compatible with the MT5 platform. Enhances Pro Thunder v9 : Integrates smoothly with Pro Thunder v9 for deeper market insights. Detailed Volume Analysis : Explore market dynamics through in-depth volume data. ️ Simple Installation : Easy-to-follow setup steps for quick integration with MT5. Efficient Single Chart Application : Best used on a single c
FREE
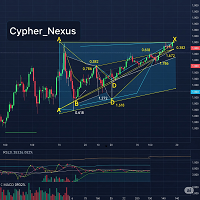
Cypher Pattern Detector A tool for automatic detection of Cypher harmonic patterns (XABCD) in financial charts. Overview The Cypher Pattern Detector identifies both bullish and bearish Cypher harmonic patterns in real time. It applies Fibonacci ratio validation and a quality scoring system to highlight patterns that closely match the defined structure. This helps traders observe and analyze potential market structures more consistently, without the need for manual drawing. Main Features Pattern
FREE

Correlation Matrix Pro - Multi Currency Pairs Hedge Scanner
Understand the relationships between currency pairs in real-time!
A powerful analysis tool that helps you visualize statistical relationships between up to 6 currency pairs simultaneously. Perfect for portfolio management, risk diversification, and hedging strategies.
KEY FEATURES
- Real-time Pearson correlation using log returns - Monitor up to 6 currency pairs simultaneously - Automatic timeframe detection - Adjustable lookback
FREE
https://www.mql5.com/en/users/gedeegi/seller
The "RSI+ with 123 Fractals" logo is designed to provide a clear and professional visual representation of a complex technical indicator, focused on precise market analysis and reliable patterns. Each element in the design is crafted to reflect the philosophy and strengths of the indicator within the trading world. Design Elements: "RSI+" Text in Bold and White:
The main "RSI+" text is chosen to be the focal point, with a bold and clear font. The us
FREE

Opening Range Indicator
Idea Toby Crabel introduced this way of trading in the ealy ninties in his book "Day Trading with Short Term Price Patterns and Opening Range Breakout". In simple terms this means to trade the brekouts from the limits of the first trading hour with the stop loss at the opposite side. I.e. if the first hourly candle meausres 40 points (Crabel calls this the "stretch") you set the stop loss at breakout level minus 40 points and the take profit at the breakout level plus 4
FREE

The Spots Indicator can be used for Entering and Exiting your trades based on the common candlestick patterns such as: engulfing, hanging man, doji etc. It is designed to publish desktop and mobile notification every time a signal is triggered. However, it is worth noting that this indicator is recommended to be used with other indicator for confirming the entries. It is best to use it with the Investment Castle Trend Lines indicator and the Supply and Demand indicator .
FREE

Explosion Signal Indicator analyzes the market for sharp changes in volatility and volume that often precede significant price movements. The indicator uses the ratio of short-term and long-term ATR to assess current volatility relative to the average level. Simultaneously, it monitors current volume compared to the average over a specified period.
When the volatility or volume exceeds the defined thresholds, the indicator determines the direction of movement through momentum calculation — the
FREE

We all know that the start of an H4 candle can be 'shifted' depending on the broker. I wrote an indicator that draws candles "shifted" to the desired value. Plus, it draws H4 candles on smaller timeframes too. Works on timeframes up to H4, allowing for a clear comparison with the broker's results. There's a separate option to customize the candlestick body and outline fill. You can also customize the drawing for a specific period on history.
FREE

Indicator Introduction: The indicator comes from network ,It is more stable relative to RSI or CCI. You can set the indicator to send emails/notifications/alerts when the previous bar has an up or down arrow, you can specify the text of emails by inputing string into the parameter box of "UpMessages/DownMessages". It can be used to analyze market trend and design new expert that is based on trend. If the indicator below the axis ,this is a buy zone. The trend indicator is suitable for M1 and ab
FREE

This is one of the most popular and highly rated volatility index (VIX) indicators on the market. It provides the same readings as the VIX does for stock indexes. However, this indicator works across all asset classes. VIX Fix Finds Market Bottoms. This indicator is not for inexperienced traders. Use it for day and swing trading. MT4 Version - https://www.mql5.com/en/market/product/112238 Join To Learn Market Depth - https://www.mql5.com/en/channels/suvashishfx
Bernard Baruch summe
FREE

Infinity Predictor MA
Infinity Predictor MA is a next‑generation forecasting indicator that transforms the traditional Moving Average into a powerful predictive tool. Unlike standard MAs that only smooth past data, this indicator projects the moving average line up to 40 bars into the future, giving traders a unique perspective on potential market direction.
The engine behind Infinity Predictor MA combines multiple advanced regression models to capture both smooth trends and sudden market shi
FREE
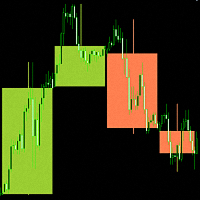
"Candlesticks MTF 5" is an informational indicator that displays "Japanese Candlesticks" . The indicator analyzes and determines the opening and closing times of candles from higher time frames.
An algorithm has been developed for the "Candlesticks MTF 5" indicator that corrects the discrepancy between the opening and closing times of candles from higher time frames. For example, if the opening time of a candle on a weekly time frame is the 1st of the month, and on the smaller time frame this
FREE

The Weis Waves RSJ Indicator sums up volumes in each wave. This is how we receive a bar chart of cumulative volumes of alternating waves. Namely the cumulative volume makes the Weis wave charts unique. It allows comparing the relation of the wave sequence characteristics, such as correspondence of the applied force (expressed in the volume) and received result (the price progress).
If you still have questions, please contact me by direct message: https://www.mql5.com/en/users/robsjunqueira/
FREE
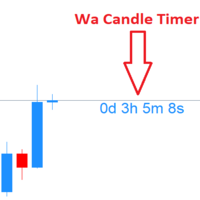
Wa Candle Timer MT5 Wa Candle Timer MT5 is a powerful and user-friendly indicator designed to display the remaining time until the next candle forms on your MT5 chart. This tool helps traders stay aware of candle closure times, allowing for better trade execution and decision-making. Key Features :
Displays the countdown timer for the current candle.
Changes color when the remaining time falls below a user-defined percentage.
Customizable alert when the candle reaches a specified perce
FREE

Smart Entry Levels - Fractal and ATR Based Indicator Smart Entry Levels identifies key support and resistance zones using classical fractal detection and ATR-based volatility measurement. The indicator is designed for clarity, stability, and compliance with MQL5 Market rules. Features Upper Zone - Resistance area based on recent fractal highs Lower Zone - Support area based on recent fractal lows ATR-based sizing - Zones adapt dynamically to market volatility with selectable timeframe Non-repain
FREE
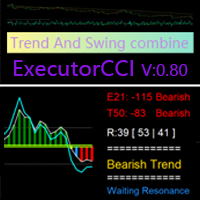
Based on the CCI Trend-Following Principle, Improved to Identify Trend Reversals
This indicator is designed to confirm trends after identifying them using the ( Executor Trend Indicator ) indicator, making it a tool for both trend confirmation and reversal detection. Features Green and Red Histogram: Represents the development of bullish (green) or bearish (red) trends in the current timeframe. Blue Line and Green Histogram (Bullish Confirmation): When the blue line rises above +10
FREE
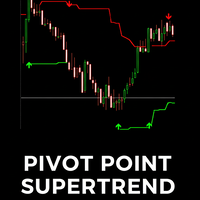
The Pivot Point Supertrend indicator is a technical analysis tool designed for the MetaTrader 5 (MT5) platform. It combines two popular analytical methods: Pivot Points: Uses significant historical price highs and lows to identify potential support and resistance zones. These points are objective and stable. Supertrend: A well-known trend-following indicator that helps identify the current market trend and provides dynamic stop-loss levels. Indicator's Goal: By using the stability of Pivot Point
FREE

Phoenix News Countdown Calendar (MT5) Real-time economic news countdown panel for MetaTrader 5. Displays upcoming high-impact events with precise countdown timers to help traders manage risk around volatility spikes. Purpose Economic news releases create unexpected volatility, slippage, and drawdown. Trading blindly into high-impact events can instantly invalidate technical setups and risk controls. The Phoenix News Countdown Calendar retrieves scheduled economic events and aligns them
FREE

Neon Trend – Advanced Trend & Momentum System Professional Multi-Timeframe Analysis Tool Neon Trend is a comprehensive trading system designed to provide clarity in modern market environments. This tool combines a Normalized Momentum Oscillator with a high-performance Multi-Timeframe (MTF) Dashboard to identify market structures across various periods. Core Features Integrated MTF Dashboard: The built-in panel automatically scans M15, H1, and H4 timeframes in real-time. It provides an instant ma
FREE

Lot Size Calculator - Smart Risk Management Tool
The Lot Size Calculator is a simple but powerful MetaTrader indicator that helps traders manage risk with precision. Instead of guessing your position size, this tool instantly calculates the exact lot size you need based on your account equity, chosen risk percentage, and reward ratio (1:1, 1:2, etc.).
Features:
Input your account equity and risk % per trade Supports both long (buy) and short (sell) trades Automatically adjusts for diffe
FREE

Setup Tabajara was created by a Brazilian trader known as "The OGRO of Wall Street" .
The idea of this setup is to indicate to the trader the current trend of prices and the type of operation should be looked for in the graph.
Operation
It does this through the relation of the closing price position and the of 20 periods, by painting the candles in 4 possible colors : Green -> Price rising in upward trend (Search entry points for PURCHASE) Black -> Price correcting in Bullish Trend (Sear
FREE

This indicator was developed to support multiple timeframe analysis. In the indicator settings, the user can set the color, width, and style of the horizontal lines for each timeframe. This way, when the horizontal lines are inserted into the chart, they will be plotted with the timeframe settings.
MTF Lines also allows visibility control of another objets like rectangles, trend lines and texts.
This is a product developed by Renato Fiche Junior and available to all MetaTrader 4 and 5 users!
FREE

- Displays horizontal lines for Previous Day High (PDH) and Previous Day Low (PDL) on the chart. - Customizable line colors via input parameters. - Sends sound alerts, pop-up notifications, and mobile push notifications upon the initial crossover of PDH or PDL. - Alerts are triggered only once per crossover event; they re-trigger only if the price moves away and re-crosses after a specified minimum interval. - Automatically updates the PDH/PDL levels at the start of each new day. - All indicator
FREE
VWAP (Volume Weighted Average Price) indicator with ±1σ and ±2σ bands calculated from real traded volume. The start and end times of the session are fully configurable, as well as the standard deviation levels and the number of bands displayed. It shows the day’s volume-weighted average price and helps traders identify value areas, price extremes, and intraday trading opportunities with precision.
FREE

BEHOLD!!!
One of the best Breakout Indicator of all time is here. Multi Breakout Pattern looks at the preceding candles and timeframes to help you recognize the breakouts in real time.
The In-built function of supply and demand can help you evaluate your take profits and Stop losses
SEE THE SCREENSHOTS TO WITNESS SOME OF THE BEST BREAKOUTS
INPUTS
MaxBarsback: The max bars to look back
Slow length 1: Period lookback
Slow length 2: Period lookback
Slow length 3: Period lookback
Slow leng
FREE

Мой самый популярный и востребованный продукт здесь https://www.mql5.com/ru/market/product/41605?source=Site+Market+Product+From+Author#
Индикатор стрелочник идеален для торговли в боковике, очень точно показывает моменты перекупленности и перепроданности инструмента, с дополнительными фильтрами также можно использовать для торговли по тренду. На экран выводятся стрелки сигнализирующие о развороте тренда, направление стрелки показывает дальнейшее направление торговли, также имеется звуковое о
FREE

UPDATED The Non-Repaint zones is a time base indicator that scans for possible reversal of the market for perfect entry. It read the history and draws the possible zone for our comfort. The indicator possesses four different zones that read the history of the market over 10,000 previous bars and predict the possible entry point. It rescans every market trend change to give us the possible zone, it is used for trading all types of markets and does not repaint. The indicator has the following inp
FREE

ATR Smart Levels – Clarity on where the market can realistically move Many traders lose not because of their strategy, but because they enter at bad levels: too early, in the middle of the range, or without a proper risk-reward structure. ATR Smart Levels solves this problem with a single indicator and three simple buttons. The indicator automatically draws three ATR-based target zones (TP1, TP2, TP3) above and below the current price. You immediately see whether a trade makes sense and whether
FREE

An MT5 divergence scanner that automatically finds divergence / hidden divergence between price and a chosen oscillator , then draws the matching trendlines/channels in the indicator window and can alert you when the line is crossed. Key features (simple) Auto Divergence Detection Bullish divergence : price makes a lower low while oscillator makes a higher low (possible reversal up). Bearish divergence : price makes a higher high while oscillator makes a lower high (possible reversal down). Hidd
FREE

Full Description Overview
The Quad Hull Moving Average Trend Visualizer is a sophisticated trend-following tool that plots four independent Hull Moving Average (HMA) lines on a single chart. The Hull Moving Average is world-renowned in the trading community for its unique ability to reduce price lag while simultaneously increasing smoothness, making it superior to traditional SMAs or EMAs. By using four distinct periods, this indicator allows traders to see the "Big Picture" and the "Immed
FREE

DESCRIPTION:
-----------
KS Dynamic Trendlines is an advanced indicator that automatically detects swing points
and draws intelligent trendlines that adapt to market conditions in real-time.
KEY FEATURES:
------------
Automatic swing high/low detection
Dynamic trendline generation connecting swing points
Real-time break detection - broken trendlines disappear automatically
Next strongest trendline appears when current one breaks
Multi-timeframe support - detect on H4, display on M15
Parallel t
FREE

GEN Ichimoku Signal Developer: gedeegi Overview GEN Ichimoku Signal is a technical indicator for the MetaTrader 5 platform. It combines two different trend analysis systems, Ichimoku Kinko Hyo and HalfTrend, into a single visual tool. The primary function of the indicator is to color the chart's candlesticks based on whether the conditions of these two systems are in alignment. The indicator provides a visual representation of market conditions by displaying one of three colors: one for aligned
FREE
[ MT4 Version ] Are you tired of spending months on demo or live accounts to test your trading strategies? The Backtesting Simulator is the ultimate tool designed to elevate your backtesting experience to new heights. Utilizing Metatrader historical symbol information, it offers an unparalleled simulation of real market conditions. Take control of your testing speed, test ideas quickly or at a slower pace, and witness remarkable improvements in your testing performance. Forget about wasting tim

Stochastic RSI makes a stochastic calculation on the RSI indicator. The Relative Strength Index (RSI) is a well known momentum oscillator that measures the speed and change of price movements, developed by J. Welles Wilder.
Features Find overbought and oversold situations. Sound alert when overbought/oversold level is reached. Get email and/or push notification alerts when a signal is detected. The indicator is non-repainting. Returns buffer values for %K and %D to be used as part of an EA. (se
FREE

Was: $49 Now: $33 Blahtech Better Volume provides an enhanced version of the vertical volume bars. Each bar is compared to the previous 20 bars. Depending on its volume, range and volume density it will be assigned a state and colour. Low Volume – Minimum volume High Churn – Significant volume with limited movement Climax Neutral – High volume with unclear direction
Climax Up – High volume with bullish direction Climax Dn – High volume with bearish direction Climax Churn – High vol

Pivot Point Slim Indicator Overview A professional-grade pivot point indicator equipped with 6 types of pivots. With a clean, easy-to-read design, it automatically displays important support and resistance levels on your chart. Customizable Display Settings Individual color settings for each level (P, S1-S5, R1-R5) Show/hide toggle for each level Label display on/off Price display on/off Label position (left/right) Label offset adjustment (spacing between lines and text) Line width adjustment Hi
FREE

Level Breakout Indicator is a technical analysis product that works from upper and lower boundaries, which can determine the direction of the trend. Works on candle 0 without redrawing or delays.
In its work, it uses a system of different indicators, the parameters of which have already been configured and combined into a single parameter - “ Scale ”, which performs gradation of periods.
The indicator is easy to use, does not require any calculations, using a single parameter you need to select

Adiciona marca d'água com nome do ativo em negociação. Pode ser ajustado definindo tamanho da fonte e coloração do texto. Testado com vários ativos do mercado B3 e Forex Adione ao gráfico e configure de acordo com a necessidade. Caso tenha problemas sinta-se a-vontade para nos avisar e providenciaremos a correção logo que possível. ______________________________
FREE

Was: $69 Now: $49 Blahtech VWAP - Volume Weighted Average Price (VWAP) is the ratio of price to total volume. It provides an average price over a specified time interval. Links [ Install | Update | Documentation ] Feature Highlights
Configurable VWAP Line Sessions, intervals, anchored or continuous Previous day settlement line Standard Deviation bands Alerts at bar close or real time Automatic Broker or Tick volumes Significantly reduced CPU usage
Input Parameters
Expert Advisor Mo

This dashboard discovers and displays the Supply and Demand zones on the chart, both in scalping and long term mode, depending on your trading strategy for the selected symbols. In addition, the scanner mode of the dashboard helps you to check all desired symbols at a glance and not to miss any suitable positions / MT4 version Free indicator: Basic Supply Demand
Features
Allows you to view trading opportunities on multiple currency pairs , giving you a clear and concise view of all p
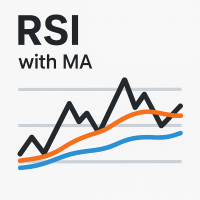
The RSI with Moving Averages indicator combines the classic Relative Strength Index with customizable moving averages, offering deeper insights into market momentum and trend direction. By smoothing the RSI curve with short- and long-term averages, traders can better distinguish true reversals from noise. This tool highlights overbought and oversold levels, reveals divergences between price and momentum, and confirms entry or exit points with enhanced accuracy. Its adjustable parameters allow tr
FREE

Product Name: Auto Trend Pattern Pro [Subho - India] Short Description:
An advanced Price Action tool that automatically detects and draws Trend Channels, Wedges, and Triangles with a live Dashboard. Full Description: Auto Trend Pattern Pro is a sophisticated technical indicator designed for MetaTrader 5. It automates the complex task of drawing Trend Lines and Channels. By analyzing historical price action, the indicator identifies the most accurate "Best Fit" channels for both short-term
FREE

Idea extracted from the books by Anna Coulling and Gavin Holmes using Volume and Spread Analysis (VSA) techniques coupled with Al Brooks' expertise with Price Action these candles are magical, identify the exact moment
of the performance of the big players are acting in the market represented by the colors:
1) Red Candles we have an Ultra High activity,
2) Candles Orange we have a Very High Activity
3) Candles Yellow we have one High Activity
4) White Candles represent normal activity in
FREE
Pip Value Calculator - Instant Risk Assessment on Your Chart This powerful and lightweight utility instantly calculates the precise monetary value for any pip movement, displaying it directly on your chart so you can assess risk and potential profit at a glance. At its core, the indicator's sophisticated calculation engine runs silently with every price tick, ensuring the information you see is always up-to-date. It automatically detects the instrument you are trading—whether it's a Forex pair,
FREE

TransitX1 indicator is very useful, with unlimited signals and works on all the timeframes and all the piers. TransitX1 draws two trend lines very short trendlines (+/-20 bars) which can be considered as support and resistance. The support is in red trendline and the resistance is in green trendline. TransitX1 gives buying and selling signals, with only 3 being previous signals and the 4th one being the current signal. Buying signals are in green arrows and are always on the support trendline an
FREE

Spline Searcher MT5 — Multi-Currency Indicator for Early Detection of Price Splines and Points of Interest An auxiliary tool for automatic detection and visualization of nascent stages of complex price formations. The indicator is intended exclusively for manual trading and suits traders who experiment with early recognition of advanced market patterns or trends—of which simpler formations may be a part. It identifies up to six types of initial formations: parabolas with peaks at the far or nea
FREE

Smart Money Concepts Indicator - Professional ICT/SMC Trading System Transform Your Trading with Institutional-Grade Smart Money Analysis Unlock the power of Smart Money Concepts (SMC) and Inner Circle Trader (ICT) methodologies with this advanced indicator that identifies high-probability entry zones and intelligently sets Take Profit targets at the next Point of Interest (POI). Stop guessing where to exit your trades - let institutional logic guide you to the next Order Block or key market
FREE
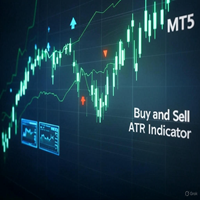
Buy and Sell ATR Indicator The Buy and Sell ATR Indicator is a powerful trend-following tool for MT5, combining ATR-based trend detection with RSI confirmation. It plots a dynamic trend line and generates clear buy (blue arrows) and sell (red arrows) signals when price action confirms a trend over a user-defined number of candles. A unique flat market filter, based on average ATR, prevents signals in low-volatility conditions. Customize ATR periods, RSI levels, signal thresholds, and arrow styl
FREE
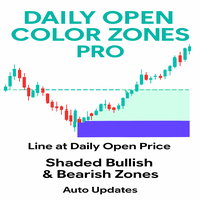
This indicator is a professional tool designed to plot the Daily Open Line and instantly shade the bullish and bearish price zones around it. Instead of leaving traders guessing, it delivers a clear visual map of market sentiment from the very first of the day. Its goal: to help you instantly identify whether the market is trading above or below the daily open — a key reference point for intraday strategies.
The indicator automatically draws a horizontal line at the daily open price and shades
FREE

The Next Bar Countdown is a highly accurate and high-performance time indicator for MetaTrader 5, specially designed to show traders the time remaining until the current candle closes. Precise timing is crucial for many trading strategies, especially when decisions must be made immediately upon the opening of a new candle. Key features: The indicator offers a variety of features that go beyond standard timers: Dual timeframe display: You can simultaneously display the countdown for the current c
FREE

Core Purpose A permanent crosshair indicator designed exclusively for MetaTrader 5 (MT5). It addresses key limitations of MT5's default crosshair, including the need for manual activation, automatic disappearance on click, and solid lines obscuring price bars. This indicator optimizes chart analysis by delivering a smooth, professional-grade crosshair experience on MT5. Key Features Automatic activation: Enabled immediately after loading, replacing the default Ctrl+F function. The crossha
FREE

"Pattern 123" is an indicator-a trading system built on a popular pattern, pattern 123.
This is the moment when we expect a reversal on the older trend and enter the continuation of the small trend, its 3rd impulse.
The indicator displays signals and markings on an open chart. You can enable/disable graphical constructions in the settings.
The indicator has a built-in notification system (email, mobile terminal, standard terminal alert).
"Pattern 123" has a table that displays signals from se
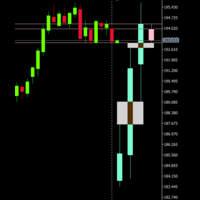
If you like this product, please give it a 5 star rating as a token of appreciation. This indicator projects Higher-Timeframe (HTF) candles onto the current chart and optionally shows their OHLC lines and Fair Value Gaps (FVGs) using ICT 3-candle logic.
Projects multiple higher timeframe candles.
Accurately preserves HTF OHLC on any lower timeframe.
Allows spacing adjustment between projected candles.
Optionally displays OHLC horizontal reference lines.
Automatically detects and draws HTF Fair
FREE

Welcome to HiperCube Renko Candles Discount code for 25% off at Darwinex Zero: DWZ2328770MGM This indicator provide you a real info of market transform it to Renko Candle Style. Definition Renko charts are a type of financial chart that measures and plots price changes, using bricks (or bars) to represent price movements . Unlike traditional candlestick charts, Renko charts do not display time-based information, focusing solely on price fluctuations. Features: Indicator in separate windows
FREE
The MetaTrader Market offers a convenient and secure venue to buy applications for the MetaTrader platform. Download free demo versions of Expert Advisors and indicators right from your terminal for testing in the Strategy Tester.
Test applications in different modes to monitor the performance and make a payment for the product you want using the MQL5.community Payment System.
You are missing trading opportunities:
- Free trading apps
- Over 8,000 signals for copying
- Economic news for exploring financial markets
Registration
Log in
If you do not have an account, please register
Allow the use of cookies to log in to the MQL5.com website.
Please enable the necessary setting in your browser, otherwise you will not be able to log in.