Watch the Market tutorial videos on YouTube
How to buy а trading robot or an indicator
Run your EA on
virtual hosting
virtual hosting
Test аn indicator/trading robot before buying
Want to earn in the Market?
How to present a product for a sell-through
Technical Indicators for MetaTrader 5 - 10

This is Heiken Ashi smoothed version, where you can choose on what type smoothness you want to make your strategy base. You can choose between EMA or MA, on the period you want. And you can choose colors.
Definition:
The Heikin-Ashi technique averages price data to create a Japanese candlestick chart that filters out market noise. Heikin-Ashi charts, developed by Munehisa Homma in the 1700s, share some characteristics with standard candlestick charts but differ based on the values used to cre
FREE

Fair Value Gap Finder detects fair value gaps and generates a signal when price returns to one. Set the minimum and maximum fvg size, customize the colors, style, and length, then let the indicator highlight them for you.
Key Features: Automatic FVG highlights - The indicator detects all fair value gaps that fit your criteria and marks them on the chart.
Entry Signal - A signal is created whenever price retests a fair value gap.
Notification - Alerts notify you when a fair value gap or a new
FREE
CLICK HERE TO SEE ALL MY FREE PRODUCTS
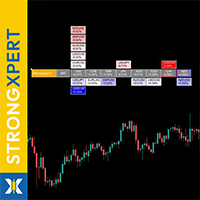
StrongXpert is your precise real-time strength monitor for the global currency market. It was developed to show you where capital is actually flowing – and where it is leaving the market . The indicator measures the relative strength of all major currencies (USD, EUR, GBP, JPY, AUD, CAD, CHF, NZD) and transforms complex price movements into a simple, readable visual dashboard – directly on the chart. Identify the strongest and weakest currency within seco
FREE

High Low Today (MT5) is a free, easy-to-use MetaTrader 5 indicator that displays the current day’s High and Low price levels on your chart. It even offers optional push notifications to alert you when the price touches or breaks these key levels. With a clean and minimalist design, it provides valuable intraday insights without cluttering your chart. Marks the current day’s High and Low on the chart (key intraday support/resistance levels) Clean, lightweight, and unobtrusive – only the essenti
FREE

"TPA Sessions" indicator is a very important tool to complement "TPA True Price Action" indicator . Did you ever wonder, why many times the price on your chart suddently turns on a position you can't explain? A position, where apparently no support or resistance level, or a pivot point, or a fibonacci level is to identify? Attention!!! The first run of the TPA Session indicator must be in the open market for the lines to be drawn correctly.
Please visit our blog to study actual trades with

Introducing Order Blocks Breaker , a brand-new way to identify and leverage order blocks in your trading strategy. After developing multiple order block tools with unique concepts, I’m proud to present this tool that takes things to the next level. Unlike previous tools, Order Blocks Breaker not only identifies order blocks but also highlights Breaker Order Blocks —key areas where the price is likely to retest after a breakout. MT4 - https://www.mql5.com/en/market/product/124101/ This t
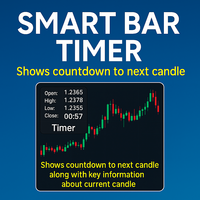
The Enhanced Bar Timer is a versatile and customizable indicator for MetaTrader 5 (MT5) that provides real-time information about the current candle, including a countdown timer for the next bar, candle details, volume, and spread. Displayed in the user-specified corner of the chart window, this indicator offers a multi-line or single-line format, allowing traders to monitor critical market data at a glance, enhancing decision-making and trading efficiency. Key Features Real-Time Bar Timer : Dis
FREE

This indicator shows the TLH and TLL and some trendlines that allow us to estimate the trend of market. It also shows the values of the angles of the lines in percentage in points (pip) , the standard deviation, and the trend of each line, and when it breaks the lines of support and resistance (TLH and TLL). And finally, it also shows the points identified as supports and resistances through the fractal algorithm in the graph. The high and low trend lines are supported by the highs and lows, th
FREE

Desenvolvido por smart2trader.com Smart Super Trend é um indicador avançado de identificação de tendências, desenvolvido para detectar com alta precisão movimentos de alta e baixa do mercado . O indicador Super Trend da Smart utiliza algoritmos adaptativos combinados com filtros de volatilidade , proporcionando sinais mais limpos e alinhados à dinâmica real do preço. Conta ainda com um sistema inteligente de monitoramento que notifica, em tempo real, sempre que ocorre uma mudança de tendência ,
FREE

Candle Timer Indicator is a custom tool designed for the MetaTrader 5 (MQL5) trading platform. Its primary purpose is to display a moving timer on the chart, indicating the remaining time before the current candle closes. This feature is particularly useful for traders who need precise tracking of candle closing times for their technical analysis strategies. My indicators for free. I onl
FREE

This is a very simple indicator and easy to use for everyone. However, it's very visual, useful and effective. It is suitable for every Forex symbol and any timeframe. But from my testing and investigation, I do not recommend to use it with timeframes M1, M5, M15. Setting. - Choose alert On/Off ( default ON). - Select time ( seconds) between 2 alerts . Default is 30 seconds How it works? Uptrend—When color of the bar is Green. Downtrend—When color of the bar is Orange. A reversal happens if co
FREE

SynteticStructure MT5 SynteticStructure is a high-performance technical indicator designed for real-time market structure identification. This advanced algorithm analyzes price action and pivot points to project dynamic Support & Resistance zones (Supply & Demand) directly onto your chart. The indicator utilizes sophisticated swing validation logic to detect key HH/LL (Higher Highs / Lower Lows) levels. Unlike static indicators, SynteticStructure projects interest rectangles that auto
FREE

This is Wilder's ADX with cloud presentation of DI+ & DI- lines. Features
4 standard lines of the ADX indicator: DI+, DI-, ADX, ADXR cloud presentation of DI+/DI- lines with transparent colors applicable to all time-frames and all markets
What Is ADX
J. Welles Wilder Jr., the developer of well-known indicators such as RSI, ATR, and Parabolic SAR, believed that the Directional Movement System, which is partially implemented in ADX indicator, was his most satisfying achievement. In his 1978 book,
FREE

This indicator is an interactive Elliott Wave labeling tool for MetaTrader 4 and 5.
It allows the user to manually place wave labels directly on the chart by selecting a label size, color, and wave type (ABC corrections, 5-wave impulses, or WXY structures) from an on-chart menu.
With a single click on the chart, the indicator sequentially places the appropriate wave labels at the chosen price and time, helping traders visually map and organize Elliott Wave structures.
Rate it if you like it!
FREE

Pivot trading:
1.pp pivot
2. r1 r2 r3, s1 s2 s3
Necessary for traders: tools and indicators Waves automatically calculate indicators, channel trend trading Perfect trend-wave automatic calculation channel calculation , MT4 Perfect trend-wave automatic calculation channel calculation , MT5 Local Trading copying Easy And Fast Copy , MT4 Easy And Fast Copy , MT5 Local Trading copying For DEMO Easy And Fast Copy , MT4 DEMO Easy And Fast Copy , MT5 DEMO
Cooperation QQ:556024"
Cooperation wechat
FREE

I recommend you to read the product's blog (manual) from start to end so that it is clear from the beginning what the indicator offers. The indicator comes with a fully functional Expert Advisor. The indicator identifies when a divergence occurs between price and an oscillator/indicator. It identifies both regular and hidden divergences. It has a RSI, Bollinger Bands and ATR filter options which makes it possible to filter out only the strongest setups. The indicator also offers options to

The indicator looks for consolidation (flat) in the market at a certain time, builds a box-channel and marks levels indented from it for a breakdawn. After crossing one of the levels, the indicator marks the zone for take profit and calculates the corresponding profit or loss in the direction of this entry on the panel. Thus, the indicator, adjusting to the market, finds a flat area of the market, with the beginning of a trend movement to enter it. Version for MT4: https://www.mql5.com/en/market
FREE

This indicator displays Pivot-Lines, preday high and low, preday close and the minimum and maximum of the previous hour. You just have to put this single indicator to the chart to have all these important lines, no need to setup many single indicators.
Why certain lines are important Preday high and low : These are watched by traders who trade in a daily chart. Very often, if price climbs over or falls under a preday low/high there is an acceleration in buying/selling. It is a breakout out of a
FREE

AW Super Trend -This is one of the most popular classic trend indicators. It has a simple setting, allows you to work not only with the trend, but also displays the stop loss level, which is calculated by this indicator. Benefits:
Instruments: Currency pairs , stocks, commodities, indices, cryptocurrencies. Timeframe: М15 and higher. Trading time: Around the clock. Shows the direction of the current trend. Calculates the stop loss. It can be used when working with trading. Three types of noti
FREE

The New York Range Indicator is a session based analysis tool developed for traders applying ICT (Inner Circle Trader) concepts, Smart Money trading, and institutional price action methods . Designed specifically for the New York session, this indicator captures the price range between 12:00 and 14:00 GMT , a critical period that overlaps with the London Close and New York Open . It identifies session highs and lows , detects Fair Value Gaps (FVGs) , and highlights potential liquidity sweep zone

The Matrix Arrow Indicator Multi Timeframe Panel MT5 is a free add on and a great asset for your Matrix Arrow Indicator MT5 . It shows the current Matrix Arrow Indicator MT5 signal for 5 user customized timeframes and for 16 modifiable symbols/instruments in total. The user has the option to enable/disable any of the 10 standard indicators, that the Matrix Arrow Indicator MT5 consists of. All of the 10 standard indicators attributes are also adjustable, as in the Matrix Arrow Indicat
FREE

The Entry IQ Indicator is a sophisticated technical analysis tool engineered to assist traders in pinpointing high-probability entry points for both long and short market positions. This advanced trading utility leverages a combination of dynamic price boxes, equilibrium zones, and proprietary trend detection algorithms to provide a comprehensive analysis of market trends and price action. By synthesizing these elements, the indicator offers a robust framework for understanding market sentiment
FREE

Trend Battle Indicator
Overview The Trend Battle Indicator is a professional technical analysis tool that reveals the battle between buyers (Bulls) and sellers (Bears) in the market through a comprehensive dashboard. Using an intuitive visual interface, the indicator offers a unique perspective on market power dynamics by analyzing the last twenty bars to provide precise insights into momentum and directional strength. Additionally, the panel provides automatic real-time updates for bars in for

GDXM Period Open Line The GDXM Period Open Line is a powerful institutional tool designed for traders who follow ICT concepts , SMC (Smart Money Concepts) , or price action strategies that rely on time-based price levels. In institutional trading, the opening price of a specific period (Yearly, Monthly, Weekly, or Daily) serves as the "Equilibrium" point. Trading above the opening price is considered a premium (seek shorts), and trading below is considered a discount (seek longs). This indicator
FREE

The indicator displays the orders book, as well as increases its depth, remembering the location of orders that have gone beyond the current "window" view.
Indicator capability Display the levels of open positions. Simulation of placing/cancelling/editing pending orders directly in the displayed orders book.
Indicator features The orders book display works only on those trading symbols for which it is broadcast by the broker. To reset the information about the rows that were recorded in the Sm
FREE

Introducing Koala FVG for MT5 – Your Professional Fair Value Gap (FVG) Pattern Indicator Join Koala Trading Solution Channel in mql5 community to find out the latest news about all koala products, join link is below : https://www.mql5.com/en/channels/koalatradingsolution Koala FVG: Your Path to Precision Trading on MT5 Unlock the power of the Fair Value Gap (FVG) pattern with Koala FVG – a cutting-edge indicator designed for MetaTrader 5. For a limited time, access this professional tool for fr
FREE
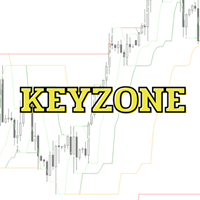
Keyzone is an indicator designed to identify support and resistance levels for trading, categorized into four key levels: 3, 8, 21, and 89. These levels are derived from an advanced adaptation of the Smart Money Concept (SMC) , ensuring high efficiency while maintaining simplicity. With its minimalist yet powerful design, Keyzone can be seamlessly applied to various trading styles, including:
Scalping – Quick, high-frequency trades Swing Trading – Capturing medium-term price movements Trend Foll
FREE
AlgoRhythm ZLSMA - The Ultimate Trend Trading Solution Unlock the power of precision trading with AlgoRhythm ZLSMA , an advanced technical indicator designed to deliver razor-sharp trend signals. Engineered for MetaTrader 5, this cutting-edge Zero Lag Smoothed Moving Average (ZLSMA) combines sophisticated smoothing techniques, multi-timeframe analysis, and dynamic bands to give traders a competitive edge in any market. Whether you're a scalper, swing trader, or long-term investor, AlgoRhythm ZLS
FREE

This indicator automatically identifies market structure and plots Fibonacci retracement levels in real time.
It detects key swing highs and lows to mark structural points such as higher highs, higher lows, lower highs, and lower lows, helping traders quickly understand trend direction and structural shifts.
Based on the detected structure, the indicator dynamically draws Fibonacci levels, allowing traders to easily spot potential retracement, pullback, and entry zones without manual drawing.

Limited Time Offer! Just $59 — valid until the end of this month! Trinity-X : The Next Generation of Trend Intelligence Imagine having a professional market analyst sitting beside you 24/7 — one who never gets tired, never misses a signal, and speaks your language.
That’s exactly what Trinity-X delivers. This AI-optimized, rule-based trend intelligence system is built on years of trading expertise, powered by a proprietary Rule-Based AI Optimization Engine .
It doesn’t just react to price movem

Dark Inversion is an Indicator for intraday trading. This Indicator is based on Counter Trend strategy but use also Volatility. We can enter in good price with this Indicator, in order to follow the inversions on the current instrument. Hey, I made an Expert Advisor based on this indicator, if you are interested: Dark Titan MT5
Key benefits
Easily visible Inversion Lines Intuitive directional arrows Automated adjustment for each timeframe and instrument Easy to use even for beginners Never r
FREE
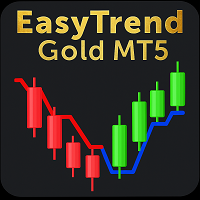
Tired of confusing indicators, especially when trading the volatile Gold market? EasyTrend Gold MT5 is designed to tame Gold's volatility on any timeframe . It harnesses the power of ATR to translate Gold's sharp movements into a single, clear, and dynamic trend line that cuts through the noise. Whether you are scalping on M1 or swing trading on H4, you can visualize the trend's direction and strength, easily identify consolidation periods, and gain an intuitive insight into when it's time t
FREE
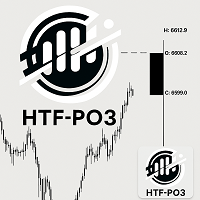
HTF Power of Three (ICT) - MT5 Indicator - Version 1.1 Overview The HTF Power of Three indicator is a professional implementation of the Inner Circle Trader's (ICT) Power of Three concept, inspired by Larry Williams. This indicator visualizes higher timeframe (HTF) candle development in real-time on any lower timeframe chart, making it an essential tool for ICT traders who study institutional price movement patterns. What is Power of Three (PO3)? Power of Three represents a three-staged Smart M

"MACD Ribbon Dynamic PRO: Transform Volatility into Trend" Short Description: "Don't rely on a single line. See the depth of the market. A new generation trend follower optimized for Bitcoin, Gold, and Forex, free from spread errors."
Product Details: Why MACD Ribbon Dynamic? Standard indicators produce false signals in high-volatility assets like Bitcoin or Gold. MACD Ribbon Dynamic uses a multi-layered algorithm to filter out market noise.
Key Features: Multi-Layer Analysis: See the tr

Hi Traders, A clean and lightweight Linear Regression Channel indicator designed for precise trend and volatility analysis. The channel is calculated using true linear regression, providing a statistically accurate best-fit trend line with adaptive upper and lower bands based on standard deviation Key Features: True linear regression calculation (not a simple moving average) Adjustable regression period and channel width Multiple price options (Close, Open, High, Low, Median, Typical, Weighted)
FREE

This indicator paints higher timeframe moving average. These moving averages are useful as * Certain moving averages serve as known support/resistance and there are important reactions around them often times.
* Having them on lower timeframe chart allows for more precise entry, exit, analysis.
* Price stuck between two or three important moving averages often times coils for a big move.
* They are useful in comparison of connected instruments And variety of other uses.
There is also an inexp
FREE

Contextualize the Narrative: Multi-Timeframe Structure Simplified The HTF Period Cycles is a high-performance visualization tool designed for traders who need to anchor their intraday analysis to Higher Timeframe (HTF) levels without the friction of switching tabs. By projecting the Open, High, Low, and Close (OHLC) of completed HTF cycles directly onto your lower timeframe (LTF) chart, you can maintain a crystal-clear bias while executing in the "now." Why This belongs in Your Toolkit Successfu
FREE

UT Bot Alerts — ATR Trailing Stop System Faithful MQL5 & MQL4 conversion of the legendary "UT Bot Alerts" indicator by QuantNomad from TradingView. Originally developed by Yo_adriiiiaan with the core idea by HPotter, and refined into Pine Script v4 with alerts by QuantNomad (Vadim Cissa) — one of the most followed quant developers on TradingView with over 100K followers. The original script has accumulated 1.1 million+ views and 35,500+ favorites on TradingView, making it one of the most popular
FREE
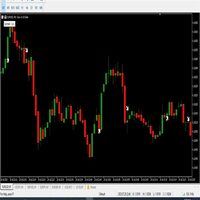
hello,
king binary sureshot mt5 binary indicator,
1 minute candle
1 minute expire
Alright. This indicator works on MT5 and is very easy to use. When you receive a signal from it, you wait for that candle with the signal to close and you enter your trade at the beginning of the next new candle. A red arrow means sell and a green arrow means buy. All arrows comes with a long dotted like for easy identification of trade signal. Are you okay with that?
FREE

UR Highs&Lows MT5 UR Highs&Lows MT5 does an in-depth analysis of price movement and its volatility, and creates a channel within which the price is moving. That channel moves now as an oscillator and is overlayed with price's deviation to signal potential exhaustions and possible reversals. Advantages of using UR Highs&Lows MT5 : No parameters You have 3 lines that describe the price movement - White Line which is an average of the price, and Blue Lines which are its extremes The histogram is a

Discover the "Agulhadas" Strategy Inspired by popular concepts in the Brazilian market, this strategy combines five technical indicators to identify potential entry and exit points based on trends, market strength, and momentum. Among the indicators used is the famous Didi Index, developed by Odair Aguiar, widely known for representing moving average crossovers. Download the Stock Scanner Here Indicators Used Didi Index ADX Bollinger Bands Trix Stochastic How This Strategy Works The indicator di
FREE
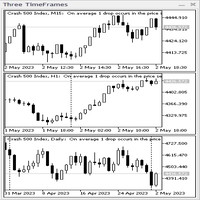
Three TimeFrames indicator-panel. The indicator is made in the form of a panel based on the CAppDialog class. The panel can be minimized or moved around the current chart using the mouse. The indicator shows three timeframes of the current symbol in the panel. In the current version, the indicator has a minimum number of settings - these are the parameters of three timeframes: "Younger timeframe", " Middle timeframe " and " Older timeframe ". When launched, the indicator-panel autom

This indicator is an indicator for automatic wave analysis that is perfect for practical trading! Case...
Note: I am not used to the Western name for wave classification. Influenced by the naming habit of Chaos Theory (Chanzhongshuochan), I named the basic wave as pen , the secondary wave band as segment , and the segment with trend direction as main trend segment (this naming method will be used in future notes, let me tell you in advance), but the algorithm is not closely relat

Volume Pressure Meter breakdown tick volume to reveal the buying and selling pressure inside every candle. Unlike standard volume which only shows total activity, this indicator splits volume to show who is actually in control of the market. It helps you identify trend strength and spot potential reversals through volume divergence. Key Features: Pressure Gauge: Visual bar showing real-time Buy vs Sell percentages. Trend Bias: Automatically identifies if the market is dominated by Buyers or Sell
FREE

Multi timeframe ZigZag indicator. It displays the support/resistance horizontal lines and their breakouts, as well as draws the current targets of the market. It can also display lines of the Fractals indicator and candles from other periods (up to Quarterly). So, you can actually see the supply and demand levels. Indicator – connects key lows and highs to show trend lines. You can also use it as indicator for the Break of Structure(BOS) & Market Structure Shift(MSS). The indicator redraws the

The indicator automatically draws the Fibonacci levels based on ZigZag indicator, Trading Sessions, Fractals or Candles (including non-standard timeframes: Year, 6 Months, 4 Months, 3 Months, 2 Months) ( Auto Fibo Retracement ). You can choose any higher time frame for Fibonachi calculation.
The levels are redrawn every time the current bar closes. It is possible to enable alerts when crossing the specified levels. You can also analyze levels in history. To do this, it is necessary to specify

Are you tired of drawing Support & Resistance levels for your Quotes? Are you learning how to spot Support & Resistances? No matter what is your case, Auto Support & Resistances will draw those levels for you! AND, it can draw them from other timeframes, right into you current chart, no matter what timeframe you are using... You can also Agglutinate regions/zones that are too much closer to each other and turning them into one single Support & Resistance Level. All configurable.
SETTINGS
Timefr
FREE

Bar Countdown is a simple indicator for MetaTrader 5 that shows the time remaining of the each candle. It can be placed in any corner of the chart or near of the price close and it'll help you to know
if the current candle is ending. Choose the counter format between HR:MIN:SEC and MIN:SEC It is so easy to use, configure the color, size and counter position on the chart and that's it!!! The Countdown starts now!
Updates: 2021/02/28; v1.0: Initial release 2021/03/16; v1.1: Minor code changes
FREE

Liquidity Sweeps Detector PRO MT5 Liquidity Sweeps Detector PRO MT5 is a MetaTrader 5 indicator designed to detect and visualize liquidity sweeps (BSL/SSL) and quickly scan multiple markets using a multi-currency / multi-timeframe Dashboard . It does not place any orders and does not manage positions: it is a visual analysis tool , not a trading robot. Launch Offer (Price + Bonus) Launch Price: $39 . This price is valid for the first 5 licenses sold . After that, the product price will increase
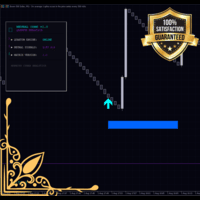
Monet Signal Master - Advanced Neural Trading System Version 1.00 Author: MONETFX Introduction Monet Signal Master is a professional technical indicator for MetaTrader 5 that generates non-repainting buy and sell signals using advanced multi-oscillator analysis. The indicator combines Stochastic and RSI crossovers with SuperTrend filtering to identify high-probability trading opportunities. Features include a cyberpunk-style dashboard, visual risk management zones, and comprehensive alert system
FREE

Easy Trend , as the name implies, is an indicator that easily shows the prevailing trend by bringing several indicators into one. The strategy is: when all indicators point in the same direction a signal is triggered. When red, is a signal to sell, when blue, signal to buy. It is that simple :) There are a total of 9 indicators: Moving Average, RSI, CCI, Parabolic SAR, William's Range, Stochastic, MACD, ADX and Heiken Ashi. It is possible to configure each of these indicators to suit your way of

The indicator that shows the countdown to the change of candles is equipped with an alert when the bar changes (the alert is not active if installed on the M1 time frame). Displays seconds if installed in time frame M1, displays minutes and seconds if installed in time frame above M1, and displays hours and minutes if installed in time frame h1 and above. The time displayed is calculated based on the running time.
FREE

Time Session OPEN-HIGH-LOW-CLOSE This Indicator Will Draw Lines Of OHLC Levels Of Time Session Defined By User. It Will Plot Floating Lines On Current Day Chart. Time Session Can Of Current Day Or Previous Day. You Can Plot Multiple Session Lines By Giving Unique ID To Each Session. It Can Even Show Historical Levels Of Time Session Selected By User On Chart To Do Backdating Test. You Can Write Text To Describe The Lines.
FREE

Line Profit Indicator of the visual line of profit in the deposit currency. Works only if there are open positions in the market for the symbol on which the indicator is installed. You can move the line with the mouse or enable automatic tracking of the Bid price. Description of indicator settings: colotLine - line color WidthLine - line width colotText - text color FontSize - the height of the text Anchor - an anchor method for text FollowBid - follow the Bid price
FREE

Unlock powerful market insights with this indicator that displays a visual order book on the chart, inspired by Nelogica's Profit Visual Book. It presents horizontal bars showing buy volumes (blue) and sell volumes (red), with yellow highlights for large volumes, helping traders spot high-liquidity zones. The price tends to move toward areas with the highest order concentrations, making it a key tool for identifying support and resistance levels. Fully customizable settings allow adaptation to
FREE
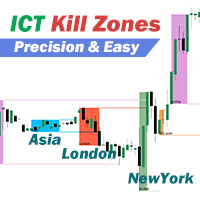
ICT killzones are specific time periods in the market during which trading volume and volatility often increase, In order to help traders have a comprehensive understanding of the market situation and better formulate trading strategies, we have developed a trading session indicator. Identify the five time periods of ICT killzones with different colors, and track the marked price areas within these periods. The high and low pivot reference lines will automatically extend until the pivot price is

KT Price Border creates a three-band price envelope that identifies potential swing high and low areas in the market. These levels can also be used as dynamic market support and resistance. The mid-band can also be used to identify the trend direction. As a result, it also functions as a trend-following indicator. In addition, its ease of use and more straightforward conveyance of trade signals significantly benefit new traders.
Features
It works well on most of the Forex currency pairs. It wo

============== -- If you are a fan of FIBONACCI... then this is defenitely a tool for you
-- Please master the optimal trade entry concept and you will become profitable
-- Show me you comment about this tool and I will give you more tools: Tradelist Panel, Watermark, Reversal tool, ... ============== Hallo Trader, This is fibonacci system based on the previous day levels (low and high) and the current day levels.
You can choose your favorite in settings. I use the Previous Day Fibo and use the
FREE

Recommended TimeFrame >= H1. 100% Non Repainted at any moment. Use it carefully, only with Trend Direction.
Trading Usage: 2 Variants: as Range System or as BreakOut System (Both Only With Trend Direction)::: (Always use StopLoss for minimise Risk);
[1] as Range System: (Recommended) in UP TREND: - BUY in Blue Line , then if price goes down by 50 points (on H1) open Second BUY. Close in any Profit you wish: TrailingStop(45 points) or Close when Price touches upper Gold Line.
in DOWN TREND

This is a simple Candle Stick Pattern Indicator, which shows in the current time period all standardisized Patterns in the chart. All Patterns will be calculatet automatically based on standard conditions. Following Candle Stick Patterns are included: Bullish Hammer | Bearish Hammer Bullish Inverted Hammer | Bearish Inverted Hammer Bullish Engulfing | Bearish Engulfing Piercing | Dark Cloud Cover Bullish 3 Inside | Bearish 3 Inside There are only a few settings at the begining to take. Every Pat
FREE

Advanced Stochastic Oscillator with dual-line signals, three-level system, multi-timeframe support, customizable visual signals, and highly configurable alert system.
Freelance programming services, updates, and other TrueTL products are available on my MQL5 profile .
Feedback and reviews are highly appreciated!
What is Stochastic Oscillator? The Stochastic Oscillator is a momentum indicator that compares a security's closing price to its price range over a specific period. The indicator cons
FREE
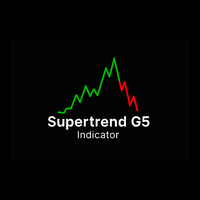
Supertrend G5 Indicator Supertrend G5 is a high-performance trend-following tool designed to accurately identify market reversal points. By displaying a color-coded line directly on the chart, this indicator helps you quickly recognize bullish trends (green) and bearish trends (red), supporting optimal entry and exit points. Key Features: Clear Buy/Sell Signals Buy when the Supertrend line changes from red to green (beginning of an uptrend). Sell when the Supertrend line changes from green to re
FREE
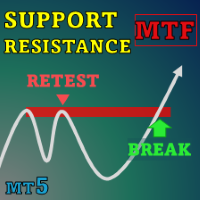
Special offer : ALL TOOLS , just $35 each! New tools will be $30 for the first week or the first 3 purchases ! Trading Tools Channel on MQL5 : Join my MQL5 channel to update the latest news from me In the ever-changing landscape of financial trading, accurately identifying and analyzing support and resistance levels is essential for making informed investment decisions. SnR Retest and Break Multi-Timeframe is a support and resistance indicator designed to enhance your trading analy
Level Box Tool is a powerful and user-friendly custom indicator designed for traders who utilize technical analysis tools like rectangles and trend lines to identify key support, resistance, and price zones. This tool simplifies and speeds up the process of marking chart levels, offering both visual clarity and precision with its fully customizable panel, and now includes price-cross alerts — so you’ll never miss a key level again. MT4 Version - https://www.mql5.com/en/market/product/136009/ Jo
FREE

INDICATOR: GEN Zenith Developer: gedeegi General Description GEN Zenith is a technical indicator designed to automatically identify price reversal patterns (Zenith) based on pivot price detection and delta volume movement. This indicator looks for points where the price forms a swing high or swing low, then detects a breakout from that area to confirm a strong reversal signal. This indicator is highly suitable for reversal and breakout strategies, or as a signal confirmation tool in your tradin
FREE

The indicator returning pivot point based trendlines with highlighted breakouts . Trendline caculated by pivot point and other clue are ATR, Stdev. The indicator also includes integrated alerts for trendlines breakouts and foward message to Telegram channel or group if you want. Settings · Lookback bar: Default 200 is number of bar caculate when init indicator. · Length: Pivot points period · Slope Calculation Method: Determines how this lope is calculated. We supp

Elliott Wave Trend was designed for the scientific wave counting. This tool focuses to get rid of the vagueness of the classic Elliott Wave Counting using the guideline from the template and pattern approach. In doing so, firstly Elliott Wave Trend offers the template for your wave counting. Secondly, it offers Wave Structural Score to assist to identify accurate wave formation. It offers both impulse wave Structural Score and corrective wave Structure Score. Structural Score is the rating to sh
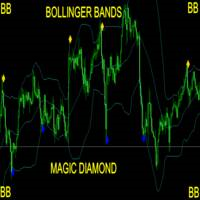
Take Your Trading Experience To the Next Level ! and get the Magic Bollinger Bands Diamond Indicator MagicBB Diamond Indicator is MT5 Indicator which can suggest signals for you while on MT5. The indicator is created with Non Lag Bollinger Bands strategy for the best entries. This is a system to target 10 to 20 pips per trade. The indicator will give alerts on the pair where signal was originated including timeframe. If signal sent, you then enter your trade and set the recommended pips targ
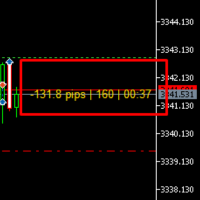
Ultimate Trading Companion Indicator for MT5
Hi there!
This intelligent and easy-to-use indicator is designed to give you a clear edge in the market. It shows: Live Pips of Open Trades – Instantly see how much you're gaining or losing in pips. Candle Countdown Timer – Know exactly when the current candle will close. Real-Time Spread Display – Stay aware of market conditions and avoid bad entries. Fully Customizable Colors – Choose your own Profit, Loss, and Neutral display colors for a clean a
The VSA (Volume Spread Analysis) Volume Indicator is a powerful technical tool used by traders to analyze the relationship between price movement and trading volume. Rooted in the Wyckoff methodology, VSA helps identify imbalances between supply and demand, revealing the hidden actions of institutional players—often referred to as “smart money.” This indicator evaluates three key elements: volume, price spread (the difference between high and low), and closing price. By interpreting these facto
FREE
MetaTrader Market - trading robots and technical indicators for traders are available right in your trading terminal.
The MQL5.community payment system is available to all registered users of the MQL5.com site for transactions on MetaTrader Services. You can deposit and withdraw money using WebMoney, PayPal or a bank card.
You are missing trading opportunities:
- Free trading apps
- Over 8,000 signals for copying
- Economic news for exploring financial markets
Registration
Log in
If you do not have an account, please register
Allow the use of cookies to log in to the MQL5.com website.
Please enable the necessary setting in your browser, otherwise you will not be able to log in.