Watch the Market tutorial videos on YouTube
How to buy а trading robot or an indicator
Run your EA on
virtual hosting
virtual hosting
Test аn indicator/trading robot before buying
Want to earn in the Market?
How to present a product for a sell-through
Technical Indicators for MetaTrader 5 - 108
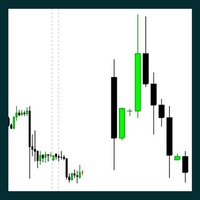
The Indicator is useful for professional trader, such as ICT , Smart Money Concept trader; who do the top-down analysis and want to display the candles of the Higher Timeframe on the Lower Timeframe. It allows you to stay in your entry timeframe while following the narrative of the Higher timeframe. Here are some easy input: Number Of Bars: The total of HTF's candle you want to display. Auto Timeframe: If true, the indicator will recommend the Higher timeframe that suit the current timeframe you

Presentation: Discover an advanced version of the Stochastic Oscillator indicator, designed for demanding traders. This tool integrates sound and visual alerts for crossovers at specific levels, providing precise analysis and clear signals to optimize your trading decisions. Key Features: Sound Alerts: Automatic audio signal for a bullish crossover (%K crossing %D upwards) between levels 0 and 60. (Adjustable Parameter) Automatic audio signal for a bearish crossover (%K crossing %D downwards) be
Its our anniversary! To give back enjoy this 60% discount for the next week (original price $239)
We have combined all of our beloved indicators the likes of: Key level order block , Key level supply and demand , Key level liquidity grab and Key level wedge into one single indicator and dashboard.
Whats new Dashboard : There is an easy access dashboard for all your needs. Multi-timeframe button : There is now a multi-timeframe option for Order Blocks and Supply and demand zones, maki
This is the Parabolic Dashboard MT5. This dashboard will scan multiple timeframes and symbols in MT5 platform, from M1 chart to D1 chart. It will send the buy/sell signals by alert on the platform or sending notification to your phone or message you via a email.
The buy signal is generated when the SAR changes its position from above to below of the candle. The sell signal is is generated when the SAR changes its position from below to above of the candle. The up/down trend color will be disp
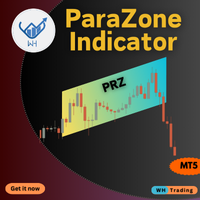
The ParaZone Indicator MT5 helps you spot areas where price trends are likely to reverse. It marks these zones on your chart using a unique parallelogram shape, making it easier to find the best points to enter or exit trades. Whether you’re a beginner or experienced trader, this tool can help improve your trading decisions. Key Features: Accurate Reversal Detection: Identifies key zones where price may change direction. Dynamic Zone Adaptation: Zones adjust in real-time to follow market movemen

Pivot Math Support and Resistance Lines indicator — indicator showing pivot lines, which will definitely help every trader who knows how to trade with resistance, support and pivot lines. It shows 8 different lines (additional lines are also possible) on the main chart, helping you find the best points to buy, sell and exit positions. Input parameters: P (default = 64) — period in bars or other periods (set using MMPeriod), on which the lines will be calculated. The smaller this number, the "f

Heat Map Indicator - Advanced Volume Analysis
Introducing the Heat Map Indicator - A Professional Tool for Market Volume Analysis!
**Key Features**
**Visual Heat Map** - Instant volume intensity visualization through colors - Blue: Low volume - Green: Medium volume - Yellow/Orange: Increasing volume - Red: High volume
**Intuitive Interface** - Dynamic color scale - Real-time percentage indicator - Current level indicator - Customizable colors and transparency
**Smart Alert System** - Custo

Switching between charts to analyse market trends across multiple timeframes can quickly become a tiresome task. Finding confluence (alignment across timeframes) is essential to making informed trading decisions. This innovative indicator simplifies the process, allowing you to see trends on multiple lower timeframes directly from a higher timeframe chart. With this indicator, you can monitor four Heiken Ashi setups running simultaneously, each on a different timeframe. The result is a clear, la
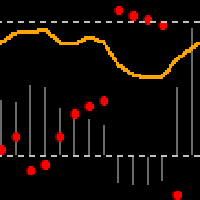
The stochastic indicator itself creates false signals. One way to determine that the price is trending is to use the parabolic SAR indicator. As a rule, it is plotted on the chart.
The projection of the SAR into the Stochastic Indicator is not complicated (pSAR-min)/(max-min). This will allow you to track price movement from two views in one place.
It depends very much on the parameter settings.
If the price is trending, the SAR moves towards the midpoints or close to them. On the other hand, a

SlopeChannelB – a technical analysis tool that constructs a sloping price movement channel, offering unique opportunities to assess the current market situation and find trading signals. Main features of the indicator: Sloping price movement channel :
The indicator helps visualize support and resistance levels, which may indicate potential reversal points or trend continuations. Various line colors and background highlighting :
Sloping support and resistance levels are displayed in differen
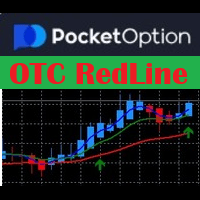
Custom Heiken Ashi and Moving Averages-Based Signal Indicator Overview
This Heiken Ashi and Moving Average-based indicator is designed to identify trend-following buy and sell signals by analyzing the relationship between three Exponential Moving Averages (EMAs). It applies Heiken Ashi smoothing to filter market noise and improve trend clarity. EMA Crossovers for Trend Detection – Uses 3, 8, and 25-period EMAs to confirm trends. Heiken Ashi Smoothing – Reduces market noise for better trend vis
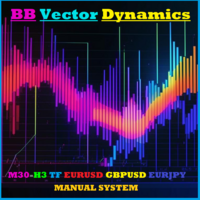
BBVectorDynamics_indicator is an innovative trading system specifically designed for volatile markets. Based on unique algorithms for analyzing market forces and identifying imbalances between buyers and sellers, this system helps you make precise and well-considered decisions in the trading process. Main features of the bb vector dynamics_indicator:
Calculation of dynamic vectors. System determines the differences between the extreme price values and smoothed averages over a specified period.
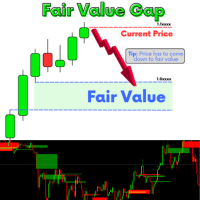
A fair value gap (FVG) is a temporary price gap that occurs when the price of a stock or security is out of line with its fair value. This gap is often caused by an imbalance between buyers and sellers. How it works Price imbalance When there is an imbalance between buyers and sellers, the price of a security can move too quickly. Price gap This creates an unadjusted area on the price chart, known as the fair value gap Price correction The price is often drawn back to the fair value gap, as i
ParabolicSAR_Fibo_Channel is an indicator built not on the price deviation from the last extremum, as in a regular similar filter, but on the readings of Parabolic SAR and its intersection with the price chart. As a result, the indicator has a smaller delay in determining a new reversal point. In addition, the filter very conveniently built in Fibonacci levels, which are built on the basis of three consecutive ZigZag peaks, as well as a channel built on the same points. As a result, this indicat

Regression_Channel_mod Indicator that expands our standard linear regression channel by adding support and resistance lines. Easy to integrate into other indicators.
The linear regression channel consists of several parallel lines equidistant from the upper and lower part of the linear regression trend line. The distance between the channel boundaries and the regression line is equal to the deviation of the maximum closing price from the regression line.

FiboPivotsIndicator is the indicator for intraday traders looking for key breakout levels and target levels on the chart. It uses automatic Fibonacci extensions and pivot points to highlight price event areas. FiboPivotsIndicator is a unique combination of Fibonacci extensions and pivot points for price action traders.
This breakout trading tool is suitable for both trend following and swing trading strategies. Indicators such as moving averages, stochastics and RSI are well suited for this
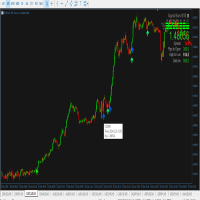
Dynamic Center of Gravity Indicator Revolutionary Price Action Trading System Harness the power of price momentum with the Dynamic Center of Gravity indicator - an advanced price action trading tool designed for serious traders. This innovative indicator identifies powerful gravity zones that attract rapid price movements, creating high-probability trading opportunities when momentum breaks free from these zones. Key Features Pure price action analysis - no lagging indicators Works effectively a
The Hybrid Trend Impulse indicator is an advanced tool that combines modern approaches to trend and impulse analysis, offering unique capabilities for effective deposit management. Key advantages of the HybridTrendImpulse_indicator: Nonlinear dynamics: The method of interaction between opening prices forms a unique nonlinear model that is particularly sensitive to significant price fluctuations, increasing their significance and making the indicator ideal for working in high volatility conditio

The Opportunity System: Forex Gold Indicator The Opportunity System is a powerful and intuitive Forex Gold Indicator designed to help traders identify prime entry and exit points for trading gold (XAU/USD). This advanced indicator combines the strengths of two of the most popular technical analysis tools – the Stochastic Oscillator and the MACD (Moving Average Convergence Divergence) – to provide precise, real-time insights into market trends and potential reversals. Key Features: Stochastic Osc

Golden Trend Pulse — trend indicator developed specifically for Gold, also applicable to the Cryptocurrency and Stock markets. The indicator is designed for precise determination of market trends using advanced analytical methods. The tool combines multifactor analysis of price dynamics and adaptive filtering of market noise, ensuring high accuracy in identifying key entry and exit points. Thanks to its intelligent system, the indicator effectively handles market variability, minimizing false

Arrow indicator for forex trading using scalping strategy on popular currency pairs, bitcoin, gold, on m1 timeframe and others. The indicator has entry point settings, trend settings for higher timeframes, and various indicator filters, it is also possible to set up time trading intervals for yourself, in which you will receive signal arrows above the candles, as well as pop-up windows with alerts, or notifications on your phone via ID. The settings are simple, the strategy is ready, new sets an
Basic information. To perform its work, the indicator takes data on volumes from a lower timeframe, builds Market Profiles for a higher timeframe and a histogram for the current timeframe. The indicator starts in several stages. In this case, messages like: "Build Source & Target TF. Step: …" are output to the log. The process can be accelerated by changing the input parameter Milliseconds between steps - the initialization speed. The final value of this parameter is always individual and is set

MACD Classic: Moving Average Convergence/Divergence Indicator for MT5 Designed for advanced traders seeking precision and adaptability in their trading strategies. The MACD Classic is a custom technical indicator developed with MQL5 for MetaTrader 5 , optimized to provide you with clear signals for moving average convergence and divergence , helping you identify trends and entry/exit points more efficiently. Key Features : Fast EMA (12) : Ideal for capturing fast market movements.
Slow EMA
Adaptive Trend Metrix Adaptive Trend Metrix is a fxtool for assessing the current state of the market that adapts to changes in volatility, helping to determine the direction and strength of the trend by taking into account price dynamics. One aspect of this strategy is its ability to change and use different parameters based on price behavior. For example, it takes into account the current market volatility to adjust sensitivity to price fluctuations and identify entry and exit points. Adaptiv
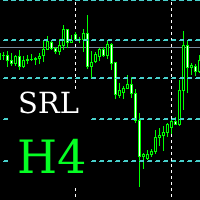
An indicator for determining and displaying support and resistance levels on the H4 chart over the past 180 days. The algorithm searches for local minima and maxima, filters levels to eliminate closely spaced values, and then visualizes them on a graph. Defining key levels Support levels: lows at which the price slowed down or reversed upward. Resistance levels: highs where the price had difficulty rising further.
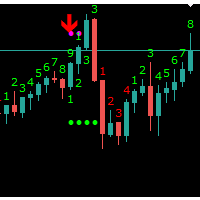
Indicator Sequential Through a multi-phase price comparative process consisting of the Setup and Countdown indicators, the Sequential indicator analyzes otherwise incongruent price data to provide insight into the strength or weakness of the market’s trend and its likelihood of reversing The Mechanics of Sequential We have the market's number The majority of the DeMARK Indicators are designed to anticipate price exhaustion as opposed to following the trend. Identifying likely inflection points

The GoldenBufferPattern indicator uses several indicator buffers (Candles+Fractals+ZigzagColor+ColorMaLine).
The indicator is recommended to be used together with other indicators or using the Martinheim Method. We use this method with this indicator, as well as some of our other proprietary filters and trading strategies in particular, in our Experts Advisors on ProfRoboTrading.
ocket Options GreenLine Strategy – SMA(7) Crossover & Trend Alert Indicator Latest Updates: Added Sell Alerts within an Uptrend – If MA1 crosses below MA2 without going below MA3, a Sell Alert is triggered. Enhanced Alert Logic – Prevents duplicate buy and sell icons on every candle. Improved Print Statement – Alerts now log directly to alerts.txt for future reference. Now Compatible with Heiken Ashi and Regular Candles. Overview
The Pocket Options GreenLine Strategy is a trend-following indic

The Market Master is a comprehensive, all-in-one trading indicator designed to enhance your trading strategy
Features:
Trend Filter VWAP Break Of Structure patterns Daily, Weekly, Monthly highs/lows Fractals Channels Volume Profile Currency Strength Meter Fair Value Gap News Filter
The idea behind this indicator was to create a trading tool that has everything a trader needs
r-Trend Sync indicator is manual trading system for extra volatility markets. Main System features : The indicators's algorithm is based on the analysis of an extensive array of historical data (from 1995 for EURUSD & EURJPY and from 2004 for XAUUSD), which ensured the identification of general patterns in the behavior of these pairs across a wide range of timeframes. The analysis of historical data helped the system learn to recognize market triggers for medium-term trends and cycles, as well a
Revolutionize Your Trading! Unlock the Secrets of Market Dynamics with the Predator Expansion Contraction Candles Indicator.
Imagine having the power to decode the secret language of the markets, to anticipate the ebbs and flows of price movements with uncanny precision. Welcome to the Predator Expansion Contraction Candles Indicator, a game-changing NON-REPAINTING tool that elevates your trading to new heights by providing unparalleled insights into market expansion and contraction phases.
U

Session Liquidity is the most anticipated trading strategy among the ICT trader. With this indicator you could frame the trade by simply deploying it on the chart. By simply inputting the Asian Opening Time, New York Opening Time, and choose the color option and display option you like then you will get the session laid down for you on the chart. You can choose between showing session as box or horizontal line. I personally trade this strategies for quite sometimes.

Are you ready to elevate your trading game and experience unparalleled accuracy in market predictions? The Scalping Range Grid Indicator is not just a tool—it’s your main weapon for pinpointing the next move in the financial markets. Designed for traders who demand the best, this cutting-edge indicator harnesses the power of grid-based analysis to scan future price transit zones with unmatched precision. Imagine having the foresight to know where the price is most likely to pause, consolidate,
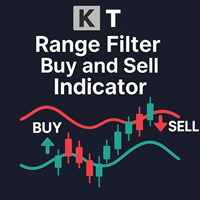
The KT Range Filter Buy and Sell simplifies minor price movements and fluctuations, transforming them into a smoother, more defined trend. While QQE smoothing is typically applied to RSI, It applies the concept directly to price, offering a unique and effective approach to market analysis.
It features a three-band structure, consisting of a main averaging line flanked by an upper and a lower band. These bands are calculated using a range multiplier, providing a clear visual representation of p
SynRhythmic Points Oscillator is an innovative manual trading system based on the combination of two analytical approaches, one focusing on short-term price changes and the other on identifying stable trends and dependencies. This synergy allows for obtaining excellent signals for entering the market while minimizing the influence of random fluctuations and reducing false signals. Additionally, the indicator can easily adapt to various market conditions and be automated, making it convenient for
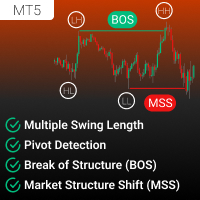
The 1TF BOS/MSS Indicator is a powerful tool designed to analyze and visualize market structure directly on 1 single time frame on your chart. This indicator provides precise detection of market structure breaks (BOS) and market structure shifts (MSS), enabling traders to identify key reversal points and trend continuations with ease. Its customizable settings and detailed annotations make it an indispensable tool for traders seeking clarity and confidence in their decision-making process. Featu

Introducing our advanced Indicator, a groundbreaking tool for identifying support and resistance zones with unmatched precision. Elevate your trading strategy with a host of features, including a dual-color upper and lower box system that allows for easy visual recognition of market trends.
Key Features: Dual-Color Box for the Support and Resistance Zones Customize your analysis with dual-color box. The upper and lower boxes offer distinct colors, providing a clear visual representation of supp
The KT Dynamic Price Oscillator (DPO) offers a specialized approach to analyzing the trend, momentum, and volatility of financial instruments. It excels at identifying trend continuations, overbought or oversold conditions, and potential reversal points with precision. It is specifically designed to assist traders in identifying short-term price cycles and potential reversals by effectively filtering out long-term trends.
How to use the DPO
Trend Confirmation: The DPO acts as a reliable confir

Overview The Waterfall Trading Indicator is a powerful momentum detection tool designed to identify high-probability trading opportunities across multiple timeframes. Built on pure price action analysis, this indicator provides clear, non-repainting signals that are especially effective for binary options and forex trading. Key Features Non-Repainting Signals : Based on real-time price action, ensuring reliable trade signals Multi-Timeframe Compatibility : Effective across all timeframes, with o

The Matrix Series indicator analyzes price action, moving averages, and volatility to detect trending conditions. Bullish Trend: Green zones or upward signals indicate a strong uptrend, ideal for long positions. Bearish Trend: Red zones or downward signals suggest a downtrend, perfect for short positions. Sideways/Neutral Market: Non-highlighted or gray zones show periods of market consolidation or low momentum, helping you avoid false signals. Use Cases: Trend Confirmation: Use the indicator to

As an ICT or SMC trader you must do top-down analysis, and you struggle to make template of drawing object on Metatrader just like you normally do on Tradingview. Well, Drawing Assistance indicator will make your top-down analysis much easier on Metatrader. Allow to design template for 3 timeframes. (HTF, MTF and LTF). Each objects drawn on chart will have the color, style and visibility individually by the timeframe it was drawn on. Save time as all analyzing is done on Metatrader chart. Shortc

Fibo Extrema Bands is a unique indicator that visually demonstrates when the market shifts into a trend and highlights key levels acting as support or resistance. It combines easy-to-read “stepped” extrema lines with Fibonacci levels (whose values can be adjusted in the indicator’s inputs), simplifying the search for entry and exit points. Install Fibo Extrema Bands to gain a powerful tool for trend analysis and for identifying critical price levels! This product is also available for MetaTrade

Summary
This indicator plots multiple pivot points (support and resistance levels) using various calculation methods, allows customization of their appearance, and can alert when price touches these levels. It works on different timeframes and can display historical levels or just the current ones.
Overview Purpose : Plots dynamic pivot levels (Pivot, S1-S4, R1-R4) on the chart to help identify potential price reversal zones. Key Features : Supports 7 calculation methods (Classic, Camarilla
Volonacci Indicator It is an indicator that combines Fibonacci and volume to determine the price direction This indicator helps you identify Fibonacci angles according to the strategy The Volonacci indicator is indeed an interesting combination of Fibonacci levels and volume. This indicator uses Fibonacci tools to identify potential support and resistance levels, and enhances this by using volume to confirm the strength behind the price action.
MT4 Version https://www.mql5.com/en/market/produ
VWAP Trend Pro (Volume Weighted Average Price) is a versatile trading tool that can be used effectively in several ways: This is an advanced Volume Weighted Average Price indicator that revolutionizes your trading experience by dynamically changing colors across scanned timeframes, providing real-time trend insights. The intuitive right corner scanner with three simple squares represents Monthly, Weekly, and Daily trends, each bordered by the current trend color and with background color indicat
The indicator generates entry signals for BINARY OPTIONS OR FOREX SCALPING, normally on the chart you see an arrow that can appear or disappear on the last candle, this is normal: the indicator is processing the data, and reads the conditions to send an entry signal. The conditions vary every second for this reason the signal appears and disappears. THIS IS PRACTICALLY A WARNING FOR THE TRADER TO BE READY because the conditions for a possible entry are forming. At the close of the candle, IF TH

very simple indicator to help with fast risk management during volatility.
~Displays: - stop loss in points of your choice. - take profit in points of your choice. - what lot size to risk on the trade relative percentage.
~Values that can be changed: - take profit points. - stop loss points. - risk in percentage. - color of lines. - width of lines. - linestyle. - buy / sell trade.
A simple Zig Zag indicator with added visualization of Higher High, Lower High, Higher Low, Lower Low. This indicator will be very helpful when working with support/resistance levels. The ZigZag indicator is a fundamental tool that will significantly help you navigate complex situations in the financial markets. By providing a clear visual representation of price movements and trends, it simplifies the analysis process and improves decision-making capabilities. Its role in identifying trends and
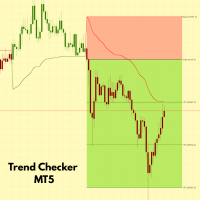
Trend Checker MT5 (GammaTrend) — Smart Indicator for Trend & Trade Levels Summary
Rule-based trend visualization with ATR-aware entries, adaptive stop-loss, and optional targets. What it does
GammaTrend analyzes price action together with the Average True Range (ATR) and selected market-closure conditions to highlight trend direction, suggest potential entry zones, and compute indicative stop-loss and target levels. It is a visual analysis tool ; it does not execute trades. Key features Trend

Simple Japanese candlestick indicator
Contains 3 patterns: - bearish engulfing - bullish engulfing - doji
Only contains these 3 because after rigorous testing and trading (data) these seem to be the most efficient. Also contains: - alerts if enabled
When japanese candlestick is detected it is colored with relevant color depending on bias, and also shows label next to it. Labels: - BEG = Bearish engulfing - BE = Bullish engulfing - DO = Doji
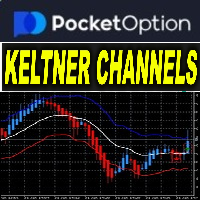
ocket Options Keltner Channel with MA v3.12 Indicator Name: Keltner Channel v3.12 – Advanced Trend and Signal Indicator
Version: 3.12
Release Date: 2024
Platform: MetaTrader 5 (MT5)
Category: Trend Indicators Overview
Keltner Channel v3.12 is a trend-following indicator that combines Keltner Channels with Moving Averages (MA1 and MA2) to identify breakouts, trend shifts, and momentum changes. This tool provides real-time buy and sell signals, visual markers, and alerts to assist traders in dec
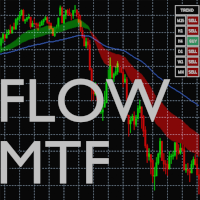
This indicator takes as parameters the periods for three moving averages (Short, Long, Very_Long) and displays them for the current timeframe: - in the form of a cloud (green if Short is greater than Long, red if Short is less than Long) - as a line for the Very_Long moving average. It also allows you to display the status (BUY or SELL) of these same moving averages but for the M15, H1, H4, W1 and MN1 timeframes. This information is summarized in the window titled "TREND", where, for each timefr

Trend Strength Visualizer A Simple Tool for Trend Analysis This indicator helps you quickly assess the strength of market trends using fast and slow moving averages. It’s designed to give you a clear visual representation of the trend, so you can make better trading decisions. ~Displays: Green Line : Strong uptrend (potential buying opportunities). Red Line : Strong downtrend (potential selling opportunities). ~Values That Can Be Changed: Fast MA period. Slow MA period. Line color for uptrend an
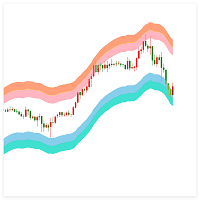
Indicator Introduction: The Volatility Range Indicator aims to help traders identify the current market's volatility range by analyzing historical price data. By calculating the upper and lower bounds of price fluctuations, traders can determine potential support and resistance levels, providing a foundation for subsequent trading decisions. This indicator is particularly suitable for ranging markets and high-volatility environments, as it can effectively assist traders in capturing price breako

One of the most accurate ways to predict price movements is to identify imbalances. When we identify significant price imbalances (aka fair value gaps or fvgs/ifvgs), it becomes relatively easy to place trades based on continuations and retracements. A moving average simply cannot give you anywhere near the precision we find when we observe the reaction of price to an imbalance. There are a few products on the market that claim to provide trading opportunities based on imbalances, but we believe

Checklist Indicator for MT5 Streamline your trading process with the Checklist Indicator —a powerful tool designed to keep you disciplined and organized. This indicator allows you to create and manage a personalized checklist directly on your chart, ensuring you follow your trading rules before entering a position. ️ Customize your own trading checklist
️ Stay consistent and avoid impulsive trades
️ Improve decision-making with structured analysis
️ Seamlessly integrates into your MT5 workfl
SAR Vision MTF – Multi-timeframe Parabolic SAR Indicator for MT5 SAR Vision MTF is a multi-timeframe technical analysis tool that displays Parabolic SAR values from higher timeframes directly on the current chart. It is designed to assist traders in analyzing broader market trends without switching between multiple charts. Key Features Multi-timeframe functionality – View Parabolic SAR signals from higher timeframes (e.g., M5, M15, H1, H4) on lower timeframe charts. Customizable appearance – Mo

Uncover the true hidden patterns of the market with the PREDATOR AURORA Trading System—the final boss of hybrid trading Indicators. See what others don't!
PREDATOR AURORA Trading System a powerhouse designed for those who refuse to cower in the shadows of mediocrity. This isn't just another indicator, it is the cheat code ; it is your unfair advantage , a sophisticated hybrid hunting system that tracks market movements with lethal precision in a jungle where only the strongest survive. Inspir

Utility of the Indicator Multifaceted Analysis : Allows for a comprehensive view of the market through different metrics (trend, volatility, momentum, risk, support/resistance). Trading Signals : Offers clear buy and sell signals, aiding traders in making entry and exit decisions. Risk Management : The risk buffer helps to assess when it is safe or risky to execute trading operations. Customizable Visualization : With multiple colors and chart styles, it becomes easy for the trader to interpre

AriMax – AI-Powered Trading Robot AriMax is a cutting-edge AI-powered trading robot designed to help traders maximize profits while minimizing risk. Utilizing advanced machine learning algorithms and real-time market analysis, AriMax identifies high-probability trade opportunities with precision and speed.
Key Features: AI-Driven Market Analysis – Analyzes market trends and patterns to make data-driven trading decisions.
Automated Execution – Places trades seamlessly with optimiz
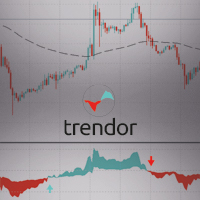
The TRENDOR 1.0 indicator is designed to identify and filter market trends using a combination of RSI and ATR indicators. This powerful trend detection system helps spot significant RSI crossovers while filtering out false signals using an ATR and an EMA (Exponential Moving Average). The purpose of this indicator is to provide clear and precise signals for optimal trading decision-making.
Main features:
Short and Long RSI: Combines the values of two RSIs (short and long) to detect market tr
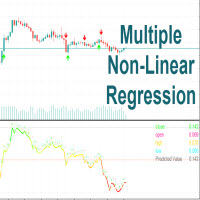
Multiple Non-Linear Regression This indicator is designed to perform multiple non-linear regression analysis using four independent variables: close, open, high, and low prices. Here's a components and functionalities: Inputs: Normalization Data Length: Length of data used for normalization. Learning Rate: Rate at which the algorithm learns from errors. Show data points: Show plotting of normalized input data(close, open, high, low) Smooth?: Option to smooth the output. Smooth Length: Length of

MTF Candles Overlay - Professional Multi-Timeframe Analysis Tool (Now with Yearly Y1 timeframe!) The MTF Candles Overlay is a powerful and visually intuitive indicator that allows traders to view candles from higher timeframes directly overlaid on their current chart. This eliminates the need to constantly switch between multiple timeframe charts, enabling faster analysis and better trading decisions. Key Features Complete Timeframe Coverage All Standard Timeframes : M1, M2, M3, M4, M5, M6, M1
Un order book, ou carnet est un outil numérique qui affiche en temps réel les ordres d'achat et de vente pour un actif financier spécifique, comme une action, une crypto-monnaie ou une paire de devises. Il permet aux traders de visualiser la profondeur du marché, c'est-à-dire la quantité d'ordres d'achat et de vente à différents prix. Voici une description des éléments clés d'un order book : Colonne d'achat (Bid): Affiche les ordres d'achat en attente pour un actif. Les prix d'achat sont classés

Trend indicators are one of the areas of technical analysis for use in trading on financial markets.
The Angular Trend Lines indicator comprehensively determines the trend direction and generates entry signals. In addition to smoothing the average direction of candles,
it also uses the slope of the trend lines. The principle of constructing Gann angles was taken as the basis for the slope angle.
The technical analysis indicator combines candlestick smoothing and chart geometry.
There are two ty
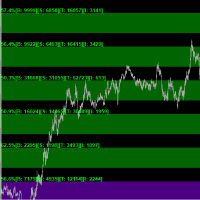
Key Features: • Multi-Zone Analysis: Track volume patterns across multiple customizable price zones • Real-Time Volume Tracking: Monitor buy/sell pressure as it develops • Dynamic Price Levels: Automatically adjusts zones around daily opening prices • Advanced Statistics: View detailed volume metrics and price action percentages
Technical Capabilities: • Volume Distribution Analysis - Buy/Sell volume ratios - Volume imbalance detection - Total trading activity monitoring - Price action directio

This isn't just an indicator; it's a top-tier market analysis tool that combines the power of various technical analysis techniques into one package. Perfect for traders seeking precision and clarity in their trading decisions. Key Features: HiLo Activator: Easily capture the essence of market trends. This component differentiates between bullish or bearish markets, helping you to be on the right side of the move. MACD (Moving Average Convergence Divergence): Quickly identify changes in market

Discover the Power of the QDOTRAXY Indicator: Your Key to Precise Trading Decisions! Have you ever imagined having a powerful ally that combines advanced technical analysis with real-time alerts to maximize your market operations? We introduce ULTRA ADVANCED, the indicator that revolutionizes how you make buy and sell decisions. Why Choose QDOTRAXY? Unmatched Accuracy: QDOTRAXY combines multiple technical indicators (MACD, Bollinger Bands, SAR, and Moving Average) to generate highly reliable si
In the dynamic world of forex trading, technical analysis is an essential tool for traders seeking to navigate the complexities of the currency markets. One key element of this analysis is the interpretation of candlestick patterns, particularly the phenomenon of consecutive one-sided candles. These candles, characterized by a uniform direction — either completely bullish or bearish — offer significant insight into market sentiment and potential future movements. Understanding the implications o
This indicator automatically identifies and plots key support/resistance (S/R) levels on price charts using a hybrid algorithm combining fractal detection , price touch validation , and dynamic level managemen. Key Features
Support and Resistance Levels: Support levels and Resistance levels are drawn in red . Fractal-Based Detection: Levels are identified based on fractal highs and lows. Efficient Memory Handling: The number of levels is limited to 100 to avoid clutter. Cleanup on Deletion: All
The MetaTrader Market is a simple and convenient site where developers can sell their trading applications.
We will help you post your product and explain you how to prepare your product description for the Market. All applications on the Market are encryption-protected and can only be run on a buyer's computer. Illegal copying is impossible.
You are missing trading opportunities:
- Free trading apps
- Over 8,000 signals for copying
- Economic news for exploring financial markets
Registration
Log in
If you do not have an account, please register
Allow the use of cookies to log in to the MQL5.com website.
Please enable the necessary setting in your browser, otherwise you will not be able to log in.