Watch the Market tutorial videos on YouTube
How to buy а trading robot or an indicator
Run your EA on
virtual hosting
virtual hosting
Test аn indicator/trading robot before buying
Want to earn in the Market?
How to present a product for a sell-through
Technical Indicators for MetaTrader 5 - 13

Spike Trap is a simple but powerful tool that identifies sharp market spikes and waits for price pullbacks to highlight high-probability entry and exit zones. By combining volatility detection with smart retracement logic, it helps traders capitalize on fast price moves with precision and reduced risk. Ideal for scalping or long-term trading in volatile markets. Spike Trap can be used to trade synthetic indices such as Boom and Crash offered by Deriv Broker as well as Pain and Gain indices offer

Harmonic Sniper Pro – The Ultimate Harmonic Pattern Scanner Unlock the power of precision geometric trading with Harmonic Sniper Pro. This professional-grade indicator automatically detects high-probability harmonic patterns (Gartley, Bat, Butterfly, Crab, Shark, Cipher, and ABCD) with AI-powered filtering and advanced trade management features. Designed for both scalpers and swing traders, Harmonic Sniper Pro eliminates the guesswork by providing clear entry zones, stop losses, and take profit
FREE

This indicator uses the Zigzag indicator to identify swing highs and swing lows in the price chart. Once it has identified the swing highs and swing lows, it can use them to determine potential support and resistance levels. A support level is formed when the price drops and bounces back up from a swing low, indicating that there is buying pressure at that level. A resistance level is formed when the price rises and reverses downward from a swing high, suggesting selling pressure at that level.
FREE
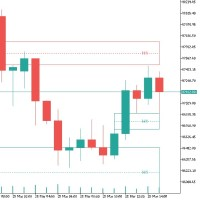
Imbalance in Trading: Basics and Strategies Imbalance in trading is a phenomenon where there is a disparity between supply and demand in the market. This can manifest as an excess of buy orders (bullish imbalance) or sell orders (bearish imbalance), leading to inefficient pricing and creating opportunities for traders. Technical Aspects "Candlestick Pattern" : Imbalance is often represented by a three-candle pattern, where the second candle is longer than the others and determines the direction
FREE

Use this indicator to get alerts on trends developing within the market. Using this indicator, you will be able to get alerts about trends that are developing in the market as they develop. This indicator can be used to identify entries or exits within a trend. The indicator combines information from higher timeframes, with price movements of the current timeframe to output a buy or sell signal. The indicator can identify trend changes, or continuations of the dominant trend. Note: Trend followi
FREE

Liquidity Swings SMC Zones Liquidity Swings SMC Zones is a professional indicator for MetaTrader 5 that automatically detects, displays, and updates liquidity-based swing high and swing low zones directly on your chart. This tool is designed for traders who use Smart Money Concepts (SMC), supply and demand, or support and resistance trading methods. Features Automatic Zone Detection:
Identifies significant swing highs and swing lows based on customizable pivot settings. Clear Visual Zones:
Hi
FREE

A simple indicator that automatically highlights all FVGs (Fair Value Gaps) formed on the chart, as well as FVGs on history. It is possible to select colors for FVGs of different directions (long or short), select the time interval, select the color of middle point and you can also choose whether to delete filled FVGs or leave them on the chart (the option is beneficial for backtesting). The indicator can be very useful for those, who trade according to the concept of smart money, ICT, or simply
FREE
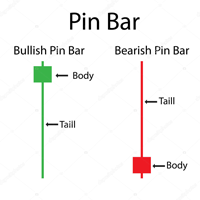
Pin bar pattern is characterized by a long upper or lower wick with a small body relative to the size of the wick with little to no lower or upper shadows. Pin bars are not to be traded in isolation , but need to be considered within the larger context of the chart analysis. A pin bar entry signal, in a trending market, can offer a very high-probability entry and a good risk to reward scenario.
Inputs Multiplier ; AlertOn - enable alerts; EmailAlert - enable email alerts; PushAlert - en
FREE

============== -- If you ar fan of FIBONACCI... then this is your tool ============== Hallo Trader, This is fibonacci system based on the previous day levels (low and high) and the current day levels.
You can choose your favorite in settings. I use the Previous Day Fibo and use the toggle button on the top of the pairs list for swithing to the Current Day Fibo.
The App detects inside bar and engulfing bar too. The list of pairs is similar to the marketwatch concept built-in the metatrader...
FREE

Volatility Channel Indicator Ride the Waves of Market Volatility with Precision ... please leave a 5 star rating if you love this product The Indicator is free. The source code is available for just 30usd.
Are you tired of entering trades too early or too late? Missing breakouts? Getting caught in false signals? The Volatility Channel Indicator transforms chaotic price action into crystal-clear trading opportunities. What You Get (MT4 & MT5) Smart Channel Bands that
FREE
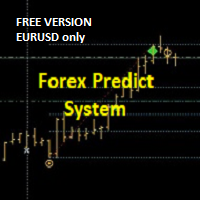
+++++++++++++++++++++++++++++
+++ FREE VERSION - EURUSD ONLY
+++++++++++++++++++++++++++++
Please add PREFIX and/or SUFFIX via settings if your Broker Chart Symbol is different (e.g. suffix = .r).
+++
This is forecast system.
On the moment of the breakout/forecast: the indicator draws retrace zone (yellow) and three targets. The levels act as support and resistance. It can be used on all pairs/indices/timeframes/periods. For the higher timeframes (H4, H1, M30) it's better to engage at Optima
FREE

Build Your Strategy Yourself This tool allows you to develop your strategies using all the indicators available natively in MetaTrader and any indicators downloaded from the internet that use buffers to display data on the screen. This tool is another reason for you to consider MetaTrader to automate your trading strategies. With it, you can create your own strategy signals in a simple and intuitive way, using any MetaTrader indicator. How Do I Know If My Internet-Downloaded Indicator Uses Buffe
FREE

Unlock key market insights with automated support and resistance lines Tired of plotting support and resistance lines? This is a multi-timeframe indicator that detects and plots supports and resistance lines in the chart with the same precision as a human eye would. As price levels are tested over time and its importance increases, the lines become thicker and darker, making price leves easy to glance and evaluate. [ Installation Guide | Update Guide | Troubleshooting | FAQ | All Products ] Boos

DESCRIPTION ICSM (Impulse-Correction SCOB Mapper) is the indicator that analyzes the price movement and identifies valid impulses, corrections and SCOBs (Single Canndle Ordere Block). It is a powerful tool that can be used with any type of technical analysis because it's flexible, informative, easy to use and it does substantially improve trader's awareness of the most liquid zones of interest.
SETTINGS General | Visuals Colour theme — defines the colour theme of the ICSM.
SCOB | Visuals Show

Chart Symbol Changer for MT5 is an indicator/utility that offers you the option to change the current chart symbol that is attached onto with a click of a symbol button on its panel. Chart Symbol Changer for MT5 gives you the option to configure the 32 symbol buttons to your personal preference, by adding the pairs you want to keep any eye on and trade the most. This way you will never miss an opportunity, because you can have a faster view of the market on your chart with just a few clicks.
FREE

Flux Core Reversal Indicator Volatility-Adaptive Reversal Signals for XAUUSD (Gold) and BTCUSD (Bitcoin) Gold (XAUUSD) and Bitcoin (BTCUSD) do not reverse because an oscillator crosses a line.
They reverse when volatility, structure, and price expansion align. If you are looking for profitable and affordable EAs checkout my pulse series - https://www.mql5.com/en/market/product/163739? Flux Core Reversal Indicator is a volatility-driven reversal detection tool designed specifically for high-mome

Overview The TTM Squeeze indicator helps identify low volatility periods (squeeze) that often precede price breakouts. It uses Bollinger Bands (BB) and Keltner Channels (KC) to determine when the market is "coiling" and ready to move. Configuration Guide Volatility Settings The indicator uses Bollinger Bands to measure market volatility. When BBs are inside Keltner Channels, a squeeze is detected. The squeeze suggests the market is consolidating and may soon break out. True Range Option Optional
FREE

Phoenix Auto Fibonacci Monitor (MT5)
Professional Fibonacci intelligence and swing analysis tool for MetaTrader 5. Automatically detects dominant market swings and delivers advanced Fibonacci retracement insight through a real-time visual dashboard.
Overview
Phoenix Auto Fibonacci Monitor automatically identifies major market swings using higher-timeframe pivot and ATR validation, then plots intelligent Fibonacci retracement levels directly on the chart. The system continuously tracks the 0.
FREE
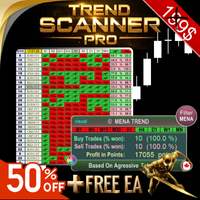
Trend Scanner PRO First of all, it’s worth emphasizing that this trading system is 100% Non-Repainting, Non-Redrawing, and Non-Lagging ,
which makes it ideal for both manual and algorithmic trading setups. Online course, user manual, and downloadable presets included. The Trend Scanner Dashboard is a professional multi pair scanner that analyzes multiple symbols and timeframes at once, giving you an instant market scanner view of the real trend direction. Instead of switching charts endl

The Magic Histogram MT5 indicator is a universal tool, suitable for scalping and medium-term trading. This indicator uses an innovative formula and allows you to determine the direction and strength of the trend. Magic Histogram MT5 is not redrawn, so you can evaluate its efficiency using history data. It is most suitable for M15, M30, H1 and H4. Magic Histogram for the MetaTrader 4 terminal : https://www.mql5.com/en/market/product/23610 Indicator Benefits Excellent indicator signals!

The fact that round number levels have a significant influence on the market cannot be denied and should not be overlooked. These psychological levels are used by both retail Forex traders and major banks that deal in Forex. Very simple and effective indicator and most importantly free. ////////////////////////////////////////////////////////////////////////////////////////////////////////////////////////////////////////////////////////////// The program does not work in the strategy tester.
FREE
Initial Balance Session The Initial Balance Indicator is a professional-grade tool for MetaTrader 5 traders, designed to enhance your trading by visualizing key price levels during the Asia, London, and US market sessions. This indicator plots the Initial Balance (IB) range—the high, low, and midpoint prices—formed during the first hour of each session, with a customizable box to highlight the range and optional extension levels for advanced analysis. Optimized for smooth, flicker-free perform

Reversal Detection Pro - Professional Trading Indicator
REVERSAL DETECTION PRO Advanced Market Turning Point Indicator for MetaTrader 5 EXECUTIVE SUMMARY Reversal Detection Pro is a sophisticated algorithmic trading indicator designed for MetaTrader 5 that identifies high-probability market reversal points with exceptional precision. Built on advanced ZigZag methodology combined with dynamic ATR-based calculations and multiple EMA filters, this professional-grade tool provides traders with acti

swing trading logic and professional MQL5 development at first glance. The candlestick chart in the center represents real market structure, showing both bearish (red) and bullish (green) movements. This highlights the indicator’s ability to capture medium-term price swings , not just short scalps. The transition from red candles on the left to green candles on the right visually communicates trend reversal and continuation , which is the core of swing trading. The curved arrows play an importa
FREE

The VR Donchian indicator is an improved version of the Donchian channel. Improvements affected almost all functions of the channel, but the main operating algorithm and channel construction were preserved. A change in the color of levels has been added to the ball indicator depending on the current trend - this clearly shows the trader a change in trend or flat. The ability to inform the trader about the breakout of one of two channel levels on a smartphone, email, or in the MetaTrader terminal
FREE

LIMITED TIME SALE - 30% OFF!
WAS $50 - NOW JUST $35! A symmetrical triangle chart pattern represents a period of contraction & consolidation before the price is forced to breakout to the upside or breakdown. A breakdown from the lower trendline marks the start of a new bearish trend, while a breakout from the upper trendline indicates the start of a new bullish trend. MT4 Version Available Here: https://www.mql5.com/en/market/product/68709/ This indicator identifies these patterns and

Trend Magic Indicator for MT5
To download All Of Our Products , you can click this link: LINK Are you interested in the Wei Wave Indicator Volume : LINK
Are you interested in the Chandelier Indicator : LINK Are you interested in the Wave Trend Oscillator : LINK Are you interested in the Support & Resistance Indicator : LINK Are you interested in the Alpha Trend Indicator : LINK Are you interested in the NRTR Indicator : LINK
Introduction The Trend Magic Indicator is a smart tool that blends

Elevate your trading precision with the Copilot HUD Precision Price & Spread Visualizer. Most traders fail because they ignore the spread or lose track of candle closing times. This indicator is designed to provide professional-grade price transparency directly on your main chart window, combining a sleek dashboard with dynamic Bid/Ask visualization. Key Features: Dynamic Bid/Ask Lines: Unlike the default MT5 lines, these lines follow the current candle with a customizable length and thickness,
FREE
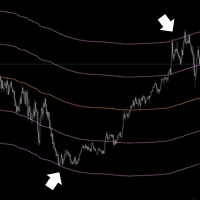
Elevate Your Trading with Advanced Anchored Volume Weighted Average Price Technology Unlock the true power of price action with our premium Anchored VWAP Indicator for MetaTrader 5 - the essential tool for precision entries, strategic exits, and high-probability trend continuation setups. Write me a DM for a 7 day free trial. Anchored VWAP Plus gives traders unprecedented control by allowing custom anchor points for Volume Weighted Average Price calculations on any chart. With support for 4 sim
FREE

Advanced ideas of the popular MACD indicator: It detects and displays classic and reverse divergences (two methods of detecting divergences). It uses different color to highlight an uptrend and a downtrend. Two methods of determining a trend: а) MACD crosses the 0 level (classic signal); б) MACD crosses its own average (early signal). This is a multi-timeframe indicator: it can display MACD data from other timeframes. Two methods of drawing: classic histogram and line. It generates sound and vis
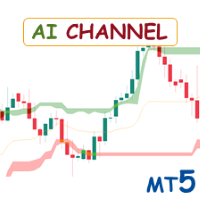
Special offer : ALL TOOLS , just $35 each! New tools will be $30 for the first week or the first 3 purchases ! Trading Tools Channel on MQL5 : Join my MQL5 channel to update the latest news from me The AI Channels Indicator utilizes rolling K-means clustering —a powerful machine learning technique in clustering analysis—to deliver real-time insights into underlying price trends. This indicator creates adaptive channels based on clustered price data, enabling traders to make informe
FREE

Multi Currency Strength Dashboard Mini (FREE) – Currency Strength Meter for MetaTrader 5 Multi Currency Strength Dashboard Mini is a free MetaTrader 5 indicator that displays the real-time relative strength of 8 major currencies (USD, EUR, GBP, JPY, CHF, CAD, AUD, NZD) in a clean, easy-to-read dashboard. Purpose: quickly spot strong vs weak currencies to build a clearer watchlist (for example: focusing on pairs where a strong currency is matched against a weak currency). Main features (Mini vers
FREE

This is an advanced indicator used with success rate.Unlock the secrets of trading Boom and Crash spikes with our powerful MT5 indicator! This spike detection tool provides accurate buy and sell signals, trade alerts, and High success rate entries. Perfect for scalping, day trading, and swing trading. Get the best Boom and Crash strategy with our Deriv Boom and Crash spike indicator. Indicator does not redraw or repaint. Recommendation
· Use a Virtual Private Server (VPS) for 24/7 alerts on mob

The Extreme Spike PRT Indicator is an effective tool for identifying sharp market fluctuations . It performs its calculations using the ATR (Average True Range) indicator and displays candles with extreme volatility in two categories: primary spikes and secondary spikes , within the Metatrader platform oscillator window. This tool assists traders in detecting intense price movements and conducting more precise analyses based on these fluctuations. Time Frame 15-minute - 1-hou

Candle Close Timer – MT5 Utility indicator for MetaTrader 5 that displays the remaining time until the current candle closes directly on the chart. Real-time countdown Appears above the active candle Adjustable color and font size Works on all symbols and timeframes Provides clear candle timing information to support chart analysis and execution planning.
FREE

Smart Liquidity Levels is a valuable tool for identifying optimal liquidity levels, enabling retail traders like us to strategically set our stop-loss orders. T he essential tool for traders seeking to maximize their trading success. The liquidity level is a critical component of inner circle trading (ICT). It assists us in determining when and how we should enter the market. Watch the video for detailed instructions. Here's why understanding liquidity levels is crucial in trading and how our

The Penta-O is a 6-point retracement harmonacci pattern which usually precedes big market movements. Penta-O patterns can expand and repaint quite a bit. To make things easier this indicator implements a twist: it waits for a donchian breakout in the right direction before signaling the trade. The end result is an otherwise repainting indicator with a very reliable trading signal. The donchian breakout period is entered as an input. [ Installation Guide | Update Guide | Troubleshooting | FAQ | A
FREE

The indicator displays peak levels of activity formed by the maximum volume, tracks the correlation of the candles on all timeframes (from the highest to the lowest one). Each volume level is a kind of key trading activity. The most important cluster is inside a month, week, day, hour, etc.
Indicator operation features A volume level receives Demand status if the nearest volume level located to the left and above has been broken upwards. A volume level receives Supply status if the nearest volu

The Pivot Point indicator automatically calculates and displays the pivot point line and support and resistance levels. Pivot can be calculated according to the Classic, Floor, Fibonacci, Woodie, Camarilla or DeMark formula. It is also possible to select the period for calculating the indicator. A trader can choose from daily, weekly, monthly, or user-defined periods.
Types of pivots Classic Floor Fibonacci Woodie Camarilla DeMark
Main features The indicator shows the current and historic
FREE

Divergence Force Divergence Indicator Description Divergence Force 1.0 is an indicator designed to identify divergences between the price of an asset and the MACD (Moving Average Convergence Divergence). This indicator automatically draws trend lines on the highs and lows of the price and MACD, highlighting potential trading opportunities. Main Features Automatic Divergence Identification : The indicator automatically detects bullish and bearish divergences between the price and the MACD. Trend
FREE
If you can’t beat them, join them.
Trade where institutions seek liquidity. Bank Levels Tracker identifies institutional price zones where stop-hunts commonly occur — just beyond obvious swing highs and lows where retail stops cluster.
These “bank levels” are plotted in real time, never repaint, and trigger instant alerts when price reaches them. Built for traders who trade bank levels directly — or use them as high-probability confluence for better-timed entries.
How Bank Levels Tracker Wo

M5 Scalp Wick Entry Arrows This indicator displays two independent types of arrows directly on the chart. Both arrow types are calculated strictly from M5 data, while the indicator can be attached to any timeframe for convenient viewing and analysis. Arrows help visually mark potential moments of interest without overloading the chart. You can adjust arrow size and colors in the settings to match your template. Tested on XAUUSD (Gold) and EURUSD.
FREE

MT5 Session Indicator: Track Global Market Hours with Precision Boost your trading strategy with this FREE Session Indicator for MetaTrader 5 , designed to help you effortlessly identify active trading sessions across global markets. Perfect for forex, stocks, and commodities traders, this tool highlights key market hours (Asian, European, North American, and overlaps) directly on your chart, ensuring you never miss high-liquidity periods. Key Features:
Visual Session Overlays : Clear color-c
FREE

Channel Searcher MT5 — Multi-Currency Price Channel Detection Indicator An auxiliary tool for automatic detection and visualization of price channels based on fractal peaks and geometric analysis. The indicator is intended exclusively for manual trading and suits traders who follow a structural market approach. It identifies channels using multiple criteria: number of touches, slope, filling density, breakout depth, and relative position of fractals. Flexible customization is available for any
FREE

This indicator calculates the volume profile and places labels that correspond to the VAH, VAL and POC levels, for each candle individually.
Indicator operation features The indicator works on the timeframes from M3 to MN, but it uses the history data of smaller periods: M1 - for periods from M3 to H1, M5 - for periods from H2 to H12, M30 - for the D1 period, H4 - for the W1 period, D1 - for the MN period. The color and location of the VAL, VAH and POC labels on the current candle are considere
FREE

BeST_Oscillators Collection is a Composite MT5 Indicato r including the Chaikin , Chande and TRIX Oscillators from which by default Chaikin and TRIX Oscillators but not Chande Momentum Oscillator are contained in MT5 platform. It also provides for each Oscillator the option of displaying or not a Mov. Average as a Signal Line and the resulting Signals as Arrows in a Normal (all arrows) or in a Reverse Mode (without showing up any resulting successive and of same type arrows).
Analytically fo
FREE
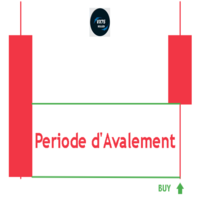
Engulfing Period V75Killed Indicator: Revolutionize Your Trading Strategy!
(This indicator is PRIVATE and exclusively for traders who know its specific purpose and value.) The Engulfing Period V75Killed Indicator is a game-changer for traders looking to effortlessly spot key engulfing periods across multiple timeframes. By marking engulfing zones directly on your chart, this indicator saves you time and enhances your ability to seize high-probability trading opportunities. Key Features: Multi-T
FREE

Session Break Out Indicator – The Ultimate Tool for Session-Based Trading The Session Break Out Indicator is a cutting-edge tool designed to help traders monitor market sessions and utilize time-based trading strategies effectively. Professional traders understand that time plays a crucial role in the forex market, as currency strength and volatility vary across different trading sessions. With this powerful indicator, you can:
Track Market Sessions – Instantly identify which session is active
FREE
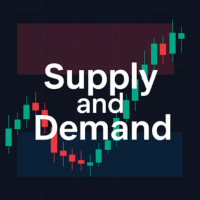
This indicator helps to draw supply and demand zones based on ICT's concepts. Traders can customize their Demand and Supply zones' color. By default, demand is red, supply is blue. The recommended way of trading by ICT is to buy in Demand Zone and sell in Supply Zone. Do keep in mind to consider multiple other confluences when trading. Do keep in mind that it is possible for supply and demand zones to overlap. In such instances, I would recommend to refrain from trading as this implies a lack of
FREE

This indicator is designed to automate the process of identifying and visualizing market structure, a cornerstone of price action and Smart Money Concepts (SMC) trading. It intelligently maps the flow of the market by plotting Higher Highs (HH), Higher Lows (HL), Lower Highs (LH), and Lower Lows (LL) directly on your chart. How It Works The indicator's logic is based on detecting pivot swing points using a configurable number of bars to the left and right of a candle. It then uses these pivots t
FREE

TG MTF MA MT5 is designed to display a multi-timeframe moving average (MA) on any chart timeframe while allowing users to specify and view the MA values from a particular timeframe across all timeframes. This functionality enables users to focus on the moving average of a specific timeframe without switching charts. By isolating the moving average values of a specific timeframe across all timeframes, users can gain insights into the trend dynamics and potential trading opportunities without sw
FREE

VWAP Fibo Bands RSJ is an indicator that traces the lines of the daily VWAP and from it creates bands using Fibonacci proportions. This spectacular indicator creates 10 band levels through the selected VWAP period using Fibonacci ratios.
It is fantastic how the prices respect each level of the bands, where it is possible to realize that almost every time the price closes above / below a level of the bands he will seek the next one. If close above will seek to reach the level above and if close
FREE

Introduction
WaveTrend Plus is an amazing oscillator that can detect optimal entry points in the market with high precision using complex computations of price and momentum. This version packs many improvements compared to the original WaveTrend such as cleaner visuals, oversold/overbought signals and divergence detection
Signal
Buy when oversold signal appear (green dot below) or when a bullish divergence is detected (green dashed line)
Sell when overbought signal appear (red dot above) or
FREE

YOU CAN NOW DOWNLOAD FREE VERSIONS OF OUR PAID INDICATORS . IT'S OUR WAY OF GIVING BACK TO THE COMMUNITY ! >>> GO HERE TO DOWNLOAD
More About Advanced Currency Meter Every good forex system has the following basic components: Ability to recognize the trend direction. Ability to identify the strength of the trend and answer the basic question Is the market trending or is it in a range? Ability to identify safe entry points that will give a perfect risk to reward (RR) ratio on every position.
FREE

The KPL Swing indicator is a simple trend following mechanical trading system which automates the entry and exit. The system works with a hard stoploss and a trailing stoploss for exit with profitable trades. No targets are given as no one knows how high (or low) a Price can move. A trailing stoploss locks in the gains and removes emotions from trading. Convert from indicator Amibroker with modified Perfect if combining with KPL Chart Uptrend & Downtrend
FREE

Easy Scalper Every Candle
MT5 Indicator is a technical analysis tool designed for gold (XAUUSD) and major forex pairs. It generates buy and sell signals on each candle using multiple filters, volume dynamics, and market structure logic. The indicator is developed for scalpers and intraday traders who require structured, rule-based signals without unnecessary complexity. Key Features 1. Candle-Based Logic Generates buy and sell signals on every candle. Uses multi-condition filters to reduce noise

Trading Dashboard Pro: The Ultimate Command Center for Serious Traders Trading Dashboard Pro is not just an indicator; it is a comprehensive risk management and account analysis utility designed for professional traders, prop firm candidates, and serious scalpers. By consolidating critical market data, account health metrics, and historical performance into a single, elegant interface, it allows you to focus on what matters most: making the right trading decisions. In the fast-paced world of For

The VWAP Session Bands indicator is a powerful tool designed for Meta Trader 5. This indicator calculates the Volume Weighted Average Price (VWAP) and its standard deviation bands within customizable daily sessions, offering traders a clear view of price trends and volatility. Unlike traditional VWAP indicators, it ensures smooth, continuous lines across session boundaries by using the previous candle's values for the current (incomplete) bar. Ideal for scalping or day trading on instruments lik
FREE

MACD Histogram tracks the difference between the MACD line and the Signal line (which is the exponential moving average of the first line). For better visibility, when plotting the lines and the histogram in the same window, we scale up the histogram by a factor of 2. Furthermore, we use two separate plots for the histogram, which allows us to color-code the bars for upticks and downticks. The MACD Combo overlays MACD lines on MACD Histogram. Putting both plots in the same window enables you to

Cybertrade Keltner Channels - MT5 Created by Chester Keltner, this is a volatility indicator used by technical analysis. It is possible to follow the trend of financial asset prices and generate support and resistance patterns. In addition, envelopes are a way of tracking volatility in order to identify opportunities to buy and sell these assets.
It works on periods longer than the period visible on the chart. All values are available in the form of buffers to simplify possible automations.
FREE

RSI Entry Points is the upgrade of the standard RSI indicator to avoid lagging. Indicator draws the clouds and the arrows to have clear picture where price is and what to wait for. Why standard RSI is lagging? because mostly we do not use it correctly and it is with very weak visual flexibility, less informativity. With my current upgrade I tried to Fix both problems same time and I got much better results and more exact entries than standard RSI has. To make yourself sure check out the screens
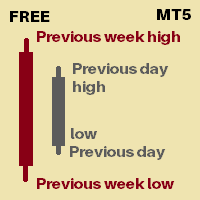
Its an indicator that will show you
Previous day high Previous day low Previous week high Previous week low You can set how many days of history you would like to see for previous day high low and previous week high low Currently 30 days of PDH/L will be marked 4 weeks of PWH/L will be marked You can change it from indicator settings. Dates are shown at marking lines to identify which date does that marking belongs to.
Thank you :) Always open to feedback and criticism if it helps me provide yo
FREE
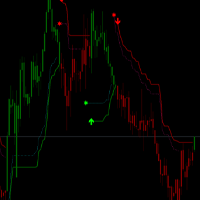
OV-VCS_ATR Trading Rules The OV-VCS_ATR indicator is a popular trend-following technical analysis tool that helps traders identify the current market trend and potential entry/exit points. Below are the general trading rules for using the OV-VCS_ATR indicator: 1. Indicator Overview The OV-VCS_ATR indicator consists of a line plotted on the price chart, which changes color to indicate the trend direction: Green Line: Indicates an uptrend (buy signal). Red Line: Indicates a downtrend
FREE

Hull Moving Average or HMA for MT5 – Fast, Smooth, Zero-Lag Trend Indicator Take your trading to the next level with the Hull Moving Average (HMA) —an ultra-responsive, zero-lag trend indicator for MetaTrader 5. Unlike SMA, EMA, or WMA, the HMA reacts instantly to market direction while filtering out noise, giving you clean, actionable signals for scalping, intraday, or swing trading. Built with a high-performance Weighted Moving Average engine, it calculates the true Alan Hull formula and outpu
FREE

This is a conventional volume indicator, which displays the ticks or real volume (if available from your broker). But it has others features like: 5 color schemes: single, when crossing with moving average, when crossing a specific level, when having different volume between bars and when candle change color. Being hable to have a customizable moving average. Being hable to have a value indicator line. Many thanks to Diego Silvestrin for the ideas to version 1.1 and Konstantin Demidov for
FREE

Phoenix Candle Timer Panel (MT5)
Real-time candle countdown timer for MetaTrader 5. Displays precise time remaining in the current candle to improve execution timing and trade discipline.
Purpose
Accurate candle timing is critical for discretionary traders and algorithmic strategies. Entering too early or too late within a candle can impact risk, spread exposure, and signal validity.
The Phoenix Candle Timer Panel provides clear countdown visibility synced to broker server time. The timer au
FREE

Metatrader 5 version of the famous Andre Machado's Tabajara indicator. If you don't know Andre Machado's Technical Analysis work you don't need this indicator... For those who need it and for those several friend traders who asked this porting from other platforms, here it is...
FEATURES
8-period Moving Average 20-period Moving Average 50-period Moving Average 200-period Moving Average Colored candles according to the inflexion of the 20-period MA
SETTINGS You can change the Period of all MA's
FREE

Combination of Ichimoku and Super Trend indicators. 1. ARC (Average Range times Constant) The concept of ARC or Volatility System was introduced by Welles Wilder Jr. in his 1978 book, New Concepts in Technical Trading Systems . It has since been adapted and modified into the popular Super Trend indicator.
The fundamental idea behind ARC is simple: to identify support and resistance levels, you multiply a constant with the Average True Range (ATR) . Then, you either subtract or add the resulting
FREE

1. Overview The Scalping PullBack Signal indicator is a powerful technical analysis tool designed to help traders identify scalping opportunities based on potential pullback and reversal signals. This tool is particularly useful on lower timeframes (below 15 minutes) but can also be applied on higher timeframes for longer-term trades. This indicator integrates several key analytical components, providing a comprehensive view of trends and potential entry/exit points, helping you make quick and e
FREE
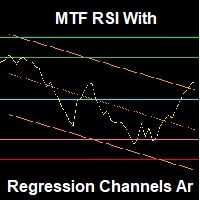
Note: The inputs of this indicator are in the Arabic language An advanced RSI indicator that displays dynamic linear regression channels in both the indicator window and the price chart, with predefined horizontal levels to detect overbought and oversold zones. Main Features (Summary): Synchronized linear regression channels on both price and RSI Multitimeframe support Smart and ready-to-use horizontal levels Professional design with optimized performance Feedback & Support We value your ex
FREE
Do you know why the MetaTrader Market is the best place to sell trading strategies and technical indicators? No need for advertising or software protection, no payment troubles. Everything is provided in the MetaTrader Market.
You are missing trading opportunities:
- Free trading apps
- Over 8,000 signals for copying
- Economic news for exploring financial markets
Registration
Log in
If you do not have an account, please register
Allow the use of cookies to log in to the MQL5.com website.
Please enable the necessary setting in your browser, otherwise you will not be able to log in.