Watch the Market tutorial videos on YouTube
How to buy а trading robot or an indicator
Run your EA on
virtual hosting
virtual hosting
Test аn indicator/trading robot before buying
Want to earn in the Market?
How to present a product for a sell-through
Technical Indicators for MetaTrader 5 - 5

EXTREME POI Indicator Join the telegram community for an exciting trading journey. https://t.me/automated_TLabs Professional Trading Indicator for MetaTrader 5/Metatrader 4
EXTREME POI is an advanced institutional-grade trading indicator designed to identify high-probability Points of Interest (POI) based on Smart Money Concepts. The indicator combines multiple sophisticated techniques to detect areas where institutional traders are likely to enter the market.
Working Pairs GOLD, EURUSD,
FREE

ATR Progress Control
Trading is all about probability, and if you don't know how much range the price has left today, you're trading blind.
This indicator is your dashboard that answers the most important question before a trade: does it make mathematical sense to enter the market right now? It's a tool for professional volatility analysis that helps filter out false entries and avoid trades when the move is already exhausted.
What's the problem?
Imagine that the average daily movement (ATR

The indicator displays profit (loss) on the current symbol. You can freely drag and drop the line to display the current profit or loss. You can find my products here
Parameters Calculation in money or in points — calculate the profit/loss in points or money. Add pending orders to calculate — take pending orders into account in calculations. Magic Number (0 - all orders on symbol) — magic number, if it is necessary to evaluate specific orders. Offset for first drawing (points from the avera
FREE
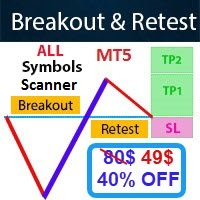
- Real price is 80$ - 40% Discount (It is 49$ now) Contact me for instruction, any questions! - Non-repaint - I just sell my products in Elif Kaya Profile, any other websites are stolen old versions, So no any new updates or support. - Lifetime update free Related product: Bitcoin Expert Introduction The Breakout and Retest strategy is traded support and resistance levels. it involves price breaking through a previous level. The break and retest strategy is designed to help traders do two main
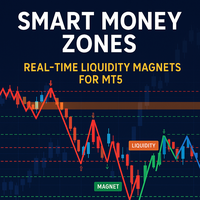
Developed according to the principles of smart money management strategies, the SM Zones indicator is a very convenient tool for traders on the MetaTrader 5 (MT5) platform. It graphically displays on the chart all the significant zones used in the SM strategy: market structure, price levels of increased liquidity, "price magnet" zones - imbalances, order blocks, fvg, breaker blocks and mitigation blocks - towards which the instrument's price moves. The zones influencing the bull market are high
FREE

VTrende Pro - MTF indicator for trend trading with a display panel for MT5 *** Videos can be translated into any language using subtitles (video language - Russian)
Although the signals of the VTrende Pro indicator can be used as signals of a full-fledged trading system,
it is recommended to use them in conjunction with the Bill Williams TS.
VTrende Pro is an extended version of the VTrende indicator. Difference between Pro version and VTrende:
- Time zones
- Signal V - signal 1-2 waves
- S
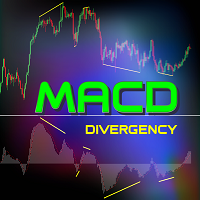
This indicator accurately identifies bullish and bearish divergences between price movements and the MACD histogram, using Exponential Moving Averages (EMA) periods of 5 (fast), 34 (slow), and a signal line period of 5. The indicator highlights points where momentum weakens, signaling potential trend reversals. Rules for Correct Divergence Identification Bullish divergence is valid when price forms lower lows and the MACD histogram simultaneously forms higher lows above the zero line. Bearish d
FREE

Real Trend Zigzag PRO shows the real trend of a market, u nlike the default Zigzag indicator. It calculates the trend in real time and shows green lines for upwards trends, red lines for downward trends and blue lines for no trends. Regarding the old slogan "the trend is your friend" it helps you to decide if should open a buy or sell position. The PRO version is a multi timeframe zigzag (MTF). Means, it shows the trend of the current timeframe as well as the trend of a higher or lower time.

Advanced SMC & Volumetric Order Block Indicator Overview
This enhanced-grade for MetaTrader 5 indicator is designed to decode market behavior using Smart Money Concepts (SMC) method . It goes beyond standard price action analysis by integrating Volumetric Data directly into market structure, helping traders identify high-probability reversal and continuation zones with precision. Key Features Volumetric Order Blocks: A unique, split-gauge visualization within Order Block zones that disp
FREE

Also check my premium spikes bot: https://www.mql5.com/en/market/product/142350 Also check my premium spikes bot: https://www.mql5.com/en/market/product/142350 Also check my premium spikes bot: https://www.mql5.com/en/market/product/142350 MEGASPIKES BOOM AND CRASH v1.32 NB: source codes of this indicator are available: PM me: https://t.me/Machofx PLEASE JOIN THE CHANNEL BELOW TO HAVE ACCESS TO ALL PREVIOUS VERSIONS check out Spikes robot
BoomCrash Cheatcode EA : https://www.mql5.com/en/ma
FREE
Indicator Description Range Filter Pro is a sophisticated trading tool for XAUUSD (Gold) that combines adaptive price filtering with volume analysis and real-time market monitoring. Designed for both novice and professional traders, this indicator helps identify trend direction, potential reversals, and significant market movements through its multi-layered approach.
Key Components 1.Dynamic Range Filter 2.Volatility-Adjusted Bands 3.Volume-Enhanced Candles 4.Professional Trading Dashboard 5.M
FREE

The Oracle is the perfect companion for traders who need accurate market analysis without managing multiple indicators.
While most indicators show single-perspective signals, The Oracle merges scientifically proven methods with proprietary enhancements into one consensus histogram. Seven models, including our Ultimate Flow Index (UFI) with Ehlers smoothing algorithms, vote independently every bar.
When enough models agree threshold you set from 4/7 aggressive to 7/7 conservative—direction be
FREE

The indicator is intended for recognition and marking 1-2-3 buy and sell patterns on a chart. The indicator will help a trade to determine the starting and signal fractals, and to specify the possible entry points on all timeframes in МetaTrader 5. Fibonacci lines are drawn on the chart to indicate supposed targets of moving on the basis of the wave theory. The 1-2-3 formations appear to be especially important as divergences (convergences) are formed on price tops and bottoms. The indicator has
FREE

FREE Heiken Ashi Smoothed indicator is fully adjustable, easy to use and comes with possibility to access the indicator via iCustom function so you can use it in your own trading software. Indicator can also pop up alerts when signal changes or send push notifications. For Metatrader 4 version click here: https://www.mql5.com/en/market/product/70824 For detailed information click: >>HERE<< Features
Easy to use Accessible via iCustom Fully adjustable Alerts and Push notifications Possib
FREE

LIMITED TIME SALE - 30% OFF!
WAS $50 - NOW JUST $35! Profit from market structure changes as price reverses and pulls back. The market structure reversal alert indicator identifies when a trend or price move is approaching exhaustion and ready to reverse. It alerts you to changes in market structure which typically occur when a reversal or major pullback are about to happen. The indicator identifies breakouts and price momentum initially, every time a new high or low is formed near a po

Step into the world of Forex trading with confidence, clarity, and precision using Gold Indicator a next-generation tool engineered to take your trading performance to the next level. Whether you’re a seasoned professional or just beginning your journey in the currency markets, Gold Indicator equips you with powerful insights and help you trade smarter, not harder. Built on the proven synergy of three advanced indicators, Gold Indicator focuses exclusively on medium and long-term trends elimina

The popular "SuperTrend" indicator is a technical analysis tool that helps identify the direction of a trend and potential entry or exit points in financial markets. The indicator is based on the Average True Range (ATR), which measures market volatility based on price ranges. It's free on other platforms and there's no reason it shouldn't be here as well! It's commonly used in three ways: To Identify the Current Trend: When the price is above this line, it's considered an uptrend, and when the
FREE

Welcome to the EPo-CreW Forex Super ORB-H4 Indicator! This guide will teach you how to use this powerful tool to identify high-probability trading opportunities based on the market's first 4-hour opening range. Whether you're a beginner or experienced trader, this system will help you trade with more confidence and consistency. THIS IS A DEMO PRODUCT, IT WILL EXPIRE AFTER 30 DAYS FROM THE DAY OF INSTALLATION. TRADING STRATEGIES STRATEGY 1: BREAKOUT & RETRACEMENT (Primary) SELL Setup:
1. Price b
FREE

RubdFx Perfect Reversal , The reversal indicator is used to determine areas of support and resistance by Drawing an arrow with a level of supply and demand ( ReversalZones ). - You will catch more swings by reducing the period, and less swings if you increase period - Mobile, computer and email alerts available . it is not pushed by price which means the arrow will stay in one place,suitable for scalping and long term trading Also Compatible with all forex paris , BUY RULES; open a buy positio

The indicator works to convert normal volume into levels and determine financial liquidity control points.
It is very similar in function to Fixed Volume Profile.
But it is considered more accurate and easier to use than the one found on Trading View because it calculates the full trading volumes in each candle and in all the brokers present in MetaTrade, unlike what is found in Trading View, as it only measures the broker’s displayed prices.
To follow us on social media platforms:
telegram
FREE

LIMITED TIME SALE - 30% OFF!
WAS $50 - NOW JUST $35! Automatically draw support and resistance levels PLUS propulsion candle gaps on your chart, so you can see where price is likely to head next and/or potentially reverse. This indicator is designed to be used as part of the position trading methodology taught on my website (The Market Structure Trader) and displays key information for targeting and potential entries. MT4 Version: https://www.mql5.com/en/market/product/97246/ There
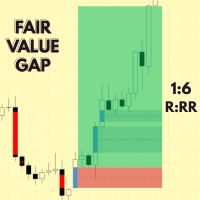
Development of this product will be discontinued. new product can be downloaded from this link. https://www.mql5.com/en/market/product/131881?source=Site+Market+My+Products+Page
Smart FVG (MT5) — Fair Value Gap Visualizer Summary
Detect and visualize Fair Value Gaps (FVGs) with ATR-aware sensitivity and optional alerts. What it does
Smart FVG identifies price ranges not overlapped by adjacent candles (FVGs) and displays them on the chart as bullish/bearish zones. Shading and colors are confi
FREE
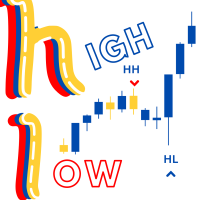
Swing High/Low Identifier
The Swing High/Low Identifier is a custom MetaTrader 5 (MT5) indicator designed to highlight significant swing points on your chart. This indicator identifies and marks swing highs and swing lows based on a configurable range of bars.
- Swing Highs are marked with red arrows above the respective candles. - Swing Lows are marked with blue arrows below the respective candles.
This tool helps traders quickly spot important price levels and patterns, which c
FREE
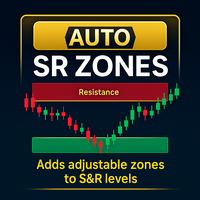
The Auto Support/Resistance Zone is an intuitive indicator for MetaTrader 5 (MT5) that enhances technical analysis by automatically creating customizable zones around horizontal lines on your chart. These zones, defined by a user-specified pip distance, visually highlight key support and resistance areas, helping traders quickly identify key price ranges and potential reversal areas.
Key Features
Dynamic Zone Creation : Automatically generates zones around horizontal lines, with adjustable p
FREE

Hull Moving Average (HMA) is well-deservedly popular among traders because of the effective averaging of market noise and a relatively small delay. The current MetaTrader 5 version changes its color when the movement direction changes. Sound and text signals are available. It also supports sending email and push messages. It is possible to trigger a signal on the current incomplete bar, although such a signal may be canceled before completion if conditions are no longer appropriate. One of the p
FREE
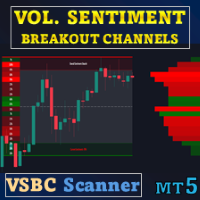
Special offer : ALL TOOLS , just $35 each! New tools will be $30 for the first week or the first 3 purchases ! Trading Tools Channel on MQL5 : Join my MQL5 channel to update the latest news from me Volume Sentiment Breakout Channels is an indicator that visualizes breakout zones based on volume sentiment inside dynamic price channels. Instead of looking only at pure technical breakouts, it focuses on how buy/sell volume is distributed within consolidation areas, thereby expressin

Visit our all-new Stein Investments Welcome Page to get the latest information, updates and trading strategies. Do you want to become a constantly profitable 5-star forex trader? Then get our Stein Investments trading tools and send us a screenshot to get your personal invitation to our exclusive trading chat with 500+ members.
FX Trend displays the trend direction, duration, intensity and the resulting trend rating for all time frames in real time.
You'll see at a glance at which direct

Are you tired of manually drawing Fibonacci levels on your charts? Are you looking for a convenient and efficient way to identify key support and resistance levels in your trading? Look no further! Introducing DrawFib Pro, the ultimate MetaTrader 5 indicator that does auto f ibonacci levels drawing on your charts and provides timely alerts when these levels are breached. With DrawFib Pro, you can enhance your trading strategies, save time, and make more informed decisions. My fibonacci base
FREE

Free automatic Fibonacci is an indicator that automatically plots a Fibonacci retracement based on the number of bars you select on the BarsToScan setting in the indicator. The Fibonacci is automatically updated in real time as new highest and lowest values appears amongst the selected bars. You can select which level values to be displayed in the indicator settings. You can also select the color of the levels thus enabling the trader to be able to attach the indicator several times with differe
FREE

Overview The Smart Money Structure Markup Indicator for MetaTrader 5 is a powerful tool designed to help traders identify key market structures based on popular Smart Money Concepts (SMC) strategies. This indicator detects micro-market structures, providing insights into price movements and potential trend changes. It highlights important elements such as valid Break of Structure (BOS), Change of Character (CHoCH), and Inducement (IDM), helping traders to make informed decisions. Key Features Ma
FREE

This is the latest iteration of my famous indicator, Reversal Fractals, published for the first time almost a decade ago. It examines the price structure of fractals to determine possible reversal points in the market, providing timing to positional traders that already have a fundamental or technical valuation model. [ Installation Guide | Update Guide | Troubleshooting | FAQ | All Products ] Reversal fractals can start long trends The indicator is non repainting
It implements alerts of all ki
FREE
This indicator has been developed as an analytical tool based on exponential moving averages (EMA) . Its purpose is to provide additional insights into market dynamics using two exponential moving averages (EMA) and one smoothed exponential moving average (SMMA) . The indicator can be applied to different financial instruments and timeframes, depending on user preferences. Some traders use it on 30-second charts , complementing it with a 2-minute chart . How the Indicator Works The analysis is b
FREE
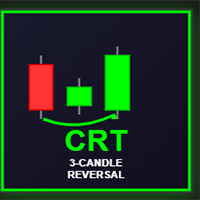
CRT Bomb Indicator - MT5 Full Version The CRT Bomb is a professional trading indicator that detects high-probability 3-candle reversal patterns (CRT - Candle Reversal Technique) across all timeframes and symbols. VPS is recomended so that you dont miss any CRT setups as they form , for entries you can use your manual analysis for confirmation like FVG, OBS etc Works on all Pairs ,Metals & Indices Key Features: Identifies impulse-trap-reversal candle structures Provides visual arrows and patter
Engulfing Candle Signal Alert: Elevate Your Trading Strategy Unlock the full potential of your trading with the Engulfing Candle Signal Alert, the ultimate tool for identifying market reversals and enhancing your trading precision. Designed specifically for traders who value accuracy and timely alerts, this powerful indicator detects engulfing candle patterns, a key signal in technical analysis that often indicates a potential shift in market direction. What is an Engulfing Candle? An engu
FREE

Do you know VWAP Bands? It is an indicator used to identify support and resistance points from the daily VWAP and you can use it to check the best entry and exit points. This indicator does not use the principle of bollinger bands. There is a difference in the calculation method. Use it according to your strategy. See the applications and what results you can get. The indicator is free and can be used on any account.
FREE

Breakthrough Solution For Trend Trading And Filtering With All Important Features Built Inside One Tool! Trend PRO's smart algorithm detects the trend, filters out market noise and gives entry signals with exit levels. The new features with enhanced rules for statistical calculation improved the overall performance of this indicator.
Important Information Revealed Maximize the potential of Trend Pro, please visit www.mql5.com/en/blogs/post/713938
The Powerful Expert Advisor Version
Automatin
About Range Explosion Range Explosion is a powerful and free trading tool designed to detect market ranges, draw precise support and resistance zones, and identify breakout opportunities with accuracy and style.
It is a part of the Break Out Explosion Project, offering traders a reliable and visually advanced solution for both beginners and professionals. If you are interested in breakout trading concepts, check out the advanced tool designed to detect trendline breakouts in the direction of the
FREE

Ekom Spike Detector Pro
Take your trading to the next level with the Ekom Boom and Crash Spike Detector Indicator Pro, designed for serious traders who demand more. This advanced version provides: Key Features: Accurate Spike Detection: Identify high-probability spike patterns in real-time using price action Clear Visual Signals: Displays clear buy and sell arrows on the chart for easy decision-making Alert options : MT5 Alert/Notification to receive alerts on your mobile when signal
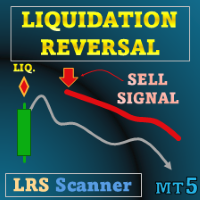
Special offer : ALL TOOLS , just $35 each! New tools will be $30 for the first week or the first 3 purchases ! Trading Tools Channel on MQL5 : Join my MQL5 channel to update the latest news from me Liquidation Reversal Signals is an indicator designed to mark directional liquidation phases and confirm reversal points by combining Z-score volume extremes with Supertrend state changes. Instead of printing an arrow whenever a trend simply “changes color,” this tool s

Candle Time CountDown By BokaroTraderFx The Candle Timer Countdown Indicator is a versatile tool designed for the MetaTrader 5 (MT5) trading platform. It provides traders with a visual countdown of the remaining time for the current candle on a chart. The key features include:
Customizable Position: Place the countdown timer in any corner of the chart for optimal visibility. Default Text Color: Set to red for clear visibility, with options for further customization. Minimal Display: Shows only
FREE

The Breakout Finder (BF) is a powerful MetaTrader 5 indicator designed to detect potential breakout and breakdown opportunities in price action. By analyzing pivot highs and lows over a user-defined period, it identifies consolidation zones where price has repeatedly tested resistance or support levels within a narrow channel. When price breaks out of these zones with sufficient confirmation (based on the minimum number of tests and channel width threshold), the indicator visually highlights th
FREE

OMEGA ONE SPIKE DETECTOR: Catch Every Explosive Move /Spikes with Surgical Precision
"I Used To Watch Spikes Fly By - Now I Catch Them Consistently Using Institutional Order Levels"
WATCHING 500-POINT SPIKE and not profiting? ENTERING TOO LATE after the big move already happened? GETTING STOPPED OUT right before the explosion?
What If You Could See Spikes BEFORE They Happen - And Know Exactly Where to Enter?
Introducing Omega One Spike Detector - The Only Tool That Combines Real-T
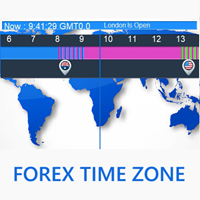
Short Introduction to Forex Time Zone Welcome to a new free professional tool— Forex Time Zone . Pro traders understand how important time is in forex trading. Every second, some markets around the world open while others close, impacting market volatility and influencing the movement of individual currencies. This tool helps traders easily identify which market is open right now and the current time zone. How Does It Work? Simply choose your time zone based on your country and attach the indic
FREE
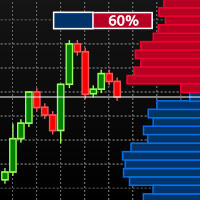
Visual Book on Chart is an indicator designed specially for stocks and futures market. To check if you can use the tool with your Broker open the MT5 Depth Of Market on your terminal and check if there are price and volume data available. Learn more about the MT5 Depth Of Market in the oficial page. The indicator shows the depth of market data on the chart window and use gradient based on the market data to colorize the histogram bars. The indicator is formed by two components: The panel, whic
FREE

Unlock market continuations with the accurate pennants indicator
This indicator finds pennants , which are continuation patterns identified by converging trendlines surrounding a price consolidation period. Trades are signaled using a breakout period alongside the formation breakout. [ Installation Guide | Update Guide | Troubleshooting | FAQ | All Products ] Easy to use Customizable colors and sizes It implements breakout signals It implements alerts of all kinds
Optimal Usage To see pennants

Symbols: USDCHF, USDJPY , XAUUSD, GBPUSD, EURUSD, AUDUSD, GBPJPY ( I Love USDCHF_H1 )
Timeframes: H1, H4, D1
Important features : No repaint, no lag, indirection signal, multi confirmation
Safety : signals contain stop loss , take profit and respect risk to reward rule
Includes: Free Multi-Time-Frame Scanner (After purchasing this product, simply send me a screenshot via private message and I will personally send you the Screener file.)
Full trading system concept : Read Article (full conc
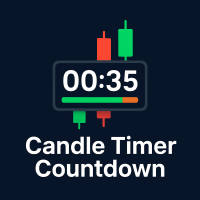
Candle Timer Countdown v2.5 is an advanced MQL5 indicator designed to enhance your trading precision. It provides a live countdown for each candle while simultaneously analyzing multiple timeframes to detect trend direction and potential early reversals. Key features include: Candle Countdown & Progress Bar: Monitor the exact time remaining for each candle with a clear progress visualization. Advanced Trend Detection: Analyze both fast and slow trends with configurable sensitivity and multi-time
FREE

RiskKILLER_AI Navigator is an AI-based, Multi-timeframe Market Direction & Strategy Assistant. Trading performance is about understanding the market like professionals do. That's exactly what the RiskKILLER_AI Navigator delivers: Gain institutional-level insights with AI-driven trend, sentiment, and macro analysis external to MQL5 , tailored to your trading style. After purchase, to get the User Manual, 1. post a comment asking for it 2. send me a direct message . [ Dedicated group | Version MT5

Advanced Stochastic Scalper MT5 is a professional indicator based on the popular Stochastic Oscillator. Advanced Stochastic Scalper is an oscillator with dynamic overbought and oversold levels, while in the standard Stochastic Oscillator, these levels are static and do not change. This allows Advanced Stochastic Scalper to adapt to the ever-changing market. When a buy or a sell signal appears, an arrow is drawn on the chart and an alert is triggered allowing you to open a position in a timely ma

Detailed Description:
The Pivot Points Indicator is designed for traders who rely on pivot points, midpoints and support/resistance levels for their trading strategies. By automatically calculating and plotting these levels (based on the previous period's high, low, and close prices) , the indicator provides a clear, visual representation of critical price areas where the market may reverse or break out.The tool is particularly useful for day traders and swing traders looking to base th
FREE

Phoenix Trend Strength Meter (MT5)
Market regime and trend strength analyzer for MetaTrader 5. Combines ADX, RSI, and Directional Movement into a single panel to classify market conditions in real time.
Purpose
Most traders fail not because of bad entries, but because they apply the wrong strategy to the wrong market regime. The Phoenix Trend Strength Meter helps traders instantly determine whether the market is ranging, developing a trend, in a strong trend, or entering exhaustion risk terr
FREE

Adaptive Volatility Range [AVR] - is a powerful tool for identifying key trend reversals. AVR - accurately displays the Average True Volatility Range taking into account the Volume Weighted Average price. The indicator allows you to adapt to absolutely any market volatility by calculating the average volatility over a certain period of time - this provides a stable indicator of positive transactions. Thanks to this , Adaptive Volatility Range has a high Winrate of 95% There are two ways t

Haven Bar Replay — Your Personal Trading Simulator Introducing Haven Bar Replay – a professional simulator for manual trading and strategy testing. It transforms your MT5 chart into a historical player, allowing you to live through months of market movements in just a minutes. Check out my other products -> CLICK HERE . Do you want to learn how to trade profitably but aren't ready to wait hours for setups to form? This tool is designed for you. Train your eyes, test hypotheses, and hone yo
FREE

The SMC Market Structure indicator tracks key price action shifts using Smart Money Concepts (SMC), helping traders identify institutional behavior and overall trend direction.
It automatically detects and displays: Break of Structure (BOS) – Signals continuation of trend Change of Character (CHOCH) – Indicates potential reversal Swing Highs and Lows – Used to define market structure and directional bias
Each structural event is clearly marked on the chart, allowing traders to visualize momentu
FREE

If you like this project, leave a 5 star review. This indicator draws the open, high, low and closing prices for the specified
period and it can be adjusted for a specific timezone. These are important levels looked by many institutional and professional
traders and can be useful for you to know the places where they might be more
active. The available periods are: Previous Day. Previous Week. Previous Month. Previous Quarter. Previous year. Or: Current Day. Current Week. Current Month. Current
FREE

non-repaint free MT5 technical indicator works on all timeframes 1 minute to the monthly timeframe the trade vision buy and sell arrow is a multi currency and synthetic indicator Trade vision buy and sell arrow comes with Push Alerts purple arrow look for selling opportunities white arrow look for buying opportunities. wait for candle to close and arrow to appear before taking any trades.
FREE
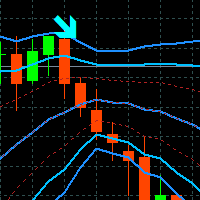
Tyr Bands Indicator
Tyr Band works with BB and 3 different deviations, plus the Stochastic confirmation. So when the price closes below/above the BB Reversal Band (Red) and the Stoch is in the confirmation zone, then the arrow (buy/sell) appears. This arrow indicates that we can entry to the market up/down on the next opening. Since it is only an indicator, it will not place SL or TP, we need to have them placed manually if you want to trade. The SL will lie on the external BB band (Blue), and
FREE

YOU CAN NOW DOWNLOAD FREE VERSIONS OF OUR PAID INDICATORS . IT'S OUR WAY OF GIVING BACK TO THE COMMUNITY ! >>> GO HERE TO DOWNLOAD
This system is an Heiken Ashi system based on RSI calculations . The system is a free open source script originally published on TradingView by JayRogers . We have taken the liberty of converting the pine script to Mq4 indicator . We have also added a new feature which enables to filter signals and reduces noise on the arrow signals.
Background
HEIKEN ASHI
Th
FREE

Candle counter This indicator counts and identifies candles based on a longer time frame Bigger Timeframe You can choose the daily timeframe as " Bigger Timeframe ", and run it within any smaller chart. that it will count the bars based on the daily chart . If you pass as a parameter the timeframe " H1 " then the indicator will know how to count the bars inside the H1 chart you just need to run it on smaller charts. The main parameter is the " Bigger Timeframe " which is a larger timeframe than
FREE

The trend is your friend!
Look at the color of the indicator and trade on that direction. It does not repaint. After each candle is closed, that's the color of the trend. You can focus on shorter faster trends or major trends, just test what's most suitable for the symbol and timeframe you trade. Simply change the "Length" parameter and the indicator will automatically adapt. You can also change the color, thickness and style of the lines. Download and give it a try! There are big movements w

Introducing the Quantum Heiken Ashi PRO charts with integrated alerts Designed to provide clear insights into market trends, the Heiken Ashi candles are renowned for their ability to filter out noise and eliminate false signals. Say goodbye to confusing price fluctuations and hello to a smoother, more reliable chart representation. What makes the Quantum Heiken Ashi PRO truly unique is its innovative formula, which transforms traditional candlestick data into easy-to-read colored bars. Red and g

Ultimate SMC: Professional Smart Money Concepts Indicator Unlock the hidden movements of the market. Trade with the institutions, not against them. The Ultimate SMC indicator is designed for serious traders who want to apply Smart Money Concepts (SMC) to their charts automatically. Manual SMC analysis is time-consuming and prone to subjective error. This tool removes the guesswork by algorithmically detecting Order Blocks, Fair Value Gaps, and Structural breaks in real-time. Whether you are a s
FREE

L'indicatore "Heikin Ashi" è stato progettato per migliorare l'analisi dei grafici finanziari con un sistema di candele Heikin Ashi. Le candele Heikin Ashi sono un metodo avanzato per visualizzare il prezzo, che aiuta a filtrare il rumore del mercato, rendendo più chiara l'interpretazione dei trend e migliorando la qualità delle decisioni di trading. Questo indicatore consente di visualizzare le candele Heikin Ashi al posto delle candele giapponesi tradizionali, rendendo l'analisi grafica più pu
FREE

Phoenix Support & Resistance Detector (MT5)
Professional support and resistance detection tool for MetaTrader 5. Auto-detects the strongest S&R levels from a higher timeframe and displays comprehensive strength analysis through a visual dashboard.
Overview
Phoenix Support & Resistance Detector identifies the three strongest support and resistance levels using higher timeframe pivot analysis (H4 default, customizable). The system ranks levels by test count, consolidation bars, and proximity t
FREE

VM Heiken Ashi Pro Heiken-Ashi smoothed (HMA or EMA) to filter noise and generate clear BUY/SELL signals, non-repainting (optional ConfirmOnClosedBar). Displays HA candles on chart (original candles can be hidden), arrow placement by ATR or fixed offset, sends alerts (popup, email, push) with anti-spam handling. Main purpose
Convert raw candles into smoothed Heiken-Ashi to detect color changes (bear to bull / bull to bear) and draw arrows for entries. The option ConfirmOnClosedBar lets the ind

Welcome to our Price Wave Pattern MT5 --(ABCD Pattern)-- The ABCD pattern is a powerful and widely used trading pattern in the world of technical analysis.
It is a harmonic price pattern that traders use to identify potential buy and sell opportunities in the market.
With the ABCD pattern, traders can anticipate potential price movements and make informed decisions on when to enter and exit trades. EA Version: Price Wave EA MT5
MT4 Version : Price Wave Pattern MT4
Features :
Automatic
FREE
Enhance your price action trading with the Higher Highs and Lows MT5 indicator, a robust tool that leverages fractal analysis to pinpoint key swing points and identify trend-defining patterns like Higher Highs (HH), Lower Highs (LH), Lower Lows (LL), and Higher Lows (HL) for clear insights into market direction. Drawing from foundational price action principles rooted in Dow Theory from the early 1900s and popularized in modern trading by experts like Al Brooks in his "Trading Price Action" seri
FREE

Volume & Liquidity Hunter – Scalping is a professional-grade scalping indicator designed to track real-time volume surges and liquidity zones across multiple timeframes. It combines smart money concepts with live trading conditions, making it an ideal tool for precision scalping.. Whether you’re trading reversals, breakouts, or fair value gaps — this indicator helps you identify where real buying and selling pressure is concentrated.
Real-Time Volume Detection Tracks tick volume spikes and com
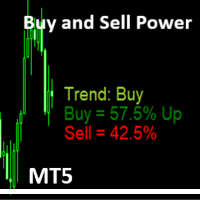
Simple Indicator that shows the Buy and Sell volume in percent. The Buy and Sell Power indicator for MetaTrader 5 calculates and displays estimated buy/sell volume percentages over a user-defined period (default: 14 bars) using tick volume data. It overlays text labels on the chart showing Buy % (with "Up" if >51%), Sell % (with "Dn" if >51%), and a trend signal based on thresholds: Neutral (<55%), Trend: Buy/Sell (55%+), Trend: Strong Buy/Sell (62%+), Trend Max UP/Down (65%+), or Trend change s
FREE
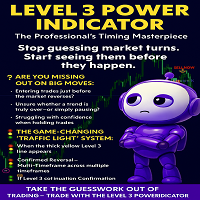
LEVEL 3 POWER INDICATOR
The Professional’s Timing Masterpiece
Stop guessing market turns. Start seeing them before they happen.
---
Are You Missing Out on Big Moves?
Entering trades just before the market reverses?
Unsure whether a trend is truly over—or simply pausing?
Struggling with confidence when holding trades?
You’re not alone. Most traders wrestle with these exact challenges… until they discover the Level 3 Power Indicator.
---
The Game-Changing “Traffic Light” Syst
FREE
Do you know why the MetaTrader Market is the best place to sell trading strategies and technical indicators? No need for advertising or software protection, no payment troubles. Everything is provided in the MetaTrader Market.
You are missing trading opportunities:
- Free trading apps
- Over 8,000 signals for copying
- Economic news for exploring financial markets
Registration
Log in
If you do not have an account, please register
Allow the use of cookies to log in to the MQL5.com website.
Please enable the necessary setting in your browser, otherwise you will not be able to log in.