Watch the Market tutorial videos on YouTube
How to buy а trading robot or an indicator
Run your EA on
virtual hosting
virtual hosting
Test аn indicator/trading robot before buying
Want to earn in the Market?
How to present a product for a sell-through
Technical Indicators for MetaTrader 5 - 11

Crypto_Forex Indicator "Trend Correction Histogram" for MT5. Trend Correction Histogram can be in 2 colors: red for bearish trend and blue for bullish one. 7 consecutive histogram columns of the same color means beginning of new trend. Trend Correction Histogram indicator designed with the main purpose - to minimize losses and maximize profit. It has parameter - "Period", responsible for indicator's sensitivity. Built-in Mobile and PC alerts. Trend Correction Histogram can be use as a simple b

Market Imbalance Detector is a technical analysis indicator designed to highlight price imbalances, commonly known as Fair Value Gaps (FVGs). The indicator detects imbalance zones using a precise three-candle structure and displays them directly on the chart as visual zones. These areas represent price inefficiencies that may act as potential reaction or interest zones in future price movement. Features Detects bullish and bearish market imbalances Uses a true three-candle structure Works on
FREE

Introduction The "Ultimate Retest" Indicator stands as the pinnacle of technical analysis made specially for support/resistance or supply/demand traders. By utilizing advanced mathematical computations, this indicator can swiftly and accurately identify the most powerful support and resistance levels where the big players are putting their huge orders and give traders a chance to enter the on the level retest with impeccable timing, thereby enhancing their decision-making and trading outcomes.
FREE

A simple indicator that automatically highlights all FVGs (Fair Value Gaps) formed on the chart, as well as FVGs on history. It is possible to select colors for FVGs of different directions (long or short), select the time interval, select the color of middle point and you can also choose whether to delete filled FVGs or leave them on the chart (the option is beneficial for backtesting). The indicator can be very useful for those, who trade according to the concept of smart money, ICT, or simply
FREE

The TickCounter indicator counts up and down ticks on each new bar.
The calculation starts from the moment the indicator is placed on the chart.
Histogram bars represent: Yellow bars - total number of ticks; Blue bars - ticks UP; Red bars - ticks DOWN. If the blue bar is not visible, then there are more down ticks and the red bar is displayed on top of the blue one (the red layer is above the blue one). MT4 version: https://www.mql5.com/en/market/product/82548 Each reinitialization of the in

Build Your Strategy Yourself This tool allows you to develop your strategies using all the indicators available natively in MetaTrader and any indicators downloaded from the internet that use buffers to display data on the screen. This tool is another reason for you to consider MetaTrader to automate your trading strategies. With it, you can create your own strategy signals in a simple and intuitive way, using any MetaTrader indicator. How Do I Know If My Internet-Downloaded Indicator Uses Buffe
FREE

Presenting one-of-a-kind Gann Indicator for XAUUSD
IQ Gold Gann Levels is a non-repainting, precision tool designed exclusively for XAUUSD/Gold intraday trading. It uses W.D. Gann’s square root method to plot real-time support and resistance levels, helping traders spot high-probability entries with confidence and clarity. William Delbert Gann (W.D. Gann) was an exceptional market analyst whose trading technique was based on a complex blend of mathematics, geometry, astrology, and ancient calcul

CurvedSmoothChannel_Enhanced - Enhanced Price Channel Indicator
**CurvedSmoothChannel_Enhanced** is a powerful and visually appealing price channel indicator designed for MetaTrader 5 that helps you identify trends, potential reversals, and key price levels with precision. This enhanced version combines the power of the Hull Moving Average (HMA) and John Ehlers' Super Smooth Filter, creating a dynamic, adaptive channel that adjusts to market conditions across multiple time frames. #### Key Fea
FREE
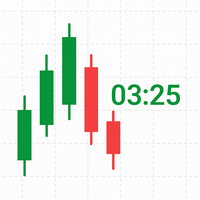
TimeLeftCandle – Countdown Clock for Candles in MT5 Overview
TimeLeftCandle is an indicator for MetaTrader 5 that displays in real time the remaining time until the current chart candle closes. Its design is minimalist, clear, and movable, adapting to any type of chart and trading style. Ideal for traders who need to precisely track candle closing times and make timely decisions. Main Advantages Clear and precise display: A digital-style counter to know exactly how much time is left before the
FREE

Do you love VWAP? So you will love the VWAP Cloud . What is it? Is your very well known VWAP indicator plus 3-levels of Standard Deviation plotted on your chart and totally configurable by you. This way you can have real Price Support and Resistance levels. To read more about this just search the web for "VWAP Bands" "VWAP and Standard Deviation".
SETTINGS VWAP Timeframe: Hourly, Daily, Weekly or Monthly. VWAP calculation Type. The classical calculation is Typical: (H+L+C)/3 Averaging Period to
FREE
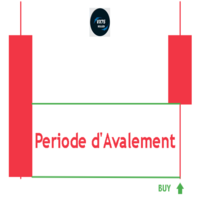
Engulfing Period V75Killed Indicator: Revolutionize Your Trading Strategy!
(This indicator is PRIVATE and exclusively for traders who know its specific purpose and value.) The Engulfing Period V75Killed Indicator is a game-changer for traders looking to effortlessly spot key engulfing periods across multiple timeframes. By marking engulfing zones directly on your chart, this indicator saves you time and enhances your ability to seize high-probability trading opportunities. Key Features: Multi-T
FREE

The Quantitative Qualitative Estimation (QQE) indicator is derived from Wilder’s famous Relative Strength Index (RSI). In essence, the QQE is a heavily smoothed RSI.
Modification of this version: ( converted from tradingview script by Mihkell00, original from Glaz, 100% identical output)
So there are Two QQEs. One that is shown on the chart as columns, and the other "hidden" in the background which also has a 50 MA bollinger band acting as a zero line.
When both of them agree - you get a b
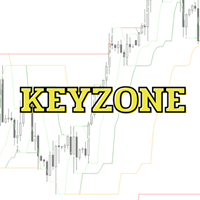
Keyzone is an indicator designed to identify support and resistance levels for trading, categorized into four key levels: 3, 8, 21, and 89. These levels are derived from an advanced adaptation of the Smart Money Concept (SMC) , ensuring high efficiency while maintaining simplicity. With its minimalist yet powerful design, Keyzone can be seamlessly applied to various trading styles, including:
Scalping – Quick, high-frequency trades Swing Trading – Capturing medium-term price movements Trend Foll
FREE

Bias Scanner Pro identifies market direction and trend strength in real time, giving you a clear view of bullish, bearish, or neutral bias. By combining EMA crossovers with ADX trend analysis, it delivers precise market context and actionable insights for traders of any style. How It Works Bias Detection: Fast and slow EMA crossovers identify bullish, bearish, or neutral market direction. Trend Strength Confirmation: ADX measures trend intensity, confirming whether the market is trending, rangin
FREE

Enhance your trading analysis with the Haiken Ashi MT5 indicator. This powerful tool transforms standard price data into smoother, trend-following candlesticks, making it easier to identify market trends and potential reversal points. Key Features: Clear Trend Identification: Visually distinguish between uptrends and downtrends with distinct candle colors. Reduced Noise: Filter out price fluctuations, providing a clearer view of underlying market movements. Early Trend Detection: Anticipate
FREE

本指标 基于 Zigzag 基础上... 增加了: 1.增加了箭头指示,使图表更鲜明 2.增加了价格显示,使大家更清楚的看清价格. 3.增加了报警等设置,可以支持邮件发送 原指标特性: 1.基本的波段指标构型. 2.最近的2个ZIGZAG点不具有稳定性,随着行情而改变,(就是网友所说的未来函数) 3.原指标适合分析历史拐点,波段特性,对于价格波动有一定的指导性.
Zigzag的使用方法一 丈量一段行情的起点和终点 (1)用ZigZag标注的折点作为起点和终点之后,行情的走势方向就被确立了(空头趋势); (2)根据道氏理论的逻辑,行情会按照波峰浪谷的锯齿形运行,行情确立之后会走回撤行情,回撤的过程中ZigZag会再次形成折点,就是回撤点; (3)在回撤点选择机会进场,等待行情再次启动,止损可以放到回撤的高点。 一套交易系统基本的框架就建立起来了。 Zigzag的使用方法二 作为画趋势线的连接点 趋势线是很常见的技术指标,在技术分析中被广泛地使用。 但一直以来趋势线在实战中都存在一个BUG,那就是难以保证划线的一致性。 在图表上有很多的高低点,到底该连接哪一个呢?不同的书上画趋势线的方法
FREE
Dynamic Swing Anchored VWAP is a precision price–volume tool designed to stay relevant to live market conditions. Instead of a static VWAP that drifts further away as sessions progress, this indicator anchors VWAP to fresh swing highs and lows and adapts its responsiveness as volatility changes. The result is a fair-value path that follows price more closely, making pullbacks, retests, and mean-reversion opportunities easier to identify and trade. CORE FEATURES
Swing Anchoring Automatically d
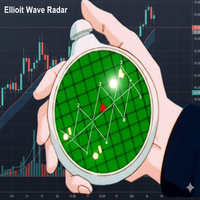
What This Indicator Does This indicator automatically analyzes the chart to identify Elliott Wave patterns (impulses and corrections) and shows you where waves 1, 2, 3, 4, and 5 are in real-time. It also includes price projections , volume validation , and triangle detection . How Does the "Radar" Version Improve on It? Target Projection: It suggests where the price might be headed in wave 5. Volume Validation: It confirms whether volume supports the detected pattern. Triangle Detection: It iden
FREE

Perfect Day Scalper Pro
Your Daily 5-Point Routine for a 5-Figure Income.
Price: $150 USD (Stop Chasing, Start Cashing)
---
One Trade. One Target. One Victory Lap. Your Day is Done.
(Forget the 1000+ pip dreams that turn into 100+ pip losses. Real wealth is built on consistency, not complexity. What if your entire trading day was over in 15 minutes, with a single, high-probability trade that hands you a clean, professional profit? Welcome to the Perfect Day Scalper.)
---
What is The
FREE

Elliot Waves Analyzer calculates Elliot Waves to Help Identify Trend direction and Entry Levels. Mainly for Swing Trading Strategies. Usually one would open a Position in trend direction for Wave 3 or a Correction for Wave C . This Indicator draws Target Levels for the current and next wave. Most important Rules for Elliot Wave Analysis are verified by the Indicator. This free version is limited for Analyzing one Timperiod Waves. Waves are Shown only in PERIOD_H4 and above. Not Useful for Intr
FREE

IQ Trade Status – A Professional Trade Panel to track all your LIVE TRADES in a single dashboard. IQ Trade Status is not just a trade panel; it is a professional dashboard designed for MetaTrader. It replaces the default Terminal window with a clean, structured, and actionable overview of your account and open trades.
The dashboard is designed to help you instantly answer three critical questions: How much have I made today? How much will I lose if all my trades go wrong? Is my account over-lev
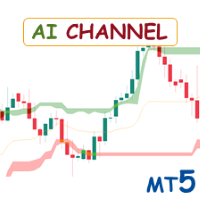
Special offer : ALL TOOLS , just $35 each! New tools will be $30 for the first week or the first 3 purchases ! Trading Tools Channel on MQL5 : Join my MQL5 channel to update the latest news from me The AI Channels Indicator utilizes rolling K-means clustering —a powerful machine learning technique in clustering analysis—to deliver real-time insights into underlying price trends. This indicator creates adaptive channels based on clustered price data, enabling traders to make informe
FREE

Supply / demand zones: observable areas where price has approached many times in the past. Multifunctional trade manager: 66+ features , including this indicator | Contact me for any questions | MT4 version The indicator shows where the price could potentially be reversed again. Usually, the more times the price has been rejected from the level, the more significant it is. In the input settings you can adjust: Enable or disbale Weak zones; Show or hide zone description; Font size;
AlgoRhythm ZLSMA - The Ultimate Trend Trading Solution Unlock the power of precision trading with AlgoRhythm ZLSMA , an advanced technical indicator designed to deliver razor-sharp trend signals. Engineered for MetaTrader 5, this cutting-edge Zero Lag Smoothed Moving Average (ZLSMA) combines sophisticated smoothing techniques, multi-timeframe analysis, and dynamic bands to give traders a competitive edge in any market. Whether you're a scalper, swing trader, or long-term investor, AlgoRhythm ZLS
FREE

Daily Zone Breaker - MT5 Indicator Overview Daily Zone Breaker is an advanced multi-kernel regression indicator that identifies critical price zones and breakthrough moments with surgical precision. Using sophisticated kernel smoothing algorithms, it filters out market noise to reveal true directional momentum and key trading zones where price is most likely to break through resistance or support levels. What It Does Core Functionality Daily Zone Breaker analyzes price action through 17 differ

Blahtech Fisher Transform indicator is an oscillator that displays overbought and oversold locations on the chart. The Fisher Transform algorithm transforms prices with any distribution shape into a normal distribution. The end result is a curve with sharp turning points that may help to identify bullish or bearish trends. Fisher Transform values exceeding 1.66 on the daily chart are considered to be good areas for reversal trades. Links [ Install | Update | Training | All Products ]
F

The ultimate M5 indicator for Boom 300 indx, providing clear, filtered buy/sell signals to eliminate market noise and enhance your trading precision. Benefit-Focused spike alert on time
spike signals
spike trade sl 5 candels
trend following dashboard to know trend strength and direction
use it in any market conditions and it will help you to stay profitable and consistent it send mt5 and mobile notification alert right on time all signals are non repaint and no lag

Introducing Indicator for PainX and GainX Indices Traders on Weltrade Get ready to experience the power of trading with our indicator, specifically designed for Weltrade broker's PainX and GainX Indices. Advanced Strategies for Unbeatable Insights Our indicator employs sophisticated strategies to analyze market trends, pinpointing optimal entry and exit points. Optimized for Maximum Performance To ensure optimal results, our indicator is carefully calibrated for 5-minute timeframe charts on

Volume Profile Pro Signals
Precision volume analysis meets automatic signal generation. What It Does
Volume Profile Pro Signals builds a live, data-driven picture of where trading volume truly occurs — exposing market zones where price is accepted or rejected. It highlights POC, VAH, VAL, and identifies HVN/LVN areas with exact accuracy. From that foundation, it generates real-time breakout signals (VAH/VAL) and plots smart SL/TP levels from ATR volatility data. Every component — from profile

The trend is your friend!
Look at the color of the indicator and trade on that direction. It does not repaint. After each candle is closed, that's the color of the trend. You can focus on shorter faster trends or major trends, just test what's most suitable for the symbol and timeframe you trade. Simply change the "Length" parameter and the indicator will automatically adapt. You can also change the color, thickness and style of the lines. Download and give it a try! There are big movements w

Think of the rarest pair you can think of. And I assure you that this indicator can compute it is strength. This Currency Meter will literally calculate any currency pairs, either it is a major pair, metal, CFD, commodity, cryptocurrency like Bitcoin/BTC or Ethereum/ETH and even stocks. Just name it and you will get it! There is no currency pair this Currency Meter cannot solve. No matter how rare or exotic is that currency, it will always be solved by this Currency meter on a real-time basis. S

ADVANCED MARKET ANALYSIS INDICATOR Overview of the Indicator
This is not a simple indicator — it’s a multi-analysis predictive system. It combines:
Volume Profile (POC, VAH, VAL)
Fibonacci Extensions
Pivot Levels (Daily, Weekly, 4H)
Trend Determination (MA-based)
Smart Money Concepts & Pattern Detection (basic placeholders for expansion)
Prediction Engine (projects price forward for 1 hour)
It gives you:
Target Price Line (projection)
Stop Loss Line (usually at Volume POC)
FREE

the indicator uses multiple time frames to analyze for the best buying entries in boom 1000. it is tailored to help trade on boom spikes only. the indicator has two arrows; red and blue ones. the formation of the red arrow indicates that you should be ready for a blue arrow which is a buy entry signal. the indicator does not offer exit points. always collect 30 pips i.e if you entered a trade at 10230.200 you can exit at 10260.200 with SL at 10 pips i.e at 10220.200. if you observe that rule and
FREE

Fractals Dynamic Fractals Dynamic – is a modified free fractal indicator by Bill Williams, in which you can manually set the number of bars on the left and right, thereby building unique patterns on the chart. Now all trading strategies based on or based on the Fractals Dynamic indicator will have an additional signal.
In addition, fractals can act as support and resistance levels. And in some trading strategies, show liquidity levels. For this purpose, levels were introduced in this version
FREE

[TH] คำบรรยายสินค้า: The Horse Pro Signal (WinWiFi Robot Series) The Horse Pro Signal คืออินดิเคเตอร์ระดับมืออาชีพรุ่นล่าสุดจากตระกูล WinWiFi Robot Series ออกแบบมาสำหรับแพลตฟอร์ม MetaTrader 5 (MT5) โดยเฉพาะ เพื่อช่วยเทรดเดอร์ในการวิเคราะห์พฤติกรรมราคา (Price Action) ทั้งในสภาวะตลาดที่มีเทรนด์ชัดเจนและช่วงตลาดไซด์เวย์ (Sideways) คุณสมบัติเด่น: การวิเคราะห์แท่งเทียนอัจฉริยะ: ระบบอ้างอิงการเคลื่อนที่ของราคาตามเทรนด์และสลับกับการกรองสัญญานในช่วงไซด์เวย์ เพื่อความแม่นยำสูงสุด การแสดงผลที่ชัดเจน: มาพ
FREE

Overview The TTM Squeeze indicator helps identify low volatility periods (squeeze) that often precede price breakouts. It uses Bollinger Bands (BB) and Keltner Channels (KC) to determine when the market is "coiling" and ready to move. Configuration Guide Volatility Settings The indicator uses Bollinger Bands to measure market volatility. When BBs are inside Keltner Channels, a squeeze is detected. The squeeze suggests the market is consolidating and may soon break out. True Range Option Optional
FREE
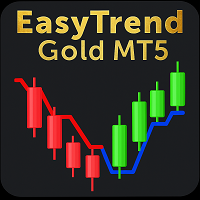
Tired of confusing indicators, especially when trading the volatile Gold market? EasyTrend Gold MT5 is designed to tame Gold's volatility on any timeframe . It harnesses the power of ATR to translate Gold's sharp movements into a single, clear, and dynamic trend line that cuts through the noise. Whether you are scalping on M1 or swing trading on H4, you can visualize the trend's direction and strength, easily identify consolidation periods, and gain an intuitive insight into when it's time t
FREE

if you want to test it : private message me ( MT5 demo testing doesn't work ) Designed to help traders gain a deeper understanding of the market’s true order flow dynamics . By visualizing the “ footprints ” left by candles, this indicator reveals how the delta ( the difference between buying and selling pressure ) changes during the candle formation, as well as how volume fluctuates at different price levels. These insights are essential for traders seeking to identify reversals, breakouts, and

Divergence Force Divergence Indicator Description Divergence Force 1.0 is an indicator designed to identify divergences between the price of an asset and the MACD (Moving Average Convergence Divergence). This indicator automatically draws trend lines on the highs and lows of the price and MACD, highlighting potential trading opportunities. Main Features Automatic Divergence Identification : The indicator automatically detects bullish and bearish divergences between the price and the MACD. Trend
FREE

As it name implies, this is an exaustion oscillator. However, you may wonder: what differs you from others oscillators like RSI, Stochastic, CCI etc? The difference is that ours is more powerful and accurate ! Your oscillator filters the nois e made by other oscillators, and shows you only the exact moment to enter the trade. Of course, using it alone, like any other indicator, has its risks. Ideally, reconcile it with technical analysis and/or others indicators. If you have any doubt or suggest

Session Finder – Track Forex Market Sessions with Precision
Stay ahead of the market with Session Finder , a sleek HUB style design for MetaTrader 5. It provides real-time visibility into the world’s major trading sessions—Sydney, Tokyo, London, and New York—so you always know which markets are open, closed, or about to change. Key Features: Live Session Status: See whether a session is currently open or closed at a glance. Countdown Timers: Track exactly how long until a session opens or close

For those who appreciate Richard Wyckoff approach for reading the markets, we at Minions Labs designed a tool derived - yes, derived, we put our own vision and sauce into this indicator - which we called Waves PRO . This indicator provides a ZigZag controlled by the market volatility (ATR) to build its legs, AND on each ZigZag leg, we present the vital data statistics about it. Simple and objective. This indicator is also derived from the great book called " The Secret Science of Price and Volum

This indicator uses the Zigzag indicator to identify swing highs and swing lows in the price chart. Once it has identified the swing highs and swing lows, it can use them to determine potential support and resistance levels. A support level is formed when the price drops and bounces back up from a swing low, indicating that there is buying pressure at that level. A resistance level is formed when the price rises and reverses downward from a swing high, suggesting selling pressure at that level.
FREE
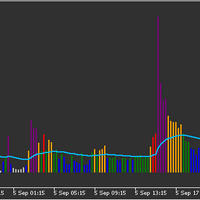
Volume indicator judging level of volume per bar accordingly to Volume Spread Analysis rules. It allows either to set static volume levels or dynamic ones based on ratio comparable to Moving Average. Bars are coloured based on ratio or static levels, visually presenting level of Volume (low, average, high, ultra high). Release Notes - Fixed and optimised calculations of Session Average Volume
- added predefined settings for time to calculate Session Average for EU and US markets
FREE
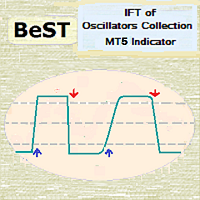
BeST_IFT of Oscillators Collection is a Composite MT4/5 Indicator that is based on the IFT ( Inverse Fisher Transformation ) applied to RSI , CCI , Stochastic and DeMarker Oscillators in order to find the best Entry and Exit points while using these Oscillators in our trading. The IFT was first used by John Ehlers to help clearly define the trigger points while using for this any common Oscillator ( TASC – May 2004 ). All Buy and Sell Signals are derived by the Indicator’s crossings of the Bu
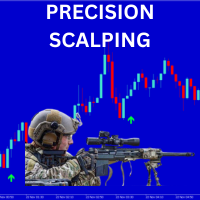
The Precision Scalping Indicator is a powerful and versatile trading tool designed to enhance your scalping strategies across various financial markets. Whether you trade forex pairs, commodities like Gold (XAU/USD), cryptocurrencies such as Bitcoin (BTC), or synthetic indices from Deriv, this indicator adapts seamlessly to your trading style. Key Features: Non-Repainting Signals : Ensures signal reliability by displaying fixed signals that don't disappear or repaint. Audible Alerts : Real-time

Indicator Description (based on AVPT EA ):
This indicator visualizes a Volume Profile-based liquidity architecture on the chart by analyzing where trading volume is concentrated across price levels over a specified lookback period. It calculates key volume structures such as:
Point of Control (POC): the price level with the highest traded volume.
Value Area (VA): the range containing a configurable percentage of total volume (typically ~70%).
High-Volume Nodes (HVNs): price levels with sign
FREE
StochW%R Momentum Oscillator – Your Smart Hybrid Momentum Indicator Precision. Noise Filtering. More Reliable. Tired of traditional oscillators generating false signals in volatile markets? The StochW%R Momentum Oscillator is the evolution in momentum analysis, combining the best of the Stochastic and Williams %R into one powerful, customizable indicator. Key Benefit: It reduces market noise and provides cleaner signals thanks to its intelligent fusion algorithm, with early alerts for trend chan
FREE

Haven RSI Candlestick is an innovative technical indicator that transforms the traditional line chart of the Relative Strength Index (RSI) into an intuitive candlestick chart format.
This tool is designed for traders who rely on technical analysis and aim to interpret market momentum and potential reversal points faster and more deeply. Other products -> HERE . Key Features: RSI Visualization as Candlesticks: The core feature. You can now directly apply Price Action methods and candlestick patte
FREE

Tabajara Rules for MT5 , based on Professor André Machado’s Tabajara Setup, indicates the market direction using moving averages when there are candles aligned with the direction of the moving average.
The indicator contains the color rule applied to the candles and the moving average.
It allows changing the parameters: period and smoothing method of the moving average.
It also allows changing the colors of the candles (borders and filling) and of the moving average.
Professor André Machado’s
FREE

Ultimate Pivot Levels indicator for MetaTrader 5 Ultimate_Pivot_Levels is versatile tool designed to enhance your trading experience by accurately plotting pivot levels on your charts. It allows entering your desired values manually or using well known pivot calculation methods to create pivot levels. It draws the levels in the background and allows you to customize levels, size and colors of areas, and it keeps your adjustments while extending the levels to every new bar. Whether you are a novi
FREE

Local Time Scale Overlay is a technical indicator for MetaTrader 5 that enhances chart readability by overlaying a local time scale on the trading chart. It calculates the difference between your local system time and the server time and uses this difference to display time labels that reflect your local time at predefined intervals. The time interval is customizable via a drop‐down menu with options such as 5, 10, 15, 20, 30, 60, 120, and 480 minutes (with 15 minutes as the default).
Key Featu
FREE

Liquidity Swings SMC Zones Liquidity Swings SMC Zones is a professional indicator for MetaTrader 5 that automatically detects, displays, and updates liquidity-based swing high and swing low zones directly on your chart. This tool is designed for traders who use Smart Money Concepts (SMC), supply and demand, or support and resistance trading methods. Features Automatic Zone Detection:
Identifies significant swing highs and swing lows based on customizable pivot settings. Clear Visual Zones:
Hi
FREE

Metatrader 5 version of the famous Andre Machado's Tabajara indicator. If you don't know Andre Machado's Technical Analysis work you don't need this indicator... For those who need it and for those several friend traders who asked this porting from other platforms, here it is...
FEATURES
8-period Moving Average 20-period Moving Average 50-period Moving Average 200-period Moving Average Colored candles according to the inflexion of the 20-period MA
SETTINGS You can change the Period of all MA's
FREE

Highly configurable Stochastic indicator.
Features: Highly customizable alert functions (at levels, crosses, direction changes via email, push, sound, popup) Multi timeframe ability Color customization (at levels, crosses, direction changes) Linear interpolation and histogram mode options Works on strategy tester in multi timeframe mode (at weekend without ticks also) Adjustable Levels Parameters:
Stochastic Timeframe: You can set the lower/higher timeframes for Stochastic. Stochastic Bar S
FREE

Smart Session Box Displays Asia, London, and New York trading sessions with automatic timezone adjustment and session overlap highlighting. Main Features Complete session analysis with no limitations. Key Features The indicator draws session boxes with high and low lines for each trading session. Session overlaps are highlighted with distinct colors to identify high liquidity periods. Breakout alerts notify when price crosses previous session levels. A control panel provides quick toggles for al
FREE
Level Box Tool is a powerful and user-friendly custom indicator designed for traders who utilize technical analysis tools like rectangles and trend lines to identify key support, resistance, and price zones. This tool simplifies and speeds up the process of marking chart levels, offering both visual clarity and precision with its fully customizable panel, and now includes price-cross alerts — so you’ll never miss a key level again. MT4 Version - https://www.mql5.com/en/market/product/136009/ Jo
FREE

The KPL Swing indicator is a simple trend following mechanical trading system which automates the entry and exit. The system works with a hard stoploss and a trailing stoploss for exit with profitable trades. No targets are given as no one knows how high (or low) a Price can move. A trailing stoploss locks in the gains and removes emotions from trading. Convert from indicator Amibroker with modified Perfect if combining with KPL Chart Uptrend & Downtrend
FREE
The VSA (Volume Spread Analysis) Volume Indicator is a powerful technical tool used by traders to analyze the relationship between price movement and trading volume. Rooted in the Wyckoff methodology, VSA helps identify imbalances between supply and demand, revealing the hidden actions of institutional players—often referred to as “smart money.” This indicator evaluates three key elements: volume, price spread (the difference between high and low), and closing price. By interpreting these facto
FREE

It is one of the famous indicator in TradingView platform. Supertrend indicator shows the trend of the market intuitively . You can use it for understanding the trend or get insight about the market.
------- Value & Color -------- You can change the colour (line, filled). Default value is the same as Tradingview Supertrend default value ( period 10, ATR multiplier 3.0)

INDICATOR: GEN Zenith Developer: gedeegi General Description GEN Zenith is a technical indicator designed to automatically identify price reversal patterns (Zenith) based on pivot price detection and delta volume movement. This indicator looks for points where the price forms a swing high or swing low, then detects a breakout from that area to confirm a strong reversal signal. This indicator is highly suitable for reversal and breakout strategies, or as a signal confirmation tool in your tradin
FREE
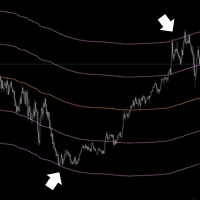
Elevate Your Trading with Advanced Anchored Volume Weighted Average Price Technology Unlock the true power of price action with our premium Anchored VWAP Indicator for MetaTrader 5 - the essential tool for precision entries, strategic exits, and high-probability trend continuation setups. Write me a DM for a 7 day free trial. Anchored VWAP Plus gives traders unprecedented control by allowing custom anchor points for Volume Weighted Average Price calculations on any chart. With support for 4 sim
FREE

TG MTF MA MT5 is designed to display a multi-timeframe moving average (MA) on any chart timeframe while allowing users to specify and view the MA values from a particular timeframe across all timeframes. This functionality enables users to focus on the moving average of a specific timeframe without switching charts. By isolating the moving average values of a specific timeframe across all timeframes, users can gain insights into the trend dynamics and potential trading opportunities without sw
FREE

SUPERTREND; It is a trend following indicator based on the SuperTrend ATR created by Olivier Seban. It can be used to detect changes in trend direction and locate stops. When the price falls below the indicator curve, it turns red and indicates a downtrend. Conversely, when the price moves above the curve, the indicator turns green, indicating an uptrend. Like other indicators, it works well on SuperTrend when used in conjunction with other indicators such as MACD, parabolik SAR, Bollinger Band
FREE

The Inside Bar pattern is a very well known candlestick formation used widely by traders all over the world and in any marketplace. This approach is very simple and adds a little confirmation candle, so it adds a third past candlestick to the count to confirm the direction of the move (upward or downward). Obviously, there is no power on this candlestick formation if the trader has no context on what it is happening on the market he/she is operating, so this is not magic, this "radar" is only a
FREE
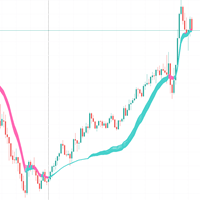
Understanding the RSI Adaptive EMA Indicator This code implements a custom trading indicator called "RSI Adaptive EMA" for MetaTrader platforms. It's a fascinating approach that combines RSI (Relative Strength Index) with an Exponential Moving Average (EMA) in a way that makes the EMA adapt based on market conditions.
Core Concept Traditional EMAs use a fixed smoothing factor (alpha), but this indicator creates a dynamic smoothing factor that changes based on RSI values. This allows the EMA lin
FREE
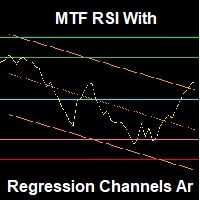
Note: The inputs of this indicator are in the Arabic language An advanced RSI indicator that displays dynamic linear regression channels in both the indicator window and the price chart, with predefined horizontal levels to detect overbought and oversold zones. Main Features (Summary): Synchronized linear regression channels on both price and RSI Multitimeframe support Smart and ready-to-use horizontal levels Professional design with optimized performance Feedback & Support We value your ex
FREE

It is the MQL5 version of zero lag MACD that was available for MT4 here: https://www.mql5.com/en/code/9993 Also there was a colored version of it here but it had some problems: https://www.mql5.com/en/code/8703 I fixed the MT4 version which has 95 lines of code. It took me 5 days to write the MT5 version.(reading the logs and testing multiple times and finding out the difference of MT5 and MT4!) My first MQL5 version of this indicator had 400 lines of code but I optimized my own code again and n
FREE

This is RSI with alarm and push notification -is a indicator based on the popular Relative Strength Index (RSI) indicator with Moving Average and you can use it in Forex, Crypto, Traditional, Indices, Commodities. You can change colors to see how it fits you. Back test it, and find what works best for you. This product is an oscillator with dynamic overbought and oversold levels, while in the standard RSI, these levels are static and do not change.
This allows RSI with alarm and push notifica
FREE

SMC Order Block Zones (MT5) is a Smart Money Concept (SMC) analytical indicator specially designed and optimized for Gold (XAUUSD) .
It automatically detects Order Blocks and displays them as Supply & Demand zones , helping traders identify potential institutional price levels on Gold. The indicator uses volatility-adaptive logic , making it highly suitable for the fast and aggressive movements of XAUUSD. Key Features (XAUUSD Optimized) Specially designed for Gold (XAUUSD) Automatic Order Block
FREE
The MetaTrader Market is a simple and convenient site where developers can sell their trading applications.
We will help you post your product and explain you how to prepare your product description for the Market. All applications on the Market are encryption-protected and can only be run on a buyer's computer. Illegal copying is impossible.
You are missing trading opportunities:
- Free trading apps
- Over 8,000 signals for copying
- Economic news for exploring financial markets
Registration
Log in
If you do not have an account, please register
Allow the use of cookies to log in to the MQL5.com website.
Please enable the necessary setting in your browser, otherwise you will not be able to log in.