Watch the Market tutorial videos on YouTube
How to buy а trading robot or an indicator
Run your EA on
virtual hosting
virtual hosting
Test аn indicator/trading robot before buying
Want to earn in the Market?
How to present a product for a sell-through
Technical Indicators for MetaTrader 5 - 110
Linear Trend Predictor - A trend indicator that combines entry points and direction support lines. It works on the principle of breaking through the High/Low price channel.
The indicator algorithm filters market noise, takes into account volatility and market dynamics.
Indicator capabilities
Using smoothing methods, it shows the market trend and entry points for opening BUY or SELL orders. Suitable for determining short-term and long-term market movements by analyzing charts on any timeframes.

Arrow Trend indicators Trading with the trend is often one of the most basic pieces of advice given by experienced traders. In addition, experienced traders will often advise traders to prioritize the long-term trend, as prices usually follow the direction of the long-term trend. Arrow trend indicators are tools that traders can use to determine the direction of a trend toward a long-term trend. What is an arrow trend indicator? An arrow trend indicator is a trend-following technical indicator

Have you ever asked yourself why your supply and demand zones fail , even when everything looks “perfect”? The truth is, you're not wrong — you're just watching the reaction, not the reason. It's not like those random currency strength meters that rely on lagging indicators like RSI, CCI, or similar tools mashed together to guess strength or weakness. That approach reacts to the past — not the cause. Pairs like EURUSD or USDJPY are just the outcomes . The real drivers? Currency indices an
Market Flow Analysis is a structure-based indicator that goes beyond traditional tools to help you spot real entry opportunities with ease. It highlights the Gold Zone — a gold-filled rectangle showing you the best possible area for entries , based on market structure, not lagging signals. Whether you're scalping or swing trading, this indicator gives you the true market trend , valid order blocks , and clear reaction zones , all in one smart visual layout. Why Market Flow Analysis? Go

Candle Volume Strength is an advanced volume analysis indicator that provides insights into the ongoing battle between buyers and sellers. It calculates and visualizes real time volume shifts, helping traders confirm breakouts, trends, retracements, and reversals with greater accuracy.
Key Features: Volume Based Confirmation – The indicator monitors tick volume changes and alerts when market power shifts between buyers and sellers. Trend and Breakout Validation – By analyzing volume distri

Dynamic Levels Marker is a smart MT5 indicator that automatically detects and plots three support and three resistance levels using a tiered historical analysis. Levels are visually distinct, labeled, and adapt as price evolves.
Key Features:
Dynamic multi-level support/resistance zones
Tiered logic based on recent price action
Customizable alerts (popup, sound, push notifications)
Clean visual lines with auto-positioned labels
Lightweight and easy to use on any timeframe
Whether you’re
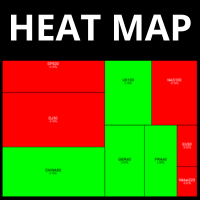
Dynamic Heatmap for MetaTrader 5 — Instantly Spot Market Opportunities Revolutionize the way you see the markets with the most complete and intelligent Heatmap for MetaTrader 5. Designed for traders who demand speed and clarity in decision-making, our Heatmap creates a powerful visual representation of market performance in real time. Key Benefits Instant Read of Market Strength Instantly see which assets are leading or lagging. Dynamic color coding for quick identification: green for ri
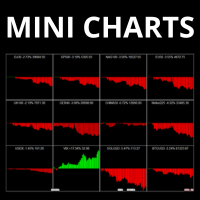
Your market overview, now crystal clear. With our Mini Charts Indicator for MetaTrader 5 , you’ll have the power of multiple charts inside a single, ultra-clean workspace. No more switching between assets or opening dozens of charts. Our Mini Charts give you instant visual snapshots of multiple markets — all in real time. Each mini chart displays the price action of the selected asset, showing whether it’s trending up or down, giving you immediate market sentiment at a glance. Whether you’re mon

Simple Candle Timer
Overview: The Simple Candle Timer is a simple, yet powerful, tool for traders who want to stay informed about the time remaining until the next candle appears on their chart. Whether you are trading on minute charts or higher timeframes, this indicator ensures you never miss a new candle formation.
Features: Real-Time Countdown Timer: Displays the time left until the current candle closes and a new one starts. The timer updates smoothly every 100 milliseconds for precision

Volume Flow Analyzer The Indicator helps you decode market activity by visualizing real-time volume strength. Whether you're a fast-paced scalper or a patient swing trader , this tool gives you a clearer view of when volume truly supports the price action.
Instructions: Indicator alerts when there is expected increase in volatility by analyzing volumes to allow a trader to prepare. It indicates "High Expected Volatility in such cases", It should be used along with your buy and sell parameters
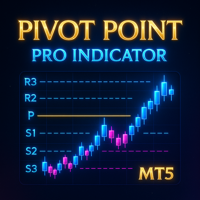
Detailed Description: The Pivot Point Pro Indicator is a powerful all-in-one fully customizable indicator that takes care of five pivot point methods (Classic, Fibonacci, Woodie, Camarilla, DeMark). It automatically plots pivot levels and midpoints, highlights key reversal zones and sends alerts when price approaches these levels. Unlike the free Pivot Point Classic version, this Pro indicator allows users to customize more settings, analyze current and historical pivot points and use al

# Weekly & Daily Stochastic Signal Indicator User Guide
## Overview This indicator combines the Stochastic oscillator on weekly and daily timeframes to generate strong trading signals. It aims to create more reliable signals by tracking momentum changes across different timeframes.
## Parameters - **ShortPeriod (14)**: Daily Stochastic period - **ShortPeriodSMA (3)**: Daily Stochastic SMA period - **LongPeriod (70)**: Weekly Stochastic period - **LongPeriodSMA (3)**: Weekly Stochastic SMA per

This scanner is based on the Bill Williams Awesome Oscillator (AO) indicator and is designed for faster analysis of financial instruments. The chart shows five vertical columns, which includes a financial instrument that meets certain criteria. The first column shows financial instruments with a strong trend, namely when the AO indicator is above the zero line on three time frames. If there is a strong downward trend in the market, then such instruments will fall into the fifth column. The seco
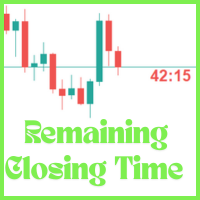
The Candle Remaining Closing Time indicator displays the amount of time left before the current candlestick closes on your chart. This tool is essential for traders who rely on precise timing to enter or exit trades, especially in fast-moving markets. By showing a real-time countdown, it helps you stay aware of upcoming candle completions across any timeframe—from 1-minute to daily charts. Whether you're a scalper watching minute-by-minute action or a swing trader timing key setups on higher tim
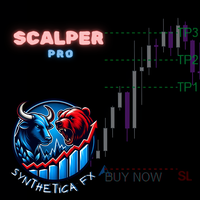
The SyntheticaFX Scalper Pro Indicator is a versatile and user-friendly tool designed to assist traders in identifying high-accuracy entry points across multiple timeframes and all currency pairs. This indicator provides clear visual signals on the chart, along with recommended Stop Loss (SL) and Take Profit (TP) levels, making it easier for traders to plan their trades with confidence. With its built-in dashboard, the SyntheticaFX Scalper Pro Indicator offers real-time trade statistics, helpin

The Swing High Low and Fibonacci Retracement Indicator is a powerful technical analysis tool designed to identify key price levels and potential reversal zones in the market. It automatically detects recent swing highs and swing lows on the chart and overlays Fibonacci retracement levels based on these points. This indicator helps traders: Visualize market structure by highlighting recent swing points. Identify support and resistance zones using Fibonacci ratios (e.g., 38.2%, 50%, 61.8%). Adapt

The Quasimodo Pattern Indicator is no more difficult than the Head and Shoulders. Still, only a few traders know about it, and some even confuse one with the other. However, this is not a reason to avoid this tool in your forex trading strategy. Features: Automatic Detection: The indicator automatically scans for valid QM patterns across any timeframe, reducing the need for manual chart analysis. Visual Highlights: Clear and customizable on-chart drawing of shoulders, heads, and breakout zones

MACD Scalper Zero Lag is a fast, accurate, and reliable indicator designed to give traders the real-time edge they need. By eliminating the lag found in traditional MACD indicators, it delivers instantaneous divergence alerts on both forex and cryptocurrency markets. With its robust algorithm and user-friendly interface, this tool not only detects early trend reversals but also provides clear and actionable signals. The indicator offers customizable settings so that you can adjust sensitivity a

Zero Lag EMA Indicator (AI-Optimized) – Professional Trading Tool Enhance your trading accuracy with the Zero Lag EMA Indicator — a next-generation solution designed to eliminate the delay of traditional moving averages. Powered by AI-optimized algorithms, this tool delivers lightning-fast market insights, helping you stay ahead of price action. Key Features: AI-Enhanced Speed : Virtually no lag. Detects trend shifts and momentum changes with exceptional speed. Market Versatility : Ideal for For
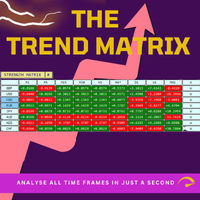
Trend Teller is a powerful, intuitive dashboard tool designed to give you a bird’s-eye view of the market trend across all major currency pairs and timeframes — from M1 to MN1. Built by traders for traders, this tool eliminates the guesswork from market trend analysis and helps you stay aligned with the bigger picture. Most beginner traders have a challenge to identify the direction of the market something which pro trader fails at times. Therefore this tool works best for beginners and any tr

مؤشر Smart Trend Candles هو أداة فعّالة في منصة MetaTrader 4، تجمع بين عناصر تحليل فني متعددة لتحديد اتجاهات السوق وقياس قوة المشترين والبائعين. يوفر هذا المؤشر متعدد الاستخدامات إشارات مرئية واضحة تُحسّن قرارات التداول الخاصة بك. الميزات الرئيسية 1. تحديد الاتجاه يستخدم شموع Heikin-Ashi المعدلة (اختياري) لتصفية ضوضاء السوق يتضمن متوسطًا متحركًا (فترة قابلة للتكوين) لتأكيد الاتجاه تنفيذ مؤشر القوة النسبية لقياس الزخم 2. قياس القوة تشير الشموع المرمزة بالألوان إلى شدة ضغط الشراء/البيع تحليل الحج

This indicator is converted from Pinescript to MQL5 and consisting of buffers for the range lines as well, its not only object.
The Range Detector indicator aims to detect and highlight intervals where prices are ranging. The extremities of the ranges are highlighted in real-time, with breakouts being indicated by the color changes of the extremities.
USAGE Ranging prices are defined by a period of stationarity, that is where prices move within a specific range.
Detecting ranging marke
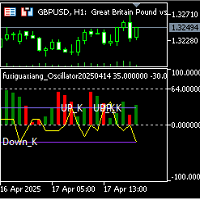
Fuxi Hexagram Oscillation Signal Alert Indicator — An Innovative Trading Tool Combining I Ching Philosophy with Modern Quantitative Analysis 1. Product Overview The Fuxi Hexagram Oscillation Signal Alert Indicator is a cutting-edge technical analysis tool that integrates ancient Chinese I Ching (Book of Changes) philosophy with modern financial market data analysis. By converting K-line (candlestick) chart behavior into dynamic hexagram structures, the indicator provides traders with real-time t

Easily Spot Real Market Strength — Even If You're New. The Momentum Shadow Indicator (MSI) is perfect for beginners and pros.
It shows you when the market really has strength — so you know when to buy and when to sell with confidence. No confusion. No guessing.
Just simple lines that tell you what’s real and what’s not. Super easy to use — made for all levels
Clear buy & sell signals
Best on 20-minute charts and higher, but works for quick trades too If you’re new to trading, MSI makes it

The Accumulation and Distribution indicator is a volume-based indicator that was essentially designed to measure underlying supply and demand. This is accomplished by trying to determine whether traders are actually accumulating (buying) or distributing (selling). This is accomplished by plotting a cumulative total of the money flow volume for each period. This indicator can reveal divergences between volume flow and actual price to primarily affirm a current trend or to anticipate a future reve

MonetTrend — Премиум-индикатор для торговли по тренду (M30, H1, H4)
MonetTrend — это мощный и визуально понятный трендовый индикатор, созданный для торговли на таймфреймах M30, H1 и H4. Он идеально подходит для работы с волатильными инструментами, такими как: • Золото (XAUUSD) • Криптовалюты (BTCUSD) • Валютные пары (EURUSD, USDJPY и др.)
Ключевые особенности MonetTrend: • Автоматическое отображение Take Profit 1 (TP1) и Stop Loss (SL): После появления сигнала индикатор сразу показывает: • TP

When there is no position, when changing the color, you can consider opening an order. With the fluctuation of the market, when the current color changes again, you need to close the position and leave. Suitable for different cycles, the trading rules are simple and require friends to explore on their own.
I hope friends who use this indicator can make a lot of money, rolling bigger and bigger like a snowball. thank you!

The TrendKiller Oscillator is a custom MetaTrader 5 (MT5) indicator designed to help traders analyze price deviations from a moving average, displayed in a separate window. It calculates the difference between a chosen price (e.g., close) and a moving average (default: 14-period SMA), producing a detrended value that oscillates around a zero line. Dynamic maximum and minimum levels, computed over a user-defined period (default: 50 bars), provide context for identifying overbought/oversold condi
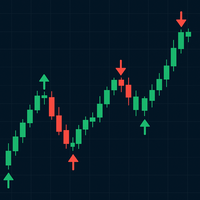
Trend Mark is a versatile trading indicator designed to highlight high-probability entry points using visually intuitive arrows directly on the chart. It analyzes price action and market momentum to identify potential trend reversals or continuations, displaying upward or downward arrows when specific trade conditions are met. Suitable for both beginners and experienced traders, Trend Mark can be used across multiple timeframes and instruments, making it a powerful tool for scalping, day trading

AstroBias Indicator: Precision in the Angle of Your Trend The AstroBias Indicator is more than just a trend direction tool. It also tracks the change in the angle of the price slope , allowing traders to filter signals using angular filters . This makes it especially useful for building automated trading bots based on its signal logic. Key Benefits of AstroBias Indicator Highly Sensitive to Price Action AstroBias responds quickly to real-time price movements, providing clear and timely sign

Sonic Edge Meter: Precision for Reversals and Price Surges Sonic Edge Meter is a powerful indicator built on original algorithms for extremum detection . It’s specifically designed to identify market reversals and sharp directional moves , giving you a clear signal before they happen. How Does Sonic Edge Meter Work? The indicator notifies you of potential turning points or price spikes by displaying visual markers directly on the chart:
Blue dot — signal to buy
Red dot — signal to sell

KT Fair Value Gap (FVG) identifies and highlights zones of temporary price imbalance in the market. These gaps often act as potential areas for price continuation—or in some cases, reversals (also known as inverse FVGs). Bullish FVG: Displayed as green boxes, these gaps act as support zones where price may resume its upward movement. Once filled, they can also become potential turning points for a reversal. Bearish FVG: Shown as red boxes, these gaps serve as resistance zones where price may con

SpectralEdge Periodogram - Cycle Analysis Indicator
Overview
The SpectralEdge Periodogram is a powerful technical analysis indicator for MetaTrader 5, designed to uncover hidden price cycles in financial markets using Fast Fourier Transform (FFT). By transforming price data into the frequency domain, this indicator reveals the dominant cycles driving market movements, enabling traders to identify repeating patterns and make informed trading decisions. Whether you're a day trader, swing trader

Este indicador calcula e exibe no gráfico o preço justo do mini índice (WIN) com base em dados fundamentais do mercado. Além disso, ele traça automaticamente linhas de suporte e resistência percentuais , ajudando você a visualizar zonas importantes de preço. É como ter uma régua financeira no gráfico, mostrando onde o preço "deveria estar", de forma objetiva, considerando o cenário macroeconômico!
O indicador usa uma fórmula de precificação de contratos futuros baseada em: O preço à vista do Ib
️ **Drawdown Tracker Pro** – Smart Risk Control for Prop Traders Many traers fail their prop firm challenge not because they’re bad but because they don’t track their equity drawdown clearly enough, in real-time. This tool fixes that. **Drawdown Tracker Pro** is an advanced MT5 indicator built for traders who need to stay within daily drawdown limits - especially during challenges with FTMO, MFF, or other funding programs. It helps you trade with discipline and avoid costly violations.

Candle Confirm Color
What Is It?
The Candle Pattern Confirmations is an advanced indicator for MetaTrader 5 (MT5) designed to identify and confirm candlestick patterns with high probability of trend reversal or continuation. It visually highlights candles that form Engulfing (Bullish/Bearish) and Inside Bars patterns, assisting traders in making more assertive decisions with real-time confirmation.
Main Features
Automatic Pattern Detection
- Detects Bullish Engulfing and Bearish Engulfin

Discover the Power of Volume with Volume Thermal Vision Ready to take your trading to the next level? Introducing Volume Thermal Vision, the ultimate MetaTrader 5 indicator that transforms volume analysis into a strategic advantage. Designed for traders seeking to identify high-probability opportunities, this indicator is perfect for methodologies like VSA (Volume Spread Analysis), ICT (Inner Circle Trader), SMC (Smart Money Concepts), and Wyckoff, helping to decipher market behavior in pairs li

ICT Order Flow Matrix Automated Institutional Order Block Detection for MetaTrader 5
Overview Elevate your charting with true institutional order flow insights. ICT Order Flow Matrix scans price action in real time to identify where banks, hedge funds and proprietary trading desks place their largest orders. It then plots these “Order Blocks” as dynamic support and resistance zones—no manual drawing required.
Key Features - **Automated Zone Detection** Instantly locates supply and de

Percentage Range Consolidation O Percentage Range Consolidation é um indicador poderoso projetado para identificar zonas de consolidação de preço com base em variações percentuais ao longo do tempo. Ideal para traders que buscam detectar áreas de compressão de volatilidade e possíveis pontos de ruptura (breakout). Principais características: Identifica até 3 zonas de consolidação simultâneas, cada uma configurável de forma independente. Cálculo baseado na variação percentual entre a máxima e mín

Range Filter Buy and Sell O Range Filter Buy and Sell é um indicador técnico avançado que combina filtragem de movimentos de preço com geração de sinais claros de compra e venda.
Ele utiliza um sistema inteligente de suavização baseado em médias móveis exponenciais do range de preços, adaptado por um multiplicador configurável. Principais recursos:
Filtragem de tendências (Alta, Baixa ou Neutra) com cores distintas no gráfico:
• Tendência de alta (linha verde)
• Tendência de baixa (linha verm

TrendWave Bands Indicator This is a trend-tracking tool, originally by BigBeluga on TradingView, designed to adjust automatically to current market movements using upper and lower dynamic bands. It uses primary waves to view the strength and persistence of a trend, and includes secondary wave bands to assist with deeper analysis. Main Features: Smart Adaptive Bands In uptrends, a dynamic lower band is displayed, while in downtrends, an upper band appears. These serve as moving zones of support o
Let us introduce the Heikin Ashi RSI Oscillator! This indicator combines the concepts of Heikin Ashi candles with the RSI (Relative Strength Index) to produce an oscillator-like format that can be used to filter out some of the noise associated with standard RSI readings. This provides traders with a smoother representation of market conditions. Here are some articles to read more about the RSI and Heikin Ashi candles: https://www.investopedia.com/terms/r/rsi.asp https://www.investopedia.com/ter

The London Session Breakout Strategy Indicator is designed for traders who follow ICT (Inner Circle Trader) and Smart Money Concepts (SMC) , focusing on session based liquidity hunts, killzones, and market maker behavior during the London session. This tool captures the highest and lowest price levels between 00:00 and 07:00 GMT , which is commonly identified as the London Killzone or market maker range . It helps traders identify potential breakout zones where institutional activity and volati

The Ultimate RSI indicator is a new oscillator based on the calculation of the Relative Strength Index that aims to put more emphasis on the trend, thus having a less noisy output. Opposite to the regular RSI, this oscillator is designed for a trend trading approach instead of a contrarian one. While returning the same information as a regular RSI, the Ultimate RSI puts more emphasis on trends, and as such can reach overbought/oversold levels faster as well as staying longer within these areas.

Trend Rider combines indicators such as Super Trend, RSI, and MACD. Its purpose is to assist in spotting and riding trends by displaying direction through color-coded candles and trailing stop levels. It can be employed independently or alongside other filters for enhanced decision-making.
The integration of these indicators aims to provide a clearer picture of market trends and facilitate better trading strategies. Super Trend helps identify the prevailing trend, RSI measures the market condi
HedgingMonitor: Visual Control for Hedging Operations HedgingMonitor: Professional Order Visualization for MT5 HedgingMonitor is a professional indicator for MetaTrader 5 that displays detailed information about all your open and pending orders in an organized and customizable visual panel. Ideal for traders who use hedging strategies or manage multiple orders simultaneously. Key Features: Intuitive Visual Interface: View all your orders in a single panel, with color coding to quickly identify b

Descubra o Pulse Flow, um indicador exclusivo desenvolvido para traders que buscam clareza visual e agilidade na leitura do mercado. Com uma abordagem inteligente e dinâmica, ele destaca zonas de transição de força e equilíbrio entre compradores e vendedores, revelando oportunidades com precisão.
Ideal para quem opera fluxo, price action ou deseja uma leitura limpa, objetiva e poderosa, o Pulse Flow se adapta a qualquer ativo ou tempo gráfico. Simples de usar, difícil de ignorar

Descubra o Wave Flow, um indicador exclusivo desenvolvido para traders que buscam clareza visual e agilidade na leitura do mercado. Com uma abordagem inteligente e dinâmica, ele destaca zonas de transição de força entre compradores e vendedores, revelando oportunidades com precisão.
Ideal para quem opera fluxo, price action ou deseja uma leitura limpa, objetiva e poderosa, o Wave Flow se adapta a qualquer ativo ou tempo gráfico. Simples de usar, difícil de ignorar
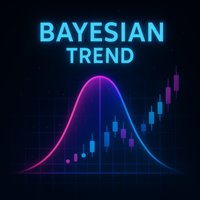
The Bayesian Trend Indicator colors each candle according to a Bayesian‐inference of trend direction. It computes “prior” trend strength from four standard moving averages (EMA, SMA, DEMA, VWMA) of your chosen length, then computes a “likelihood” from faster versions of those same MAs (shortened by a “gap”). It combines them to produce a posterior probability of an uptrend. Candles are colored: Green when posterior indicates a strong uptrend. Red when posterior indicates a strong downtrend. Blue
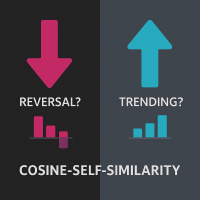
Cosine-Self-Similarity: Identify Trends & Reversals
What is Cosine Similarity? Cosine similarity measures how alike two sequences are by looking at the angle between them. A value of +1 means they move perfectly together, -1 means they move perfectly opposite, and 0 means there's no directional relationship. This indicator applies this concept to price returns.
Is the market trending strongly, or is it choppy and reversing? Gain insight with the Cosine-Self-Similarity indicator!
This powerfu

The ICT London Open Killzone Indicator is a Smart Money based trading tool designed for forex traders who follow institutional concepts such as ICT, SMC (Smart Money Concepts), and liquidity based market structure strategies . This indicator highlights the London Open Killzone, specifically from 06:00 to 08:00 GMT , a session known for its volatility and price displacement due to overlapping liquidity flows between the Asian session and the London market open.
This time window often acts as a
Engulfing with EMAs Indicator
Unlock the power of advanced candlestick pattern detection with the Engulfing with EMAs Indicator , a cutting-edge tool designed for MetaTrader 5. This futuristic indicator combines the precision of engulfing pattern analysis with the trend-following strength of Exponential Moving Averages (EMA 21 and EMA 50), empowering traders to identify high-probability setups across all currency pairs and timeframes. Key Features: Comprehensive Engulfing Detection : Detects b

Discover the power of advanced volume analysis with Weis Wave Scouter, a revolutionary indicator for MetaTrader 5 that combines the proven principles of the Wyckoff method and Volume Spread Analysis (VSA). Designed for traders seeking precision and depth in their operations, this indicator offers a tactical reading of the market through cumulative volume wave analysis, helping to identify key points of trend reversals and continuations.
Weis Wave Scouter features a clear visual interface with co
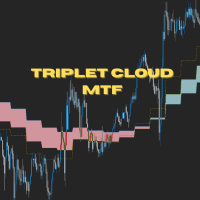
Triplet Cloud MTF is an indicator for trend-following strategy. It presents the trend in HTF from the LTF Chart that allows traders focus on looking for trade entry in the right direction and increase striking rate. It comes with simple input setup. You will only need to choose HTF you want to follow its trend and set the alert setup, then all is set. Here are the mostly selected HTF setup for each of entry timeframe: M1 Entry : M15 Trend M5 Entry : H1 Trend M15 Entry : H4 Trend H1 Entry
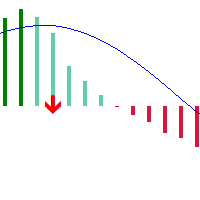
Based on the classic MACD indicator, this version introduces color concepts and adds golden/death cross arrow markers to represent MACD trend changes, helping investors make better decisions.
1. The MACD histogram bars display different colors when positioned above or below the zero line 2. When the MACD histogram is above the zero line and the current MACD value is greater than the previous value, it displays in dark color, indicating a continuing upward trend 3. When the MACD histogram is ab
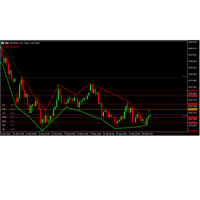
Advantages of the AutoTrendlinesMTF_WithRSI Indicator Multi-Timeframe Trendlines Automatically draws support/resistance trendlines on multiple timeframes (current, H1, H4). Adjustable lookback period ( LookbackBars ) and swing strength ( SwingStrength ) for customization. Daily Pivot Points Calculates and displays daily pivot levels (P, R1/S1, R2/S2, R3/S3) with customizable colors. Toggle visibility for each level individually. Auto Fibonacci Retracement Plots Fibonacci levels based on recent h
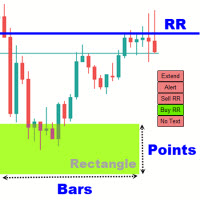
Rectangle Trading Custom is a powerful technical analysis tool designed for price action and range-based traders. It allows users to define consolidation zones and receive alerts when the price breaks out of these zones or approaches trendlines drawn on the chart. Rectangles and Trendlines will be extended into future with one click. Rectangle point size, name and prices will be displayed around rectangle. Key Features: Draw Trading Zones (Rectangle Zones)
Users can manually draw rectangles to

The Pranavtrxx ( Author ) Levels Indicator is a precision-based trading tool designed to identify key price levels in the market, helping traders make informed entry and exit decisions. This indicator automatically plots dynamic support and resistance zones derived from historical price action, psychological price levels, and recent market structure. Whether you're a day trader or swing trader, this tool offers real-time market level tracking that adjusts with price movement, helping you pinpoin
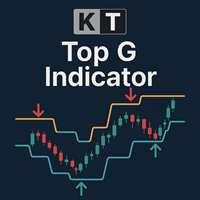
KT Top G is a price action-based indicator that combines smart channel analysis to identify potential market tops and bottoms. When a possible reversal is detected, it plots bold, clear arrows on the chart, giving you a heads-up before the market turns. Big Arrows: Highlight high-probability market tops and bottoms by detecting price exhaustion and momentum shifts. Small Arrows: Indicate lower-probability turning points, which often get broken before the market actually reverses.
Features Broad
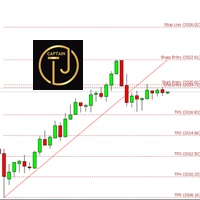
CTJMFiboSignal is The Power of Technical Analysis at Your Fingertips Embark on a seamless trading journey with CTJMFiboSignal , your go-to premium indicator for technical analysis mastery. Integrating advanced Fibonacci Retracement techniques with ZigZag patterns , this cutting-edge tool is designed to boost your confidence, adaptability, and accuracy in the ever-evolving world of market trading. Why CTJMFiboSignal Stands Out Supreme Accuracy:
Gain the upper hand in market analysis
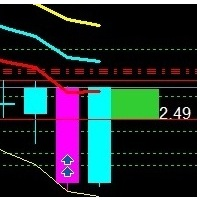
Break Even Zone – Real-Time Floating P/L Visual Indicator Quick Overview:
Break Even Zone is a powerful visual indicator that automatically highlights your floating profit or loss directly on the chart. It displays a red zone when your open trades are in floating loss , and a green zone when they are in floating profit – helping you make smarter, faster decisions. ️ Key Features: Red Zone Block appears when your trades are in floating loss Green Zone Block shows up when trades are in f
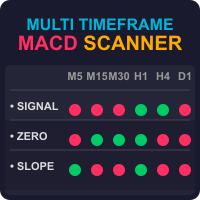
Discover the Power of the Multi Timeframe MACD Scanner for MT5 The MTF MACD Scanner indicator is a practical tool for traders using MetaTrader 5 (MT5). It takes the well-known MACD (Moving Average Convergence Divergence) indicator and turns its data into easy-to-read dashboard and candle colors on your chart. This helps you spot market trends, momentum shifts, and potential reversals without needing to analyze separate MACD lines and switch between timeframes. What Does It Do? This indicator cr
Overview:
TrendPro is a cutting‑edge indicator built on the crossover of three customizable Exponential Moving Averages (EMAs). Designed for all timeframes, it accurately identifies bullish and bearish momentum zones, and plots clear buy/sell arrows. With an integrated side‑market filter and optional pop‑up alerts, TrendPro helps you seize every opportunity without noise or false signals. Key Features: Precise Trend Detection Utilizes three EMAs (default periods: 34, 55, 89) to gauge market dir

KingTrend — Price Action Trend Analysis Tool KingTrend is a trend-following indicator based on long-standing price action principles involving Highs, Lows, Open, and Close. The logic behind this tool comes from concepts passed on to me by my mentor and translated into code for consistent structure recognition. Features: Identifies market structure using price action logic Detects trend direction and key turning points Marks Higher Highs, Lower Lows, and extensions Suitable for discretionary or

ENIGMERA: The core of the market (This is a manual indicator and contains features that may not supported by the MetaTrader current testing environment) Introduction This indicator and trading system is a remarkable approach to the financial markets . ENIGMERA uses the fractal cycles to accurately calculate support and resistance levels. It shows the authentic accumulation phase and gives direction and targets. A system that works whether we are in a trend or a correction.
How It Work

Multi-Level Correlation Analysis of Currencies, Cryptocurrencies, Indices, and Stocks Discover hidden relationships between assets and make data-driven decisions using advanced correlation analysis. "Interaction and Correlation Indicator" is a professional trading tool designed for deep analysis of interdependencies across Forex, cryptocurrencies, indices, and stocks. The indicator calculates the dynamics between fast and slow moving averages (MA) for selected currency pairs, cross rates, and in

Buy/Sell Volume Indicator with Pair Divergence for MT5 version "1.1" Description The Enhanced Buy/Sell Volume Indicator is a custom technical indicator designed for MetaTrader 5 (MT5) to analyze and visualize buy and sell tick volumes in a separate window. It provides traders with insights into market dynamics by highlighting volume dominance, balance, and divergence patterns. The indicator uses tick volume data to estimate buying and selling pressure, offering a detailed view of market sentime

The SuperTrend Advance Trading is a widely-used technical indicator based on SuperTrend Strategy + Price Action + EMA . How it works: - Buy/Sell Signals can be generated when the trend reverses, the conditions of Price action, TrendLine and EMA are met. - After the Signal appears, be patient and wait until the candle closes, at that time place the order as soon as possible. You may have time to review your entry, consider whether it is a good entry or not. - Carefully review the entry, up

Advanced Analysis – Total Visual Clarity
The Ichimoku Dashboard features three powerful dashboards to deliver precise trading signals based on a proven methodology. The color-coded panel design allows users to instantly identify the status of each monitored financial instrument at a glance. The combined table of the "Ichimoku Dashboard" for MetaTrader 5 is a key component that integrates and synthesizes trading signals generated by the indicators, providing a clear and immediate overview to su

DRAGON SCALE User Guide Indicator Visualization The DRAGON SCALE indicator displays several visual elements on the chart: Scale Zone – Displayed as purple areas (accumulation zones) and red areas (distribution zones) surrounding the pivot level. Lifebeat Signal – Appears as an arrow below the candle when the price enters a critical zone. The color of the arrow indicates the direction (green for bullish, red for bearish, yellow for neutral). Entry Countdown – Appears as an arrow above the cand
The MetaTrader Market offers a convenient and secure venue to buy applications for the MetaTrader platform. Download free demo versions of Expert Advisors and indicators right from your terminal for testing in the Strategy Tester.
Test applications in different modes to monitor the performance and make a payment for the product you want using the MQL5.community Payment System.
You are missing trading opportunities:
- Free trading apps
- Over 8,000 signals for copying
- Economic news for exploring financial markets
Registration
Log in
If you do not have an account, please register
Allow the use of cookies to log in to the MQL5.com website.
Please enable the necessary setting in your browser, otherwise you will not be able to log in.