Watch the Market tutorial videos on YouTube
How to buy а trading robot or an indicator
Run your EA on
virtual hosting
virtual hosting
Test аn indicator/trading robot before buying
Want to earn in the Market?
How to present a product for a sell-through
Technical Indicators for MetaTrader 5 - 29

Friend of the Trend: Your Trend Tracker Master the market with Friend of the Trend , the indicator that simplifies trend analysis and helps you identify the best moments to buy, sell, or wait. With an intuitive and visually striking design, Friend of the Trend analyzes price movements and delivers signals through a colorful histogram: Green Bars : Signal an uptrend, indicating buying opportunities. Red Bars : Alert to a downtrend, suggesting potential selling points. Orange Bars : Represent cons
FREE

New Candle Alert is a simple indicator that notify you when a new candle is formed. Func tions : Alert type - option to choose between message with sound or only sound. Message - alert message. Push notifications - enable push notifications. Show timeframe - show the symbol timeframe. Show hour - show the alarm time. Test message - if you don't want to wait a new candle formed to see the message. MT4 version: https://www.mql5.com/pt/market/product/37988 Hope you enjoy it. Any doubt or su
FREE
The UZFX SWS {Scalping Winning Signals} Pro v1.0 is a powerful, non-repainting indicator developed by Usman Zabir (UZFX LABS) specifically for scalpers, day traders, and swing traders seeking precise entry signals in fast-moving markets. Ideal for traders who demand reliable, real-time signals without lag or false repaints.
I RECOMMENDED* BEST TIME FRAMES : 15M AND ABOVE..
{1H} IS MY FAVORITE. AND RESULTS ARE MIND BLOWING...!
Key Features Include: Clear visual arrows for recent and histor
Hi Traders, The Volume Spike Alert Indicator is a lightweight, non-lagging tool designed to help traders identify unusual volume activity in real time . This indicator calculates the average tick volume over a user-defined number of previous bars and compares it with the current candle’s volume . When the current volume exceeds the average by a specified percentage, the indicator triggers alerts, allowing traders to quickly spot potential breakouts, institutional activity, or strong market inter
FREE

Simple Horizontal Bollinger Bands with Squeeze Alert (HLINE BB Pro) Description This indicator draws horizontal Bollinger Band lines (Upper, Middle, and Lower) directly on the chart and updates them dynamically in real-time.
It provides a clear visual representation of market volatility, and helps traders easily identify potential breakout zones when the market transitions from low volatility (squeeze) to high volatility (expansion). The indicator is designed to be lightweight , visually simple
FREE

We at Minions Labs love to study, challenge and discover new facts about Price Behavior in current markets. We would NOT call it Price Action because today this is a word totally overused and means, thanks to the False Prophets out there, absolutely NOTHING.
The study hypothesis we propose is this: Some Assets, in certain Timeframes, present a behavior of Price continuity when the candlesticks close without a Wick on them... So the purpose of this indicator is to "color" those candlesticks who
FREE

Initiated in 1995 by the physicist and technical analyst Paul Levine, PhD, and subsequently developed by Andrew Coles, PhD, and David Hawkins in a series of articles and the book MIDAS Technical Analysis: A VWAP Approach to Trading and Investing in Today's Markets.Latterly, several important contributions to the project, including new MIDAS curves and indicators, have been made by Bob English, many of them published in the book.
FREE

MarketCrack – Whale Detector: Aligning with Smart Money MarketCrack – Whale Detector is a professional indicator designed to visually and proactively detect the activity of large market participants, known as "whales." Its purpose is to identify key moments of significant institutional pressure, allowing traders to align with the direction of smart money and make strategic decisions with greater confidence. Functionality and Objective MarketCrack – Whale Detector analyzes price action and volume

https://www.mql5.com/en/users/gedeegi/seller
GEN (Trend Fib Zones) GEN (Trend Fib Zones) is a professional technical analysis indicator that automatically detects trend structure shifts using swing highs/lows and dynamically plots key Fibonacci retracement and extension zones. Key Features: Automatic Trend Structure Detection Identifies market structure changes using CHoCH (Change of Character) and BOS (Break of Structure) logic. Highlights trend direction based on real swing high/low pivo
FREE

Moving average indicator to work with the F12 Replay simulation and replay tool.
In this way, the F12 Replay tool now supports the moving average indicator.
F12 Replay: https://www.mql5.com/pt/market/product/38313
This is a product developed by Renato Fiche Junior and available to all MetaTrader 5 users!
Partners: "Águia Traders" team ( Eagle Traders ) by Larissa Sihle #aguiatraders #larissasihle
Input Parameters
Period Shift Method
FREE

The Gann Box indicator is a powerful and versatile tool designed to help traders identify and exploit key market levels. This indicator draws a rectangle on the chart, which is automatically divided into several zones with strategic levels 0, 0.25, 0.50, 075, 1 . When the price touches one of these levels, alerts are triggered, providing valuable assistance for trading decisions. You instantly know the evolution of the market in relation to the zone you have drawn. To draw a zone, simply draw a

Highly configurable Adx indicator.
Features: Highly customizable alert functions (at levels, crosses, direction changes via email, push, sound, popup) Multi timeframe ability Color customization (at levels, crosses, direction changes) Linear interpolation and histogram mode options Works on strategy tester in multi timeframe mode (at weekend without ticks also) Adjustable Levels Parameters:
ADX Timeframe: You can set the lower/higher timeframes for Adx. ADX Bar Shift: you can set the of
FREE

Descubre el poderoso aliado que te guiará en el laberinto de los mercados financieros. Este indicador revolucionario te llevará de la incertidumbre a la claridad, permitiéndote identificar con precisión los puntos de inflexión del mercado. Mejora tus decisiones de entrada y salida, optimiza tus operaciones y ¡multiplica tus ganancias con confianza.
¡Para más información, te invitamos a unirte a nuestro canal de Telegram en https://t.me/Profit_Evolution ¡Allí encontrarás contenido exclusivo, an
FREE
GridLinesX is a lightweight and efficient utility for MetaTrader 5 designed to help traders visualize price levels with precision. Whether you are a Grid Trader, a Scalper, or simply need to mark psychological price levels, GridLinesX automates the process instantly. Forget about drawing manual horizontal lines one by one. Simply define your High/Low range and the grid step (in points), and the tool will generate a clean, customizable grid overlay on your chart. Key Features: Customizable Range:
FREE
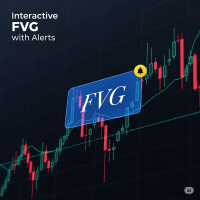
FVG Indicator with Alerts Description: This is a simple and effective indicator for identifying and displaying Fair Value Gaps (FVGs) on any timeframe. The indicator helps you see important price imbalances and provides powerful interactive tools for your analysis. Key Features: Detects FVGs: Clearly identifies and draws boxes around Bullish and Bearish Fair Value Gaps. Midline Level: Displays the 50% equilibrium level inside each FVG box, a critical point of interest. Complete Alert System: Rec
FREE
VWAP Machine Learning Bands: The Predictive Edge for Traders Unlock the next level of market analysis with VWAP Machine Learning Bands – an innovative MQL5 indicator engineered to provide unparalleled insights into market trends, dynamic support/resistance, and high-probability trade signals. Leveraging a proprietary adaptive machine learning algorithm integrated with the power of Volume Weighted Average Price (VWAP), this indicator transcends traditional analysis. It's designed to give you a ge
The MTF Support/Resistance & Trendline Analyzer is a powerful multi-timeframe indicator that automatically detects key support and resistance levels , draws dynamic trendlines , and provides a real-time market structure dashboard — all in one clean, lightweight display. It combines fractal logic and price action detection across three timeframes to give you a unified view of market direction and structure. Whether you trade reversals, breakouts, or trends, this tool highlights the zones that mat
FREE

This Indicator represents the standard Heikin Ashi Candle converter from normal candles. They are applied on a different chart, so you can identify easily both prices. You can also change candles to your favourite colours. If you want to, you can use this indicator into an iCostum, so you can apply other indicators over this on, because there are excellent indicators combined with this type of candles
FREE

This indicator show Gann Swing Chart (One Bar) with multi layer wave. 1. Wave layer F1: Gann waves are drawn based on candles. SGann wave(Swing of Gann) is drawn based on Gann wave of wave layer F1. 2. Wave layer F2: Is a Gann wave drawn based on the SGann wave of wave layer F1. SGann waves are drawn based on Gann waves of wave layer F2. 3. Wave layer F3: Is a Gann wave drawn based on the SGann wave of wave layer F2. SGann waves are drawn based on Gann waves of wave layer F3. ---------Vi
FREE

Indicator Description 4 Hull MA Color + Envelopes is a powerful trend-following indicator for MetaTrader 5 that combines four Hull Moving Averages (HMA) with Moving Average Envelopes to clearly identify market direction, trend strength, and potential reversal or pullback zones. This indicator is designed to reduce noise, react quickly to price movement, and provide a clean visual structure for professional trading. Key Features 4 Hull Moving Averages (20, 50, 100, 200) Automatic color change
FREE
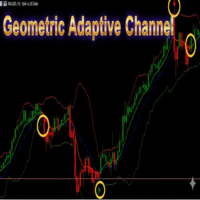
Geometric Adaptive Channel MT5 By Grok(xAI)
*A next-generation adaptive channel based on multiplicative geometry and spectral analysis using the Discrete Fourier Transform (DFT).* NOTE: The MA Gaussiana indicator is also shown in the screenshots. ---
### What Is It and How Does It Work? **Geometric Dynamic Channel MT5** is an **innovative channel indicator** that **does not use moving averages, RSI, MACD, or ATR**. Instead, it applies **advanced geometric calculations** on log-scale price
FREE

BITCOIN DAILY TOP BOTTOM ENGINE (V1)
This is not a simple indicator. This is a professional-grade market observation and decision engine designed for serious Bitcoin traders who demand clarity, structure, and precision.
The Bitcoin Daily Top Bottom Engine is built to identify high-probability daily extremes using adaptive range logic, sweep behavior analysis, and market condition filtering. Instead of reacting late, this engine prepares you in advance by defining where the market is most like
FREE

This is a free version and is forecasting only 5 bars The FourierExtrapolationMAFree indicator transforms and extrapolates the Moving Average function by the Fast Fourier Transformation method.
1. The transformation period is set by two vertical lines, by default the first blue line and the second pink.
2. By default, the Moving Average (MA) line is drawn in red.
3. By Fourier Transform, the indicator builds a model of N harmonics, which is as close as possible to the MA values. The model is
FREE

This indicator is a simple but highly reliable trend-direction predictor designed for traders who prefer clean, accurate signals rather than noisy charts. Key Features Trend-prediction arrows – clear Buy/Sell arrows based on price action and trend flow. Low-frequency, high-accuracy signals – usually around 1 signal per day, but with exceptional precision. Built-in Exit signals – Exit arrows show the right moment to close a trade. No repainting – once an arrow appears, it never changes. Indicator
Breakout Shift Trader – MT5 Indicator Trade Like the Market Architects — Not the Victims. Most traders are fighting blind against a rigged game. Market makers engineer false breakouts, liquidity grabs, and “stop hunts” that wipe out retail accounts in seconds. Breakout Shift Trader flips the script. This MT5 indicator decodes the footprints left by institutional manipulation and aligns your trades with the power brokers driving real price action. Proven Results – Tested, Verified, Relentless N
FREE

Индикатор собирает данные из биржевого стакана, суммируя отложенные ордера на покупку или продажу. Далее, по сумме ордеров определяется общее направление, куда смотрят участники рынка. Если суммарные покупки/продажи превышают определенный коэффициент, то производится сигнал. Настройки: Timer=5 // указывается как часто обновлять данные по рынку в секундах. Чаще чем раз в 10 секунд ставить не рекомендуется. X-size =700 // размер окна по оси Х. Y-size=650// размер окна по оси Y. Only "Market Watch"
FREE

Hull Moving Average is more sensitive to the current price activity than a traditional Moving Average. It faster responds to trend change and more shows the price movement more accurately. This is a color version of the indicator. This indicator has been developed based in the original version created by Sergey <wizardserg@mail.ru>. Suitable for all timeframes.
Parameters Period - smoothing period, recommended values are 9 to 64. The larger the period, the softer the light. Method - smoothing m
FREE
If you love this indicator, please leave a positive rating and comment, it will be a source of motivation to help me create more products <3 Key Takeaways StochRSI is an oscillator that measures the RSI level relative to its high-low range over a period of time. It is more sensitive than the traditional RSI and can highlight overbought or oversold conditions in the market. StochRSI is typically used to generate more frequent and timely trading signals compared with the traditional RSI. StochRSI
FREE

The script tries to determine the overall direction of the market, using smoothed Heiken Ashi candles. The coloring system (using bright and dark colors) is an attempt to detect strong market and weak market conditions. There's also an oscillator within the script
These are the features: Alert condition Features: You can now set alerts in the alert dialog for events like trend switch, trend strengthening and weakening; all for both Bullish and Bearish trend.
I also added the code for custom a
FREE

The VeMAs indicator is an innovative trading tool designed to improve your trading strategy by analyzing volume dynamics and market structure. Whether you are a beginner or an experienced trader, VeMAs gives you an edge. VeMAs indicator available for only $50. Original price of the indicator $299
LIMITED TIME OFFER. Version MT4 Here are some blogs on the VeMAs indicator
Market volume and structure are some of the few major things to keep an eye on.
VeMAs uses advanced algorithms to evaluate vo

High Low Swing (HLS) Indicator
The HLS indicator is a technical analysis tool designed to identify swing highs and lows in the market, aiding swing traders in making informed decisions. It offers an adjustable "degree" parameter, allowing you to customize the sensitivity to strong price movements based on current market conditions.
Features:
• Clear Buy/Sell Signals: The indicator plots signals directly on the chart, simplifying trade identification.
• Adjustable Swing Strength: The "degr
FREE

Candle Detector By Mahefa R. General Description Candle Detector is an advanced technical indicator for MetaTrader 5 , designed to automatically detect and highlight the most important Japanese candlestick patterns directly on the price chart .
It allows traders to quickly identify market reversal and continuation setups without visual clutter. The indicator recolors only the candles that match the selected pattern , ensuring a clear, accurate, and professional chart analysis . ️ How It Work
FREE

This indicator is a straight port of a well known MetaTrader 4 indicator that is freely available on the Internet. It does not redraw at all. It implements a type of breakout strategy. The arrows indicate market direction. Use the indicator on M15 charts and higher. The indicator draws two bands near price action and generates signals when the price closes below the lower band and also above the upper band. The indicator uses periodic highs and lows to calculate upper and lower threshold bands.
FREE

The selective pin bar is designed to identify reversals. To use the selective pin bar effectively, traders typically look for Strong Rejection: The tail of the pin bar should extend significantly beyond the surrounding price action. It indicates that there was a sharp rejection of higher or lower prices during the trading period. A strong rejection suggests that the market sentiment may be changing.
FREE

Santa Bollinger Indicator is an efficient way to detect price retracement in any market. A common approach is to identify overbought or oversold market conditions. When the price of the asset breaks below the lower band of the Bollinger Bands, prices have perhaps fallen too much and are due to bounce. On the other hand, when price breaks above the upper band, the market is perhaps overbought and due for a pullback . Advantages Generates instant buy and sell signals. Never repaints, never back
FREE

The Keltner Channel is a volatility-based technical indicator composed of three separate lines. The middle line is an exponential moving average (EMA) of the price. Additional lines are placed above and below the EMA. The upper band is typically set two times the Average True Range (ATR) above the EMA, and the lower band is typically set two times the ATR below the EMA. The bands expand and contract as volatility (measured by ATR) expands and contracts. Since most price action will be encompasse
FREE

The HighsAndLowsPro indicator for MetaTrader 5 marks local highs and lows in the chart. It distinguishes between weak and strong highs and lows. The line thicknesses and colours can be individually adjusted. In the default setting, the weak highs and lows are displayed thinner, the strong ones thicker. Weak highs and lows have 3 candles in front of and behind them whose highs are lower and lows are higher. The strong highs and lows have 5 candles each.
FREE
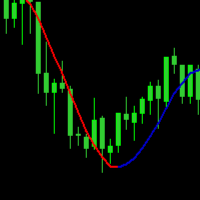
A moving average is simply a way to smooth out price fluctuations to help you distinguish between typical market “noise” and the actual trend direction . By “moving average”, we mean that you are taking the average closing price of a currency pair for the last ‘X’ number of periods. Like every technical indicator, a moving average (MA) indicator is used to help us forecast future prices.
FREE

THIS INDICATOR IS PART OF THE EA: HIPERCUBE PRO GALE BTC Discount code for 20% off at Darwinex Zero: DWZ2328770MGM_20
Introducing the New Version of the Donchian Indicator
We are excited to present the new version of the Donchian Indicator , designed with cutting-edge improvements and enhanced precision. Now fully adapted for HiperCube Pro Gale , this updated tool offers a seamless experience tailored for more effective trading.
Why This Version is a Game-Changer:
Adapted for HiperCube P
FREE
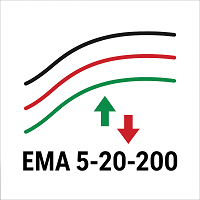
Description (English) EMA 5-20-200 Cross Alerts (Fixed Alerts, No Repaint) This indicator combines three popular EMAs (5, 20, and 200) to help traders identify short-term, mid-term, and long-term trends.
With visual arrows on the chart and automatic alerts (popup & push notification) , it allows traders to catch entries and trend confirmations without constantly monitoring the screen. Key Features: Plots EMA 5, EMA 20, and EMA 200 directly on the chart. Generates Buy/Sell signals (EMA5 vs
FREE

The POC_Levels indicator calculates and displays the 3 most frequently occurring price levels (Points of Control – POC) based on historical candles. It is useful for identifying areas of high market interest (like support/resistance zones) across any timeframe. How It Works
The indicator analyzes the last LookbackBars candles. It counts how many times each price level (based on the selected price type) appears. Then it selects the top 3 most frequent prices and draws horizontal lines at those l
FREE

The indicator looks for the "Fifth dimension" trade signals and marks them on the chart. A detailed description of the chart patterns that generate the trade signals can be found in Chapter 8 "The Balance Line Trades" in the book Williams' "New Trading Dimensions". Signal levels with indication of the position entry or stop loss placement price are indicated directly on the chart. This feature creates additional convenience for the trader when placing pending orders. A solid horizontal line is d
FREE

VM SuperAshi Trend Precision Trend Sniper using Smoothed Heiken Ashi, Supertrend and EMA Trend
Optimized for M1–M5 Scalping
Overview VM SuperAshi Trend is an indicator that combines a standardized Supertrend with smoothed Heiken-Ashi candles to deliver clear, confirmed, and non-repainting buy/sell signals directly on the chart. It automatically draws Buy/Sell arrows, displays Fast, Slow, and Trend EMA lines, and provides Popup, Email, and Push notifications.
Key Features Supertrend-based signal

ADR, AWR & AMR Indicator: Comprehensive Trading Guide Try "Average Daily Range Scalper":
https://www.mql5.com/en/market/product/154469 Core Concepts ADR (Average Daily Range) Definition : The average distance between daily high and low prices over a specified lookback period (typically 14-20 days) Purpose : Measures daily volatility expectations, identifies range-bound versus trending days, sets realistic intraday profit targets Key Insight : Markets tend to respect their average volatility - d
FREE

Stochastic Color Alerts – Smart Momentum & Color Trend Indicator Stochastic Color is an advanced and visual version of the classic Stochastic Oscillator, designed to make momentum and trend changes easier to identify through dynamic color changes and reliable alerts. This indicator combines the traditional %K and %D Stochastic logic with a color-changing main line, helping traders quickly recognize market direction, momentum shifts, and potential reversal zones. Key Features Dynamic Color Line
FREE

Unlock the potential of your trading with the AlphaWave Indicator! Bring calm to your trading: The AlphaWave Indicator is designed to bring serenity to your trading experience by smoothing the chart and providing precise readability of the trend direction. Making clear trading decisions has never been easier. Revolutionary Smoothing Technology with 10 Modes: Experience a smooth and clear chart representation with the AlphaWave Indicator. The revolutionary smoothing technology offers not just on

Introduction
The RSI Plus is an innovative technical analysis tool designed to measure the strength and direction of the market trend. Unlike the traditional RSI indicator, the RSI Plus boasts a distinctive ability to adapt and respond to market volatility, while still minimizing the effects of minor, short-term market fluctuations.
Signal
Buy when the RSI plus has been in the oversold (red) zone some time and it crosses above the 20 level on previous candle close
Sell when the RSI plus ha
FREE

The Kijun-Sen Envelope is a powerful trend-following indicator based on the Kijun-Sen line from the Ichimoku Kinko Hyo system. This tool creates dynamic upper and lower bands around the Kijun-Sen, forming an envelope that helps traders identify market trends, potential reversals, and overbought/oversold conditions.
Key Features: • Trend Confirmation – Helps determine whether the market is in a strong uptrend, downtrend, or ranging phase. • Support & Resistance Zones – The envelope acts as
FREE

A useful and convenient tool for traders when analyzing and making decisions.
Peculiarity
The main feature of this indicator is its fast algorithm . The gain in the speed of calculating the polynomial and its value of the standard deviation in comparison with classical algorithms reaches several thousand times. Also, this indicator includes a Strategy Tester with a clear visualization of transactions, an equity chart and simultaneous calculation and display of the following data in the form of

Magic Trend
This MT5 indicator is a Moving Average with 3 signal colors. The 3 input parameters on this Indicator give you a chance to set any Moving Average of choice. A combination of 2 different exponential moving averages, relative strength index, commodity channel index, and William's percent range provide the signals.
White color = Null/No/Exit Signal Green color = Buy Signal Red color = Sell Signal
Point To Note: Confirm the color change only after the current candle closes to avoid
FREE

Necessary for traders: tools and indicators Waves automatically calculate indicators, channel trend trading Perfect trend-wave automatic calculation channel calculation , MT4 Perfect trend-wave automatic calculation channel calculation , MT5 Local Trading copying Easy And Fast Copy , MT4 Easy And Fast Copy , MT5 Local Trading copying For DEMO Easy And Fast Copy , MT4 DEMO Easy And Fast Copy , MT5 DEMO Fibo: from KTrade 1. Automatically calculate and analyze the band. -> Get the desired band 2.
FREE
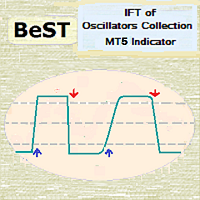
BeST_IFT of Oscillators Collection is a Composite MT4/5 Indicator that is based on the IFT ( Inverse Fisher Transformation ) applied to RSI , CCI , Stochastic and DeMarker Oscillators in order to find the best Entry and Exit points while using these Oscillators in our trading. The IFT was first used by John Ehlers to help clearly define the trigger points while using for this any common Oscillator ( TASC – May 2004 ). All Buy and Sell Signals are derived by the Indicator’s crossings of the Bu

SMC Trend Momentum Signal Line
SMC Trend Momentum Signal Line is an MT5 indicator that draws a smoothed on-chart line and colors it in real time: lime for positive momentum, tomato for negative, derived from the “SMC Trend Momentum” subwindow oscillator. This gives you immediate momentum direction directly in the main chart. Note: You must purchase the “SMC Trend Momentum” to see the line. The SMC Trend Momentum Signal Line is and will remain free of charge for you. Key Features Colored On-Char
FREE
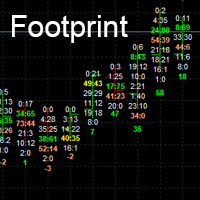
Footprint charts can add a level of depth to your visuals that standard charts cannot achieve.
Footprint charts are a powerful way to visualize the ups and downs of the market, helping you potentially to make better trading decisions. Orderflow Footprint in MT5. show # of market orders at each tick.
Inputs
Point Scale *1 to *10000
Number of candle to show. Font Size Max Bid Color (Top Seller) Max Ask Color (Top Buyer) Max Bid and Ask Color
Normal color

Colored Moving Average – Visual Trend Clarity Made Simple The Colored Moving Average is a clean and effective trend visualization tool that enhances any trading strategy. Unlike standard moving averages, this indicator dynamically changes color based on the direction of the trend—green when rising, red when falling—making it easy to spot shifts in momentum at a glance. Perfect for scalping, day trading, or swing trading, this indicator helps you: Instantly identify bullish and bearish phases Fi
FREE

Easy Correlations Indicator The Easy Correlations Indicator is designed to help traders analyze the relationship between two correlated instruments. By monitoring the distance between their Relative Strength Index (RSI) values, the indicator highlights situations where one instrument has moved significantly further than the other. This creates potential trading opportunities: Sell the stronger instrument (overstretched RSI) Buy the weaker instrument (lagging RSI) Because the positions are opened
FREE

TrendPicoeur — the indicator is non-repainting. ParabolicSAR algorithm based on volatility. The indicator can be used for trailing stop, as a signal indicator, or a trend indicator. If you need to add an alert system (alert, sound, email, Telegram, WhatsApp), please reach out in the comments. It connects to an Expert Advisor via buffers. The indicator has two buffers: SetIndexBuffer(0, sarBuffer, INDICATOR_DATA); — Buffer (0) contains the price level for arrow placement on the chart. SetIndex
FREE

MonsterDash Harmonics Indicator is a harmonic pattern dashboard. It recognizes all major patterns. MonsterDash is a dashboard that displays all detected patterns for all symbols and (almost) all timeframes in sortable and scrollable format. Users can add their own user defined patterns . MonsterDash can open and update charts with the pattern found.
Settings MonsterDash's default settings are good enough most of the time. Feel free to fine tune them to your needs. The color settings are for tho

Indicador Multiple Regression Indicador faz o plot da Curva de Retorno e dos canais superior e inferior de uma regressão para os preços de fechamento do ativo do gráfico. A Curva de Retorno é a linha central do indicador e representa a região de equilíbrio do preço entre vendedores e compradores. Nesse indicador o usuário escolhe o tipo da regressão podendo ser de 3 tipos: primeiro grau, segundo grau ou terceiro grau. Os plots do indicador são: Linha central – cor padrão preta; Linha superi
FREE

This indicator displays the remaining time of the current candle, providing a visual representation of the time left until the candle closes and a new one begins, helping traders to make more informed decisions and stay on top of market fluctuations with precise timing, enhancing their overall trading experience and strategy execution, and allowing them to optimize their trades and maximize their profits.
FREE
Multi-Period EMA is a convenient indicator that displays multiple Exponential Moving Averages (EMAs) on a single chart. It is designed to help traders easily identify market trends and key crossover points without the need to add multiple individual EMA indicators. Key Features: Multiple EMAs in one: Simplifies chart analysis by combining several EMA lines into one indicator. Fully customizable: Easily change the period (default 20, 50, 100, 200), color, and thickness of each EMA line. Clean in
FREE

Discover the secrets big players don't want you to see. Have you ever wondered if the market's "whales" always enter at the same time and in the same direction? This indicator shows you. It doesn't give entry signals, but it reveals historical patterns of movement by hour or day that would normally go unnoticed.
For example, you could discover that on Thursdays at 3:00 PM, EURUSD has an 80% probability of moving upwards . It's ideal for traders who want to confirm hourly biases or identify high
FREE

The indicator is designed for easy construction of synthetic charts based on data of various financial instruments. It will be useful both arbitrage and pair trading, as well as for analysis purposes. Its main advantage is simplicity and clarity. Each chart is given as a common mathematical formula. For example, if you want to plot the spread (difference) between EURUSD and GBPUSD with coefficients 4 and 3, then set the following formula: EURUSD * 4 - GBPUSD * 3 The resulting chart is shown in t

Backstory A few years ago I came to this site looking for a binary-options indicator. As a beginner, I was as confident as I was naïve—I thought I’d find that mythical “holy grail” that would let me make money every day just by following arrows on the screen. I tried hundreds of indicators, paid and free. None of them produced a positive result. Time passed, and I came back to this site. Only now I’m not a beginner but someone who knows what it means to walk the full path—ups and downs, exciteme

QuantumAlert CCI Navigator is a free indicator available for MT4/MT5 platforms, its work is to provide "alerts" when the market is inside "overbought and oversold" regions in the form of "buy or sell" signals. This indicator comes with many customization options mentioned in the parameter section below, user can customise these parameters as needful. Join our MQL5 group , where we share important news and updates. You are also welcome to join our private channel as well, contact me for the pri
FREE

Классический индикатор фракталов является запаздывающим, т.к. для подтверждения образования фрактала необходимо ждать 2 бара. Если этого избежать, то индикатор будет перерисовывающим, т.е. при обновлении максимума/минимума в течении 2-х баров фрактал будет менять своё положение на более позднее. В данном продукте максимально нивелированы оба этих недостатка, при этом совмещены достоинства обоих подходов! Индикатор показывает фрактал сразу в момент его образования, а в случае его обновления показ
FREE

The Monthly Weekly Open Line is an indicator that plots: The current month open line that will extend till the last week on the month. Weekly lines that span the look back days period that you have set . Each line will extend from the respective weekly Monday zero GMT till friday of the respective week. Monthly and Weekly open lines can be used to build very powerfull anc consistent trading strategies. They act as natural S/R price barriers.
FREE

Body Ratio Indicator for MT5 – Candle Strength and Compression Analyzer The Body Ratio Indicator is a technical tool for analyzing candlestick structure and identifying market conditions based on the ratio between the candle’s body (open-close) and its total range (high-low). This simple yet powerful calculation helps traders detect strong momentum candles, indecision candles, and range compression phases, which often precede major breakouts. Each candlestick is categorized in real time: Weak c
FREE

Market Steps indicator is designed and built based on Gann Time/Price correlations and optimized by Price Action specific rules for Financial Markets such as Forex. It uses Market order flow concepts to predict potential price zones for high volume of orders. Indicator Levels can be used for trading itself or as a combination for filtering wrong signals of other Strategies/Indicators. Every trader needs such powerful tool to have multi-time-frame (TF) zones and price movement potentials togethe
The KT Trend Reversal Probability calculates the real-time probability of a trend reversal using a refined RSI-based algorithm. Displayed as a clear percentage, this probability helps you gauge when an ongoing trend is losing steam or when a new one is likely forming. Whether you’re planning your entries or tightening your exits, this indicator brings a data-backed edge to your trading decisions.
Features
Displays a clear probability percentage directly on the oscillator, helping traders antic
The MetaTrader Market is the best place to sell trading robots and technical indicators.
You only need to develop an application for the MetaTrader platform with an attractive design and a good description. We will explain you how to publish your product on the Market to offer it to millions of MetaTrader users.
You are missing trading opportunities:
- Free trading apps
- Over 8,000 signals for copying
- Economic news for exploring financial markets
Registration
Log in
If you do not have an account, please register
Allow the use of cookies to log in to the MQL5.com website.
Please enable the necessary setting in your browser, otherwise you will not be able to log in.