Watch the Market tutorial videos on YouTube
How to buy а trading robot or an indicator
Run your EA on
virtual hosting
virtual hosting
Test аn indicator/trading robot before buying
Want to earn in the Market?
How to present a product for a sell-through
Technical Indicators for MetaTrader 5 - 42
Gold Signal Quality Selector Stop Guessing. Start Trading Gold with Institutional-Grade Clarity. Are you tired of the chaotic nature of the Gold (XAUUSD) market? Frustrated with generic indicators that generate endless false signals and drain your capital? The truth is, Gold doesn't move like other assets. It demands a specialized tool built for its unique volatility and personality. It's time to stop using one-size-fits-all tools and start trading with an intelligent edge. Introducing Gold Sign

Machine Learning Adaptive SuperTrend - Take Your Trading to the Next Level!
Introducing the Machine Learning Adaptive SuperTrend , an advanced trading indicator designed to adapt to market volatility dynamically using machine learning techniques. This indicator employs k-means clustering to categorize market volatility into high, medium, and low levels, enhancing the traditional SuperTrend strategy. Perfect for traders who want an edge in identifying trend shifts and market conditio
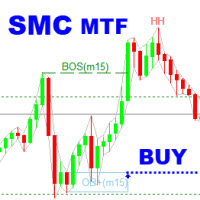
SMC Analyzer Multi-Timeframe is a powerful tool designed to help traders apply Smart Money Concepts (SMC) across multiple timeframes. This indicator identifies key structural points such as market structure shifts (Break of Structure and Change of Character), order blocks, fair value gaps (FVG), and liquidity zones from higher timeframes and overlays them onto the current chart. By aligning these critical SMC signals across multiple timeframes, traders gain a more comprehensive view of instituti

The underlying strategy of this indicator is based on identifying momentum in the market and attempting to capture the direction of the trend through transitions between bullish and bearish moments. Utilizing bands around the RWMA allows for identifying potential overbought and oversold situations in the market.
1. Calculation of the Range Momentum Index (RMI): The RMI is based on a combination of the Relative Strength Index (RSI) and the Money Flow Index (MFI), both of which are momentum indi

Weis Wave Volume Indicator for MetaTrader 5 (MT5) Check all of our products here: All Products Specifications Platform: MetaTrader 5 (MT5)
Type: Custom Technical Trading Indicator
Level: Intermediate
Timeframes: All Timeframes (Multi-Timeframe Support)
Trading Styles: Scalping, Day Trading, Swing Trading, Position Trading
Markets: Forex, Stocks, Commodities, Indices, and Cryptocurrencies What Does This Indicator Do? The Weis Wave Volume Indicator for MT5 is a powerful Price Action + V

ToolBot Advisor Indicator (RSI, ATR, ADX, OBV) FREE An effective indicator for your negotiations
The toolbot indicator and advisor brings leading (OBV) and lagging (RSI, ATR, ADX) indicators so that you have more security in your negotiations. In addition, it informs you of possible up and down trends as well as providing you with incredible advisors who will give you information about trading opportunities.
With this indicator you will have more security and speed in your decision making of
FREE

The UTS Trading Stat indicator, developed by Ultron Trading Solutions, is a customizable tool designed to track and display trading statistics for the current chart's symbol. It presents a visual dashboard on the chart, offering real-time insights into trading performance with a toggleable panel (STAT SHOW/STAT HIDE) for user convenience. Below is a detailed description of its features and functionality: Trading Statistics Displayed : Current Positions : Number of open profit/loss trades and tot

# SamuraiFX Combined Pro V14 **Master Market Turns with Real-Time Volume & Structure**
Stop guessing where the market will turn. The **SamuraiFX Combined Pro** is a comprehensive trading system that combines **Daily Structure**, **Volume Flow**, and **Price Action** into a single, non-repainting dashboard. It helps you identify high-probability Reversals and powerful Breakouts without the lag of traditional indicators.
### **Key Advantages**
* **No Lag, No Repaint:** Signals are generated in

Heikin Ashi candlesticks are a powerful tool for traders, offering a clear and smooth visualization of market trends. Unlike traditional candlesticks, they filter out market noise, providing a cleaner view of the market's direction and strength, which helps traders make more informed decisions. The Hull Heikin Ashi Smoothed indicator from Minions Labs takes this a step further by integrating the Hull Moving Average for enhanced smoothing and precision. This indicator not only simplifies trend id

StrikeZone Macd Atr is an advanced volatility-adaptive oscillator that scales the traditional MACD using ATR.
This approach solves the common problem of conventional MACD: it does not react properly to changing volatility.
With ATR scaling, momentum becomes clearer, smoother, and more meaningful across all market conditions. Key Features 1. ATR-Scaled MACD Oscillator The indicator adjusts (MACD – Signal) by ATR ratio, allowing: Reduced noise during high-volatility periods Enhanced sensitivity du
FREE

Trendlines with Breaks Overview The Trendlines with Breaks indicator automatically detects and plots pivot-based trendlines, dynamically adjusting their slope and steepness to highlight significant breakout events. Designed for traders who rely on price action and market structure , this tool provides an automated, real-time way to track evolving momentum and breakout confirmations . How It Works The indicator identifies swing highs and swing lows , connecting them to form adaptive trendlines ba

Scalp using the behavior of a short moving average, the indicator gives the slope and identifies the "hyper" moments.
Operational advice:
Use M1 chart. Period 20 : open buy after two rising lows; sell after two max downhill; avoid countertrend openings; when the line goes flat put a stop at the opening price. Avoid actions in low volatility timeslots. When the curve that draws the min / max is very flat, it is better to postpone at least 15'.
Period 50 : matches the trend, when it is at
FREE

Bollinger Bands Technical Indicator (BB) is similar to envelopes. The only difference is that the bands of Envelopes are plotted a fixed distance (%) away from the moving average, while the Bollinger Bands are plotted a certain number of standard deviations away from it. Standard deviation is a measure of volatility, therefore Bollinger Bands adjust themselves to the market conditions. When the markets become more volatile, the bands widen and they contract during less volatile periods. This ada
FREE

GenMA MTF
The signal indicator WITHOUT REDRAWING gives recommendations on the direction of trading.
When the price moves through the internal channel, it gives signals (red and blue arrows) that recommend a possible change in the direction of the price movement up or down.
When the price crosses the external channel, it gives signals (yellow arrows), warning that a strong price movement is possible, which will not immediately change the direction of trading.
When the price crosses the avera
FREE

The indicator plots a curve of the difference between the values of two trading instruments (currency pairs).
The purpose of the indicator is to observe the processes of divergence and convergence of the values of two trading instruments. The results obtained can be used for trading strategies of statistical arbitrage, pair trading, correlation, and others.
Trading strategy
The indicator is attached to the chart of any trading instrument. In the input parameters, the names of trading instr
FREE

Structure Levels (Highs & Lows) Indicator for MetaTrader 5
Decode Market DNA — Trade with Institutional Precision Description:
The Structure Levels (Highs & Lows) Indicator is your secret weapon to map the market’s hidden roadmap. Designed for traders who think in terms of price action and market structure, this tool automatically identifies critical swing highs and swing lows, transforming chaotic charts into a clear blueprint of support/resistance zones, breakout opportunities, and trend rev

Apex Swing VWAP MT5 Apex Swing VWAP is an advanced indicator for MetaTrader 5 that combines VWAP (Volume Weighted Average Price) analysis with automatic detection of significant swing points. This combination provides accurate market sentiment insight and potential reversal points. Key Features Integrated Technical Analysis - Dynamic VWAP from relevant swing points - Historical VWAP for long-term trend analysis - Multiple configurable VWAP periods
Recommended Trading Types - Swing Trading for

This is a general purpose indicator that displays colored lines at fixed and customizable price intervals, entered as parameters. It offers universal, constant, and familiar price ranges that allow quick and precise price analysis of a currency pair. With default parameters, this indicator implements The Quarters Theory , as described originally by Ilian Yotov . [ Installation Guide | Update Guide | Troubleshooting | FAQ | All Products ] Easy to use No optimization needed Customizable price inte
FREE

Pivot eXtreme Pivot adalah level referensi penting yang digunakan trader untuk memetakan potensi support & resistance intraday maupun jangka lebih panjang.
Dalam sistem ini, level pivot dikembangkan menjadi P (Pivot Point utama) , R1–R13 (Resistance) , serta S1–S13 (Support) . Pivot Point (P) Titik pusat utama, dihitung dari rata-rata harga (High + Low + Close) / 3 . Berfungsi sebagai acuan keseimbangan harga : Jika harga di atas P → tren cenderung bullish. Jika harga di bawah P → tren cenderung
FREE

The Fibonacci indicator automatically displays the Fibonacci retracement levels, representing significant support and resistance. The range for calculating the indicator can be taken from the previous day, week, month, year or user-specified session.
Levels 100 % (High) of the range from the previous session. 0 % (Low) of the range from the previous session. 76,4 % of the range from the previous session. 61,8 % of the range from the previous session. 50 % of the range from the previou
FREE
Description: The MACD Combined is an advanced indicator that integrates two visualization modes to provide clearer, more adaptable analysis of Moving Average Convergence/Divergence. Key Features: Two operating modes : Mode 1 : Histogram colored according to the MACD sign (positive or negative). Signal line colored according to the relationship between MACD and the signal line. Mode 2 : Histogram colored based on the comparison between MACD and the signal line. Signal line colored according to
FREE

Данный индикатор показывает объем каждого бара (видимый диапазон) в пунктах. Гибкие настройки отображения значений. Возможна настройка параметров показа. Индикатор создавался для личного пользования, анализа графиков. Параметры: Color - цвет текстовых меток; Position - позиция метки: 0 - снизу, 1 - сверху; FontSize - размер шрифта; Angle - угол наклона текста; GapPoints - отступ по вертикальной оси.
FREE

Indicator for Displaying Trade Results on the Chart This indicator is designed to visualize trading results directly on the chart, making it easier for traders to analyze their strategy and trade performance. It automatically displays all open, closed, and pending orders, along with additional information for convenient analysis. Features: Trade Visualization : Displays all entry and exit points on the chart with clear indications of direction (buy/sell). Profit/Loss Display : Each trade is anno
FREE

This is a general purpose indicator that displays colored lines at fixed and customizable price intervals, entered as parameters. It offers universal, constant, and familiar price ranges that allow quick and precise price analysis of a currency pair. With default parameters, this indicator implements The Quarters Theory , as described originally by Ilian Yotov . [ Installation Guide | Update Guide | Troubleshooting | FAQ | All Products ] Easy to use No optimization needed Customizable price int
FREE

Fibonacci Trend Indicator for MT5 Unlock the power of Fibonacci analysis on your MetaTrader 5 charts!
Our Fibonacci Trend Indicator automatically plots dynamic support and resistance levels so you can spot trends, reversals, and breakout opportunities at a glance. Features & Advantages Automatic Fibonacci Levels
Instantly displays seven key Fibonacci retracement levels based on the highest and lowest prices from your chosen lookback period — no manual work required. Dynamic Trend Adaptatio
FREE

Highly configurable OBV indicator.
Features: Highly customizable alert functions (at levels, crosses, direction changes via email, push, sound, popup) Multi timeframe ability Color customization (at levels, crosses, direction changes) Linear interpolation and histogram mode options Works on strategy tester in multi timeframe mode (at weekend without ticks also) Adjustable Levels Parameters:
OBV Timeframe: You can set the lower/higher timeframes for OBV. OBV Bar Shift: Y ou can set the offset
FREE
BullBear Dynamics is a powerful and intuitive custom indicator designed for MetaTrader 5 traders who want to clearly visualize market momentum, identify bullish and bearish conditions, and trade with confidence. Built with professional-grade algorithms, this tool transforms raw price action into actionable signals using dynamic histograms, signal lines, and adaptive thresholds.
Whether you are a beginner exploring technical analysis or an advanced trader looking for a reliable confirmation t
FREE

The Trail Stops Point indicator shows the deviation from the current price by a certain distance. It has been developed as an additional indicator for Trail Stops by Custom Indicator , to provide a simple trailing of a position stop loss at a specified distance in points.
Indicator Parameters Distance - trailing stop distance in points. Buffer numbers: 0 - Support, 1 - Resistance.
FREE

Based on the trend-following principle of CCI, it has been improved to become an indicator that can identify the reversal of the trend and its development direction, that is, it can identify the top and bottom attenuation of the oscillating trend in the trend market. feature The red and green columns represent the trend of bullish or bearish development under the current cycle. The blue line shows the position and attenuation of the current price trend in the current cycle. The upper and lower
FREE

The DR IDR Range Indicator plots ADR, ODR and RDR ranges for a given amount of days in the past. A key feature that appears is that it calculates the success rate of the ranges for the shown days. This indicator is perfect for backtest since it shows ranges for all of the calculated days, not just the most recent sessions. PRO VERSION
https://www.mql5.com/en/market/product/93360 Remember: this free version counts neutral days as true days , so stats might be slightly inflated. To get perfect a
FREE

NeuraVault Pro v1.0 - Professional RSI Reversal Trading System Overview NeuraVault Pro is a professional automated trading system based on RSI (Relative Strength Index) reversals. It is designed to capture reversal opportunities in overbought and oversold zones, equipped with advanced filters and comprehensive risk management features. Trading Logic Core Strategy: RSI Reversal The EA captures reversal opportunities when the market reaches overbought or oversold zones: BUY Signal: RSI value drops
FREE

Features
All Ichimoku Signals (Selectable) : Display all reliable signals generated by the Ichimoku indicator. You can choose which signals to view based on your preferences. Filter by Signal Strength : Sort signals by their strength—whether they are weak, neutral, or strong. Live Notifications : Receive real-time notifications for Ichimoku signals.
Transparent Cloud : Visualize the Ichimoku cloud in a transparent manner.
Available Signals
Tenkensen-Kijunsen Cross Price-Kijunsen Cross Price-C
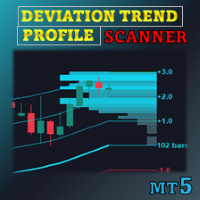
Special offer : ALL TOOLS , just $35 each! New tools will be $30 for the first week or the first 3 purchases ! Trading Tools Channel on MQL5 : Join my MQL5 channel to update the latest news from me Deviation Trend Profile Scanner (DTPS) - An indicator that detects trend direction, gauges volatility, and organises information from several symbols / timeframes in one table. It applies a configurable moving average, adaptive standard‑deviation zones, and a distribution histogram to pr
Time Dashboard MT5 is a powerful and user-friendly MetaTrader 5 indicator designed to provide real-time time zone and clock information directly on your trading chart. Ideal for forex traders and global market participants, this tool displays server time, local time, and the time difference between them, enhancing your ability to manage trades across different time zones. Key Features : Real-Time Time Display : Shows current server time, local time, and their respective time zones with precise o
FREE
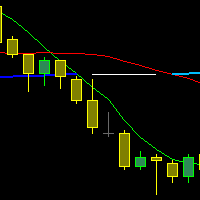
The indicator draws three Moving Averages. Two short ones cross a long one.
At the same time, the long MA changes color: If both short MAs are above the long one - first color; If both short MAs are below the long one - second color; If the two short MAs are on opposite sides of the long one - third color. All three MAs are based on closing prices with a smoothing method of "simple."
cross MA cross 3 MA cross three Moving Average across Moving cross Moving crossing MA crossing MA across MA
FREE

If you love this indicator, please leave a positive rating and comment, it will be a source of motivation to help me create more products <3 Key Takeaways Generates buy and sell signals earlier than regular MA This indicator can detect a trend when it is just starting Filter : A special parameter that is useful for filtering out spikes without causing lag. However, like all indicators, it isn't foolproof, to avoid false signals, it's best to use the Dots indicator with other indicators. Te
FREE

Alert System You use function keys to create horizontal lines for alerts. 1. Allow set horizontal line properties (line color, line style, line width, ...) for alerts. 2. Allow add text to horizotanl line. You can hide or show text when you need. You can change text and its price, but time of text will be set in input named "text_time" (0 is current time, you should test this input with -1, -2, -3 or lower). 3. It has 2 types of alert: above and bellow. You can set key to create them. If price i
FREE

Highly configurable Demarker indicator.
Features: Highly customizable alert functions (at levels, crosses, direction changes via email, push, sound, popup) Multi timeframe ability Color customization (at levels, crosses, direction changes) Linear interpolation and histogram mode options Works on strategy tester in multi timeframe mode (at weekend without ticks also) Adjustable Levels Parameters:
Demarker Timeframe: You can set the lower/higher timeframes for Demarker. Demarker Bar Shift: Y ou
FREE

Tape Reading, flow monitoring.
FabFlowInPrice is a powerful indicator for those who like Tape Reading (Times & Trades). It presents the volumes traded at each price level, considering the purchase, sale and direct aggressions for each level. Excellent tool for market flow analysis. Thought of flow so monitor who is attacking the most, buyers, sellers or direct exchanges, thought FabFlowInPrice. The indicator displays information in 4 distinct and fixed periods, on any timeframe: @Day - All t

Indicator developed in order to notify the user when the RSI enters and leaves the overbought and oversold regions, the information is shown in the form of audible and text alerts. Notifications can be disabled at any time. The indicator period can be changed by the user, and it is possible to insert the RSI indicator in the graph through the alerts. Aurélio Machado
FREE

This is the MT5 version. Get Dual Onset MT4 here
It is an algorithm to detect trend changes early. You should try multiple values for the Multiplier parameter (1 <value <10 recommended). At first glance you can see effective entries. This is, in fact, one of the rows that Geleg Faktor initially had. But it was removed because it was no longer needed. The other rows were sufficient for G.Faktor's effectiveness, but I still wanted to share this one.
Always test before using it on your live ac
FREE

Signal indicator for binary options that is also used effectively on Forex and other markets. It is suitable for short-term grid trading on M1–M5 and includes step-by-step position scaling signals. The indicator uses two-level adaptation: a basic speed profile (a “fast/smooth” setting right from the start) and auto-adaptation based on trade results, which adjusts the filters to the current market, taking into account series of winning and losing signals. The model looks for short directional im
SMC Trend Momentum SMC Trend Momentum is a momentum oscillator displayed in a separate window. It combines Donchian position bias with ZigZag leg normalization into one adaptively smoothed signal. A color‑coded histogram with prewarn and warn states supports visual assessment of direction and momentum changes. Optional higher‑timeframe alignment (H1/H4) can be used as a filter. Features Combined bias oscillator (Donchian + ZigZag) Donchian position bias (distance from channel equilibrium) ZigZ

The Volume Plus indicator for MT5 can be effectively used for detecting imbalances in supply and demand.
The indicator improves on the typical volume histogram by coloring the bars.
Bar colors (colors are customizable):
Neutral - DimGray Wide Spread (Range) Bar on High Volume - MediumBlue Narrow Spread, High Volume - MidnightBlue Wide Spread, Low Volume - ForestGreen Narrow Spread, Low Volume - DarkGreen Very/Ultra Wide Spread, Low Volume - Aqua Narrow Spread, Ultra High Volume - Purple Very/
FREE

This indicator is based on the Fractals indicator. It helps the user identifying whether to buy or sell. It comes with an alert that will sound whenever a new signal appears. It also features an email facility. Your email address and SMTP Server settings should be specified in the settings window of the "Mailbox" tab in your MetaTrader 5. Blue arrow up = Buy. Red arrow down = Sell. Line = Trailing Stop. You can use one of my Trailing Stop products that automatically move the Stop Loss and includ
FREE

Il WaveForce Indicatorsu un sistema di doppia envelope esponenziale e smussamento dinamico, WaveForce separa matematicamente l'energia rialzista e ribassista, tracciando due curve (Bull e Bear) e una linea di segnale centrale. Questo consente al trader di percepire con chiarezza quale delle due forze stia guidando il mercato. Caratteristiche principali: Calcola la pressione rialzista e ribassista separatamente Include una linea di segnale EMA adattiva per confermare inversioni Oscillatore fluid
FREE

Quantum Volatility Analysis and Market Regime Detection Schrödinger Market Wells (SMW) offers an alternative approach to traditional technical analysis. Unlike standard volatility bands based solely on simple statistical deviations, SMW models price action using principles of Financial Quantum Mechanics . This indicator interprets price as a particle interacting within a "Potential Well," allowing traders to visualize the probability of the price remaining in a range or performing a structural b

The Multi Strategy Ranges Indicator MT5 is a powerful tool designed to detect and visualize price consolidation zones in the market. This indicator identifies ranges and draws them on the chart, providing clear signals for efficient trading. Key Features Our indicator incorporates three essential strategies for trading within consolidation ranges: Range Breakout Strategy: A classic range breakout strategy. When the price breaks the upper or lower boundary of the range, a buy or sell signal i
FREE
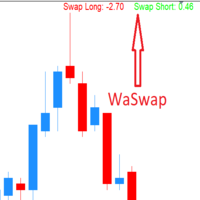
WaSwap MT5 Indicator shows the current Swap Long and current Swap Short with color.
* Set the Swap Threshold and the color to identify when the current swap is below or above the Spread Threshold.
* Set X axis and Y axis and chose the Corner and the Anchor to position the Swap Label on the chart.
* Write the font and the font size for more confort.
* Activate alert if the current Swap Long or the current Swap Short is below the swap threshold.
* The user will never swing with a negative sw
FREE

Graphical representation of the intraday currency strength. The calculation is based on 28 pairs. The values are tracked from the starting time of the daily candle up to the current time. This indicator originally was created as complimentary tool for FX28 Trader dashboard. Now you can use it for free.
The indicator has multiple settings for customization and you can also link it directly to the FX28 Trader chart control system.
Note! This indicator does not work in the Strategy Tester. To t
FREE

Add Logo Watermark – Showcase Your Signals with Clarity This indicator allows you to display a clean and customizable watermark on your chart, helping your audience easily identify what symbol you're currently trading. Display the current symbol as a watermark
Add current symbol text and customize its color
Choose to show only the logo, only the symbol, or both
Add your own custom watermark by placing custom.bmp in the MQL5 > Files directory Perfect for signal providers, educators, and
FREE
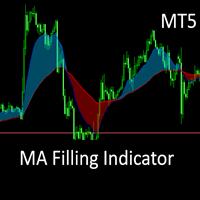
This is the MT5 converted Version of the The MA Filling Indicator, developed by Scriptong, is an advanced technical analysis tool designed for MetaTrader 4 (MT4) that enhances the traditional Moving Average (MA) indicator by incorporating a visually intuitive filling feature. The MA Filling Indicator is a versatile tool suitable for both novice and experienced traders seeking to enhance their trend-following strategies with a clear, color-coded representation of market dynamics Settings: Upward
FREE

This tick indicator draws synthetic bars/candlesticks that contain a definite number of ticks. Parameters: option prices - price option. It can be Bid, Ask or (Ask+Bid)/2. the number of ticks to identify Bar - number of ticks that form OHLC. price levels count - number of displayed price levels (no levels are displayed if set to 0 or a lower value). calculated bar - number of bars on the chart. Buffer indexes: 0 - OPEN, 1 - HIGH, 2 - LOW, 3 - CLOSE.
FREE

Colors generated according to trading volume and market direction.
The analysis is carried out following the direction of the price and volume traded if the traded value exceeds the calculation base the system changes the color to green, informing you that the price direction is strong to buy, if the traded value is less than the calculation base the system changes to red, indicating that the price is strong for sale.
FREE

Multi-MA Ribbon Overlay (6 EMAs + 250 SMA)
This indicator displays six exponential moving averages (15, 25, 35, 45, 60, 70)(YOU CAN CHANGE THE VALUES) and a slow 250-period simple moving average to help visualize market momentum and trend structure. It’s designed as a clean trend-ribbon for scalpers, intraday, and swing traders. ️ Disclaimer:
Trading forex and CFDs on margin carries a high level of risk and may not be suitable for all investors. Leverage can work for or against you. Always u
FREE
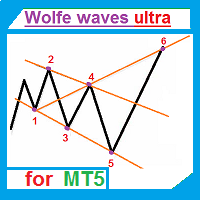
The indicator automatically draws Wolfe waves. The indicator uses Wolfe waves found in three timeframes. This indicator is especially accurate because it waits for a breakout in the wave direction before signaling the trade. Recommended timeframe: М1.
Indicator features Amazingly easy to trade. The indicator is able to recognize all the patterns of Wolfe waves in the specified period interval. It is a check of potential points 1,2,3,4,5 on every top, not only the tops of the zigzag. Finds the p

This indicator provides common shapes as drawing object options. The shapes are rotatable, resizable, draggable, and will keep their proportions (according to their handle trendline) across different chart scales. Multiple drawings are supported.
Shapes: Square Rhombus
Triangle (quadrilateral & isosceles) Circle (grid, overlapped grid, flexi grid, rotatable grid, concentric circles) Features: rays (all object edges will be rays) show/hide each individual drawing type, or all delete last drawn ob
FREE

Swing and Liquidity Sweep Finder is a powerful tool designed to automatically detect swing points and liquidity sweeps on your chart.
It helps traders identify where the market is likely to grab liquidity before reversing, showing both internal and external liquidity zones with high accuracy.
This indicator is ideal for ICT and Smart Money Concept traders who rely on swing structure and liquidity manipulation for their entries and exits.
Our Team Services: If you are want to see our products cl
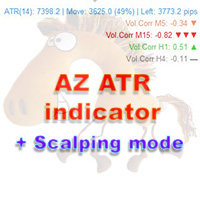
AZ ATR indicator (with volume correlation bonus)
Standard ATR indicator, you can enable ignoring abnormally large candles. It is possible to change the location of the displayed text in 4 corners of the chart. You can change the calculation period (days ago). Bonus - the indicator has a correlation with volumes. Can be enabled to display a possible priority at the current moment in the market.
What do the values mean: Positive correlation (0.3 - 1.0): 0.3-0.7 - moderate connection
FREE

Time to Trade Trading timing indicator is based on market volatility through 2 ATR indicators to determine the timing of a transaction. The indicator determines the times when the market has strong volatility in trend. When histogram is greater than 0 (blue) is a strong market, when histogram is less than 0 (yellow) is a weak market. Should only trade within histograms greater than 0. Based on the histogram chart, the first histogram value is greater than 0 and the second histogram appears, this
FREE

The best and the only World Time Display for MT5
Features :
- JAPAN, LONDON & NEW YORK Time Display
- You can customize with different Font, Color And Text Size
- You can customize Box Position and Box Color to meet your satisfaction
- Only For Metatrader 5
- Customize GMT according to your Time Zone
- Simple To Use. Just Attach to your MT5
- No hidden code or no errors
FREE

SSACD - Singular Spectrum Average Convergence/Divergence This is an analogue of the MACD indicator based on the Caterpillar-SSA ( Singular Spectrum Analysis ) method. Limited version of the SSACD Forecast indicator. Limitations include the set of parameters and their range.
Specificity of the method The Caterpillar-SSA is an effective method to handle non-stationary time series with unknown internal structure. The method allows to find the previously unknown periodicities of the series and make
FREE

For those traders and students who follow the famous brazilian trader Igor Rodrigues (Mago Trader) here it is another tool he uses: a 2-line MACD specially set with Phi ratios. This MACD is packed with a twist: a Filling Area , to easily and visually spot the corresponding trend on the chart. Obviously, you can turn On and Off this filling feature. If you don't know Igor Rodrigues and you are a brazilian trader and student, just google for him... Very simple and useful indicator.
If you are loo
FREE

Dynamic Market Insights for Smart Trading Our goal is to provide seamless, high-quality services that empower market participants, traders, and analysts with real-time market insights and key indicators for informed decision-making. Advanced & User-Friendly Trend Analysis This is a cutting-edge, highly robust, and easy-to-use dynamic trend analysis indicator. The DYJ Market Watch Indicator evaluates market bullish and bearish strength using two distinct methods—each designed to measure differe
TMX TREND - MULTI-TIMEFRAME TREND INDICATOR WITH SMART SIGNALS
Your Ultimate Trading Ally - Perfect for Beginners and Experienced Traders ! Imagine an indicator that finally gives you that long-sought clarity in the markets...
The price start from $30 and will increase by $20 with every 10 purchases. Final price $89
Please send me a private message after contacting the expert. I will send you instructions with all the necessary recommendations.
TMX Trend isn't just another indicator. It
Hi Traders, The THV EMA Distance Monitor is a lightweight and flexible MT5 indicator designed to display the real-time distance between price and multiple Exponential Moving Averages (EMA) directly on the chart. The indicator allows traders to enable or disable up to five EMAs , each with a customizable period , making it adaptable to different trading strategies and market conditions. For each selected EMA, the distance from the current price is calculated and displayed in a clear on-chart pane
FREE

The Martinware Volume indicator plots a colored moving average over volume bars. The coloring uses three colors and can be done in different ways choosable by the user and is applied both to the average as to the volume bars.
Three types of coloring are possible: None: no coloring is done Increasing or decreasing: changes the color depending on the current value being bigger or lesser than the previous one Volume relative to average: colors vary if the current volume is bigger or lesser then
FREE

Un potente indicatore multifunzione progettato per offrire una visione chiara e strutturata della forza del mercato, integrando tre strumenti tecnici in un'unica interfaccia intuitiva: Caratteristiche principali: Heikin Ashi RSI Normalizzato Calcolato sul RSI di medie Heikin Ashi, centrato su una scala da -50 a +50 Visualizzazione con candele colorate (blu/rosso) per una lettura chiara della direzione e del momentum Stocastico Modificato %K e %D convertiti sulla stessa scala -50/+50 Opzion

The Bolliger Bands On-Off let you control the indicator using the keyboard or a button . You can choose if you want the indicator always shown or always hided while switching among different time frames or financial instruments . ---> This indicator is part of Combo Indicator OnOff
The Bollinger Bands identify the degree of real-time volatility for a financial instruments . A lower amplitude corresponds to a low volatility, conversely a greater bandwidth corresponds to high volatility.
FREE

The ShowSessions indicator for MT5 shows up to two, self-selected, time intervals, for a free choosen number of days past and a few future days. Weekends are marked with an additional red vertical line. The indicator makes manuel backtesting of strategies more easily, but you can use ist for daily trading as well. Please note that the server time does not always correspond to the actual time.
FREE
Do you know why the MetaTrader Market is the best place to sell trading strategies and technical indicators? No need for advertising or software protection, no payment troubles. Everything is provided in the MetaTrader Market.
You are missing trading opportunities:
- Free trading apps
- Over 8,000 signals for copying
- Economic news for exploring financial markets
Registration
Log in
If you do not have an account, please register
Allow the use of cookies to log in to the MQL5.com website.
Please enable the necessary setting in your browser, otherwise you will not be able to log in.