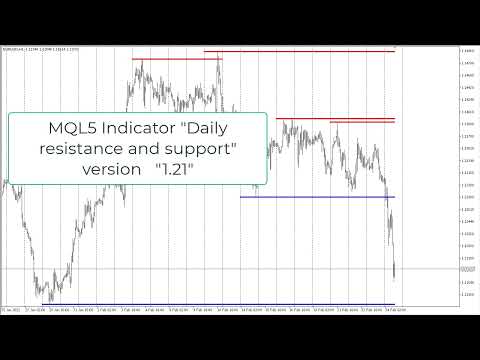
Daily resistance and support
- Indicators
-
Vladimir Karputov
 Create a personal work for me: https://www.mql5.com/en/job/new?prefered=barabashkakvn
 - Version: 1.21
- Updated: 14 March 2023
- Activations: 5
MQL5 "Daily resistance and support" indicator - draws daily support and resistance lines. Drawing is carried out only with the help of graphical objects (trend lines) - indicator buffers are not used in this indicator.
The indicator has no settings - the search for levels is carried out on the last 500 bars from the "D1" timeframe and this parameter is hardwired inside the code.
Manual trading:
When trading manually, this indicator is recommended to be used on timeframes from "M10" to "H1". It can be used in two strategies: breakout of the level and rebound from the level, or a combination of both strategies. The main thing to remember is that daily levels are drawn with a delay of three or four days - this is the minimum time for the level to form. In rare cases, levels can disappear if the trend changes dramatically within a three to four day period.
If more conservative trading is used, then you need to look for confirmation from other indicators (trend or oscillators).