Concepts SMC ICT
- Indicators
-
Simon Draxler
 # 🛠️ Professional Trading Infrastructure & Indicators for MetaTrader
 - Version: 1.22
- Updated: 14 October 2026
- Activations: 10
DRX SMC Indicator for MT5 – Ultimate Smart Money Concepts & ICT Trading Indicator
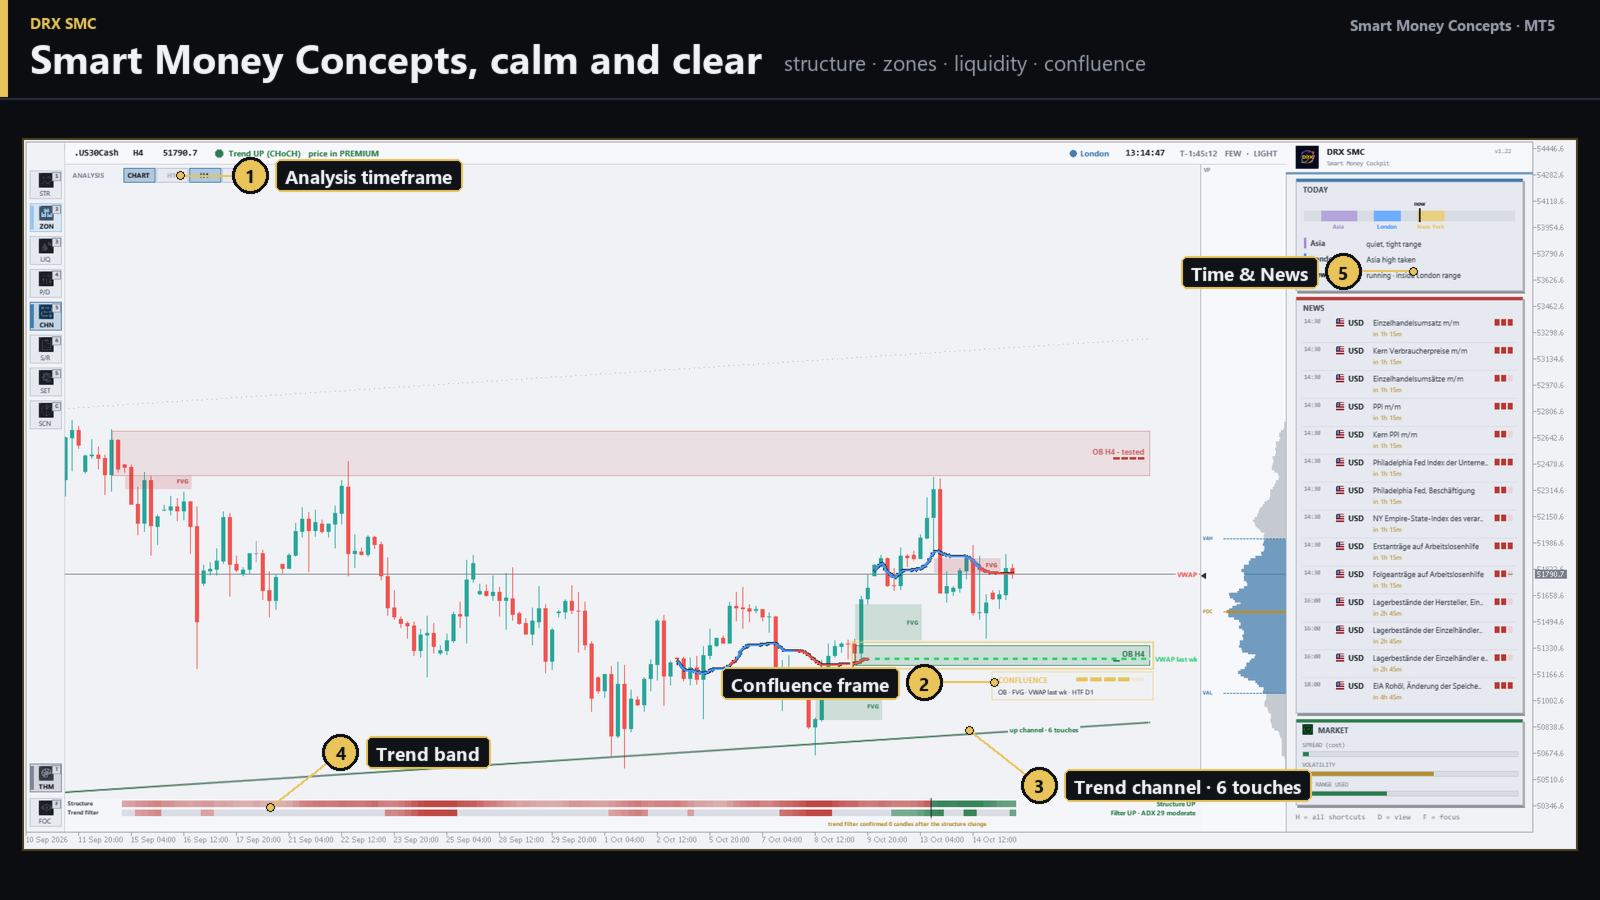
Master Smart Money Concepts (SMC) and ICT strategies with total clarity on MetaTrader 5. DRX SMC automatically detects and draws high-probability market structure, institutional order blocks, fair value gaps (FVG), liquidity sweeps, trend channels, multi-timeframe support and resistance, premium/discount Fibonacci zones, and the volume-weighted average price (VWAP) right on your chart. When multiple technical confluence factors stack at the same level, DRX SMC highlights the zone with an exclusive gold confluence frame so you instantly spot institutional trading setups.
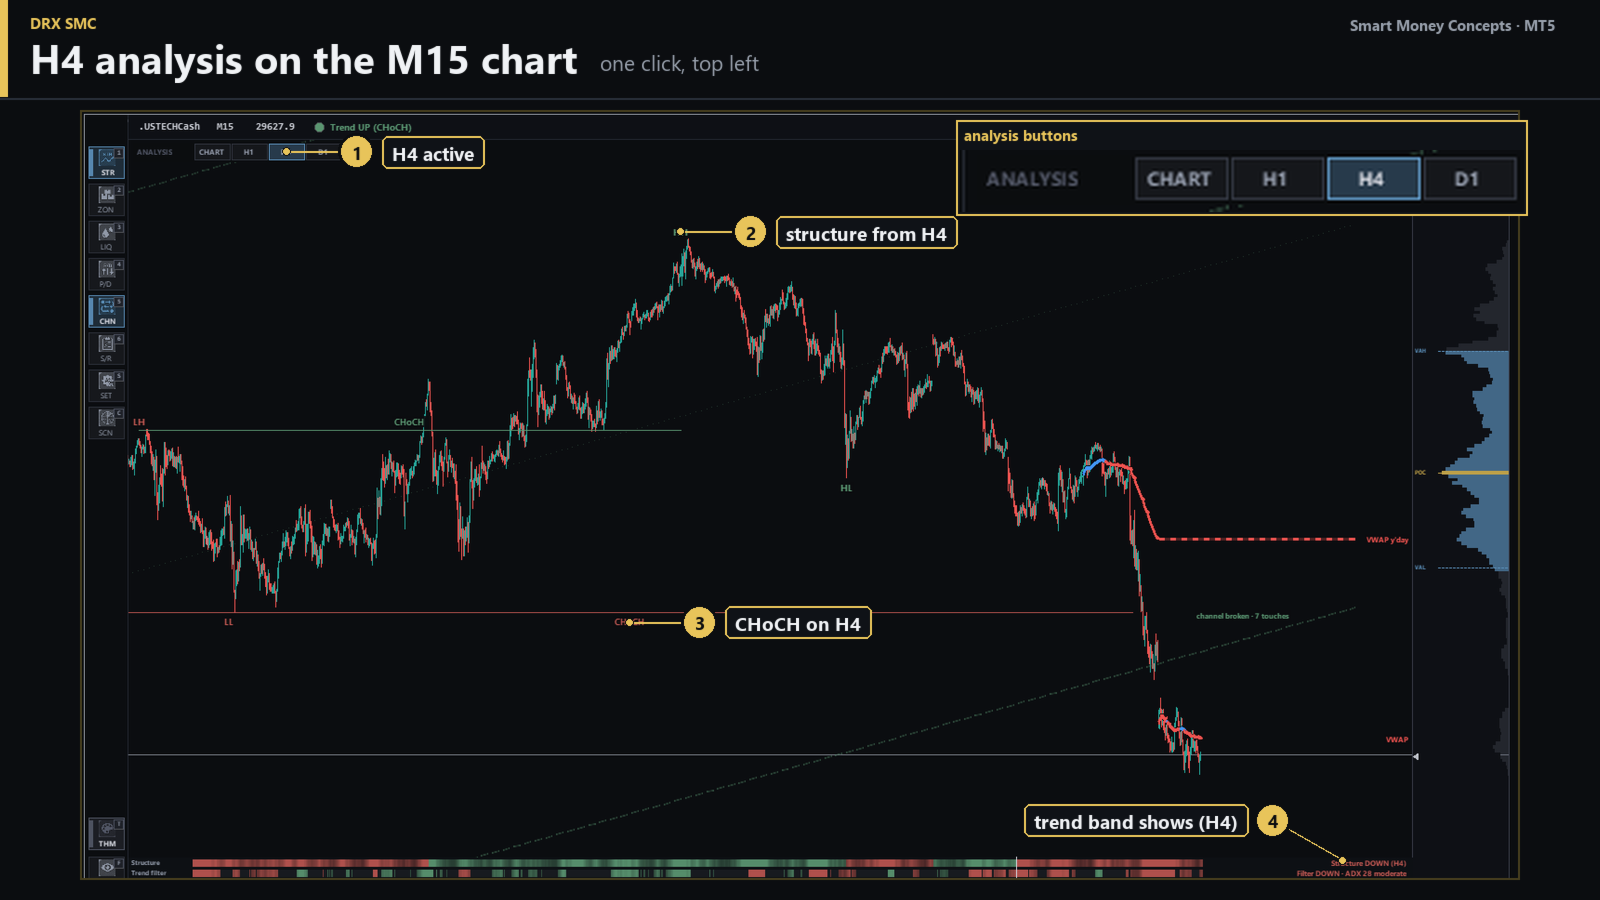
Most SMC and ICT MT5 indicators clutter your chart with messy overlapping boxes. DRX SMC delivers a clean, professional charting experience by filtering low-quality noise and displaying only high-confluence facts without overlap. Switch seamlessly between visibility modes – FEW, NORMAL, or MANY – or toggle individual elements with a single click. Conduct multi-timeframe analysis effortlessly by displaying H1, H4, or D1 SMC structures on lower timeframe charts (M1, M5, M15) without switching tabs.
Complete DRX SMC User Manual & Setup Guide: Read the step-by-step documentation here
DRX SMC is designed as an advanced market analysis and ICT learning tool for price action traders. It does not provide automated buy/sell signals or unrealistic profit promises. Instead, it provides clean, objective market structure insights so you can execute your trading strategy with confidence and discipline.
What's New in DRX SMC Version 1.22
- Multi-Timeframe (MTF) Analysis Buttons: Switch between CHART, H1, H4, and D1 structure, order blocks, and trend channels instantly on lower timeframe charts.
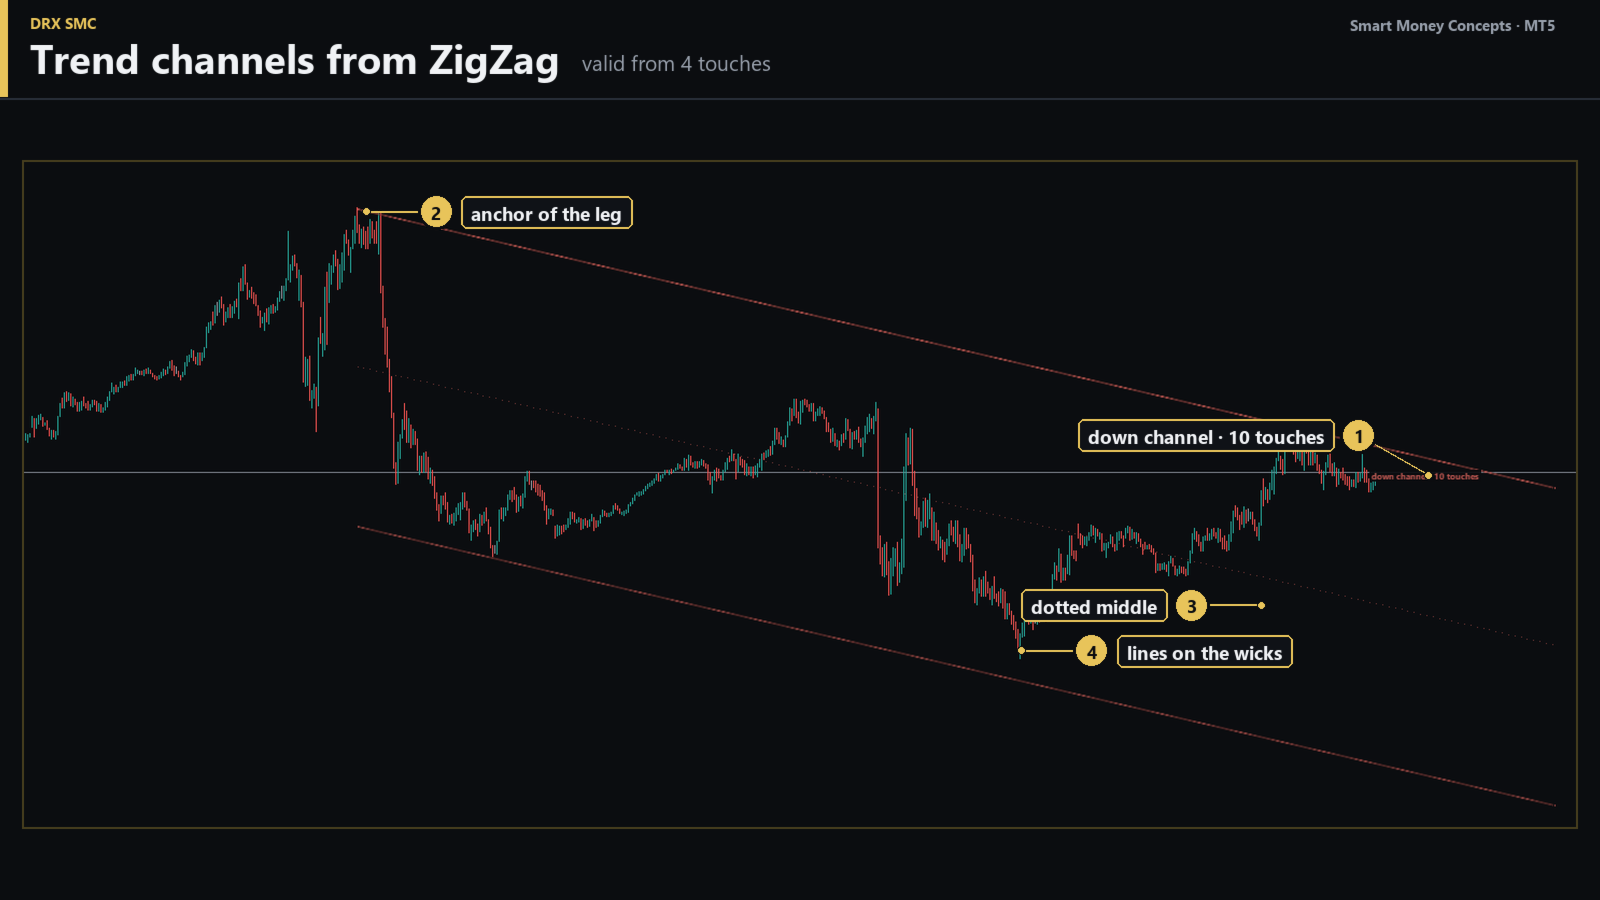
- Precision Trend Channels: Advanced ZigZag channel engine requiring a minimum of 4 touchpoints for valid channels, featuring automatic dashed formatting for broken trendlines.
- MTF Support & Resistance (H1 / H4 / D1): Adaptive pivot levels showing touch count, role reversal (support/resistance flips), and gold highlighting for multi-timeframe level alignment.
- Structure vs. Classic Trend Filter Band: Real-time visual comparison between early market structure shifts (BOS/CHoCH) and traditional trend indicators (EMA, ADX, H1 alignment).
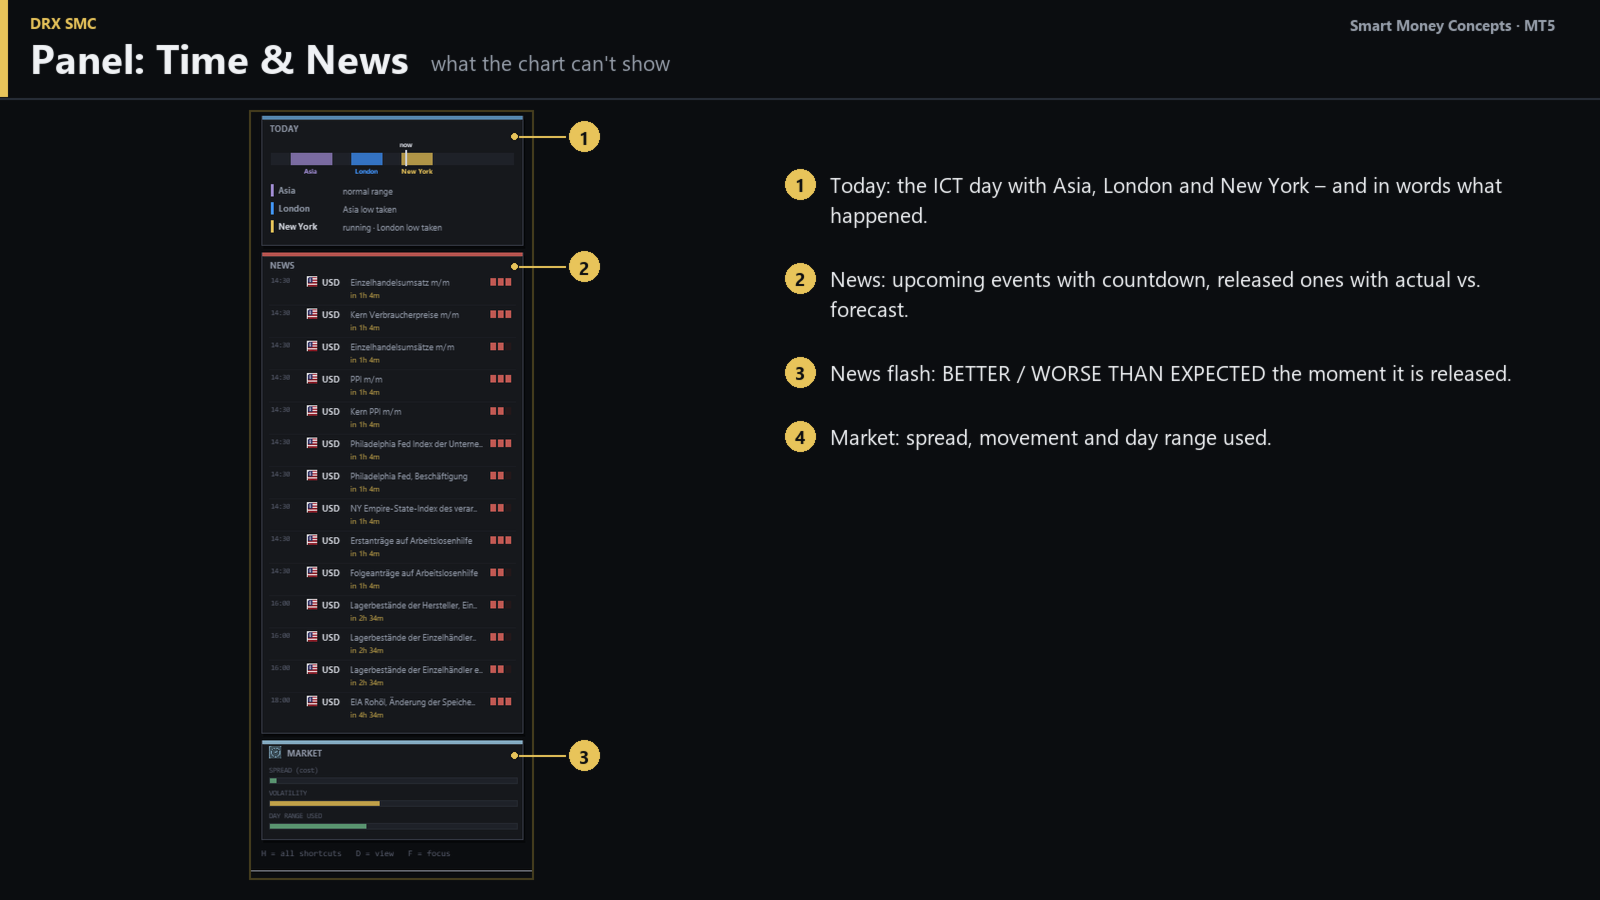
- Economic News Flash & Calendar: Live economic releases showing Actual vs. Forecast data ("Better / Worse Than Expected") directly on your chart with alert options.
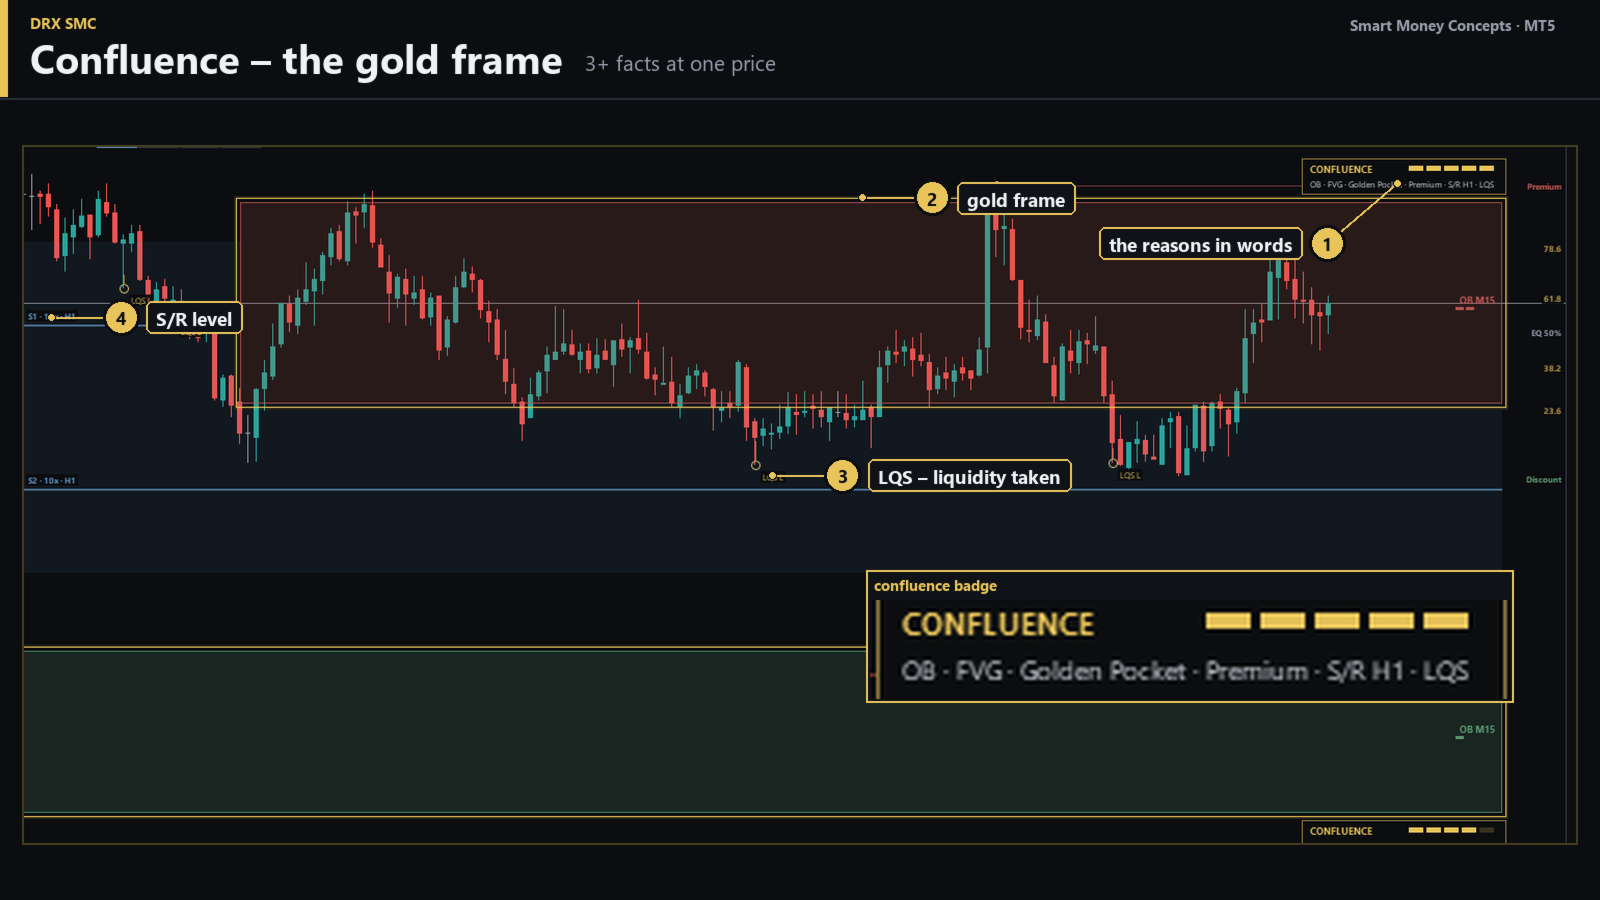
- Gold Confluence Detection Engine: Dynamic identification of high-probability setups combining 3+ ICT and SMC factors with plain-language explanations.
- Extended ICT Building Blocks: Integrated breaker blocks, inverse fair value gaps (IFVG), balanced price ranges (BPR), supply and demand zones, and consolidated FVG zones.
- Institutional Price Tools: Auto-anchored Premium/Discount Fibonacci with Optimal Trade Entry (OTE) golden pocket, daily VWAP with trend color coding, and Yesterday's VWAP levels.
- ICT Time & Session Panel: Automated session boxes (Asia, London, New York Killzones), true day open (NY Midnight Open), NDOG, NWOG, and Asia Range levels.
- High Performance & Low Latency: Zero overlapping objects, smooth canvas overlay rendering, and calculation updates on candle close for maximum MT5 speed.
Core Features for Smart Money Concepts & ICT Traders
1. Market Structure Analysis: BOS, CHoCH, HH, HL, LH, LL
Market structure is the backbone of any Smart Money Concepts trading strategy. DRX SMC scans price action automatically to mark swing points as Higher Highs (HH), Higher Lows (HL), Lower Highs (LH), and Lower Lows (LL). It highlights trend continuation via Break of Structure (BOS) and early market reversals via Change of Character (CHoCH). Minor internal structure (mBOS, mCHoCH) can be toggled on demand. All structure confirmations rely strictly on closed candles to eliminate repainting errors.
2. Multi-Timeframe (MTF) Overlay Strategy
Analyze higher timeframe trends without changing your chart tab. When day trading on M5 or M15, simply select H4 or D1 at the top-left panel. The indicator projects higher timeframe order blocks, fair value gaps, liquidity pools, Fibonacci levels, and market structure directly onto your current execution timeframe with clear timeframe tags (e.g., "OB H4").
3. Institutional Order Blocks, Breaker Blocks & Supply/Demand
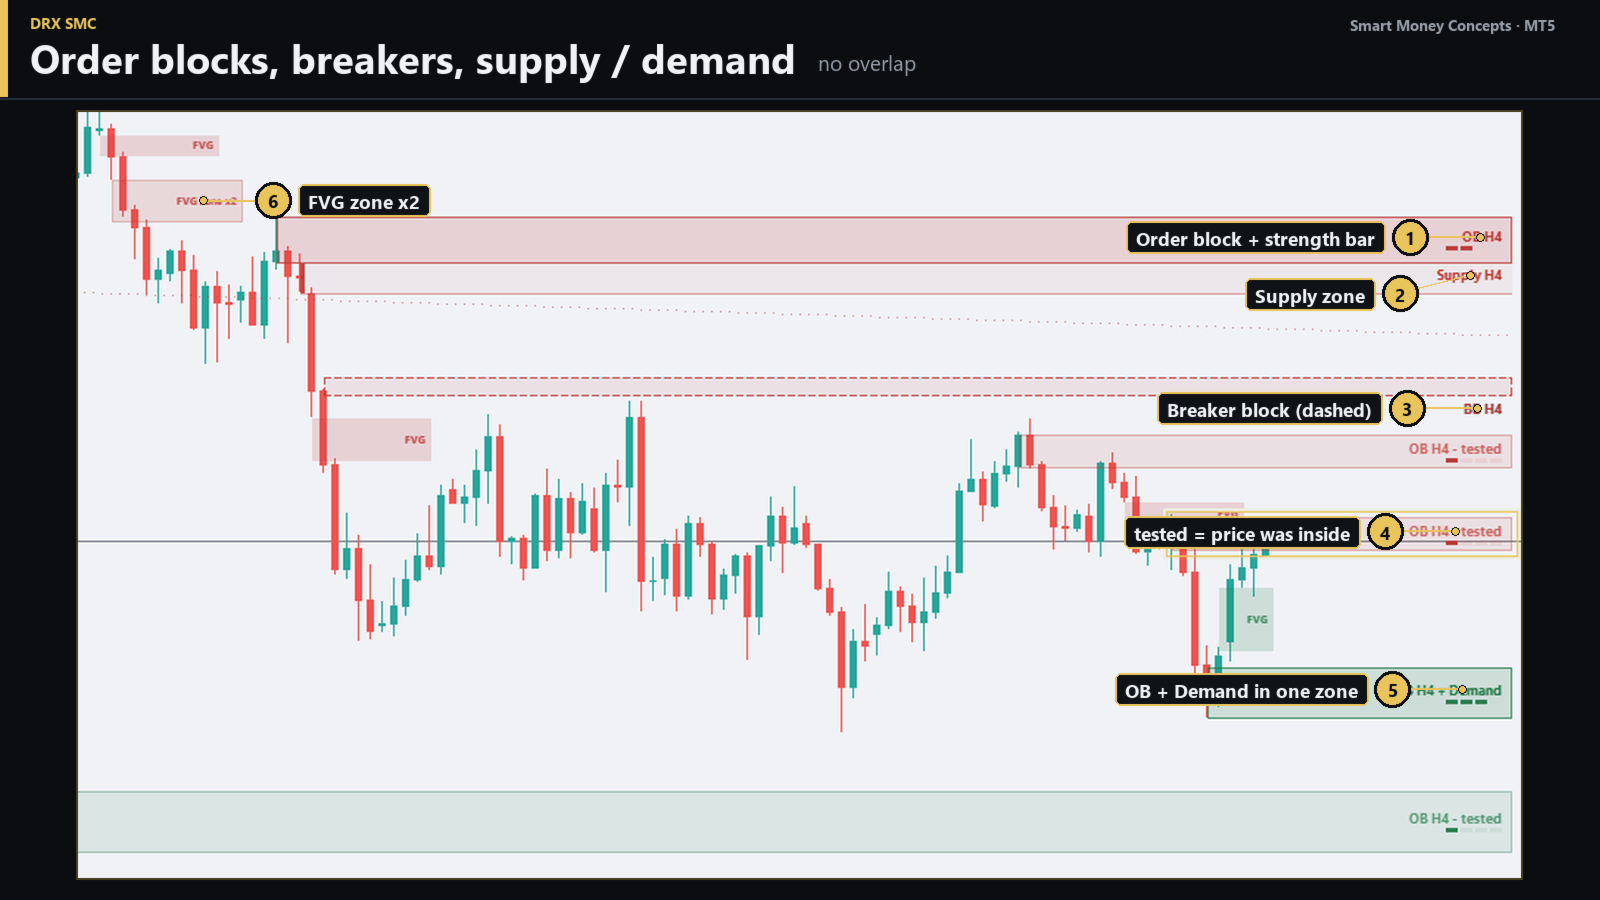
- Smart Money Order Blocks (OB): Identifies the origin candles where institutional traders accumulated positions. Each order block features a 4-quarter volume strength bar comparing volume to historical averages. Tested zones display clear mitigation labels.
- Breaker Blocks (BB): Automatically converts failed order blocks into breaker zones, identifying prospective retest areas.
- Supply & Demand Consolidation: Detects tight base consolidations preceding explosive impulse moves. Merges seamlessly with overlapping order blocks ("OB + Demand") to prevent chart clutter.
4. Fair Value Gaps (FVG), Inverse FVG (IFVG) & Balanced Price Ranges (BPR)
Price imbalances represent prime target areas for smart money rebalancing. DRX SMC highlights active Fair Value Gaps (FVG) with clean visual boxes. Consecutive imbalances inside a single price impulse are grouped into smart FVG Zones ("FVG Zone x4"). Violated FVGs transition into Inverse Fair Value Gaps (IFVG), while overlapping bullish and bearish gaps are marked as Balanced Price Ranges (BPR).
5. Automated Trend Channels via ATR-ZigZag Engine
Eliminate subjective trendline drawing. DRX SMC employs a mathematical ZigZag engine (filtering market noise via 1.5x ATR pullbacks) to build objective trend channels along valid swing points. Channels are displayed only after reaching at least 4 confirmed touchpoints. Broken channels switch to dashed lines with explicit alert notifications.
6. Multi-Timeframe Support & Resistance Levels
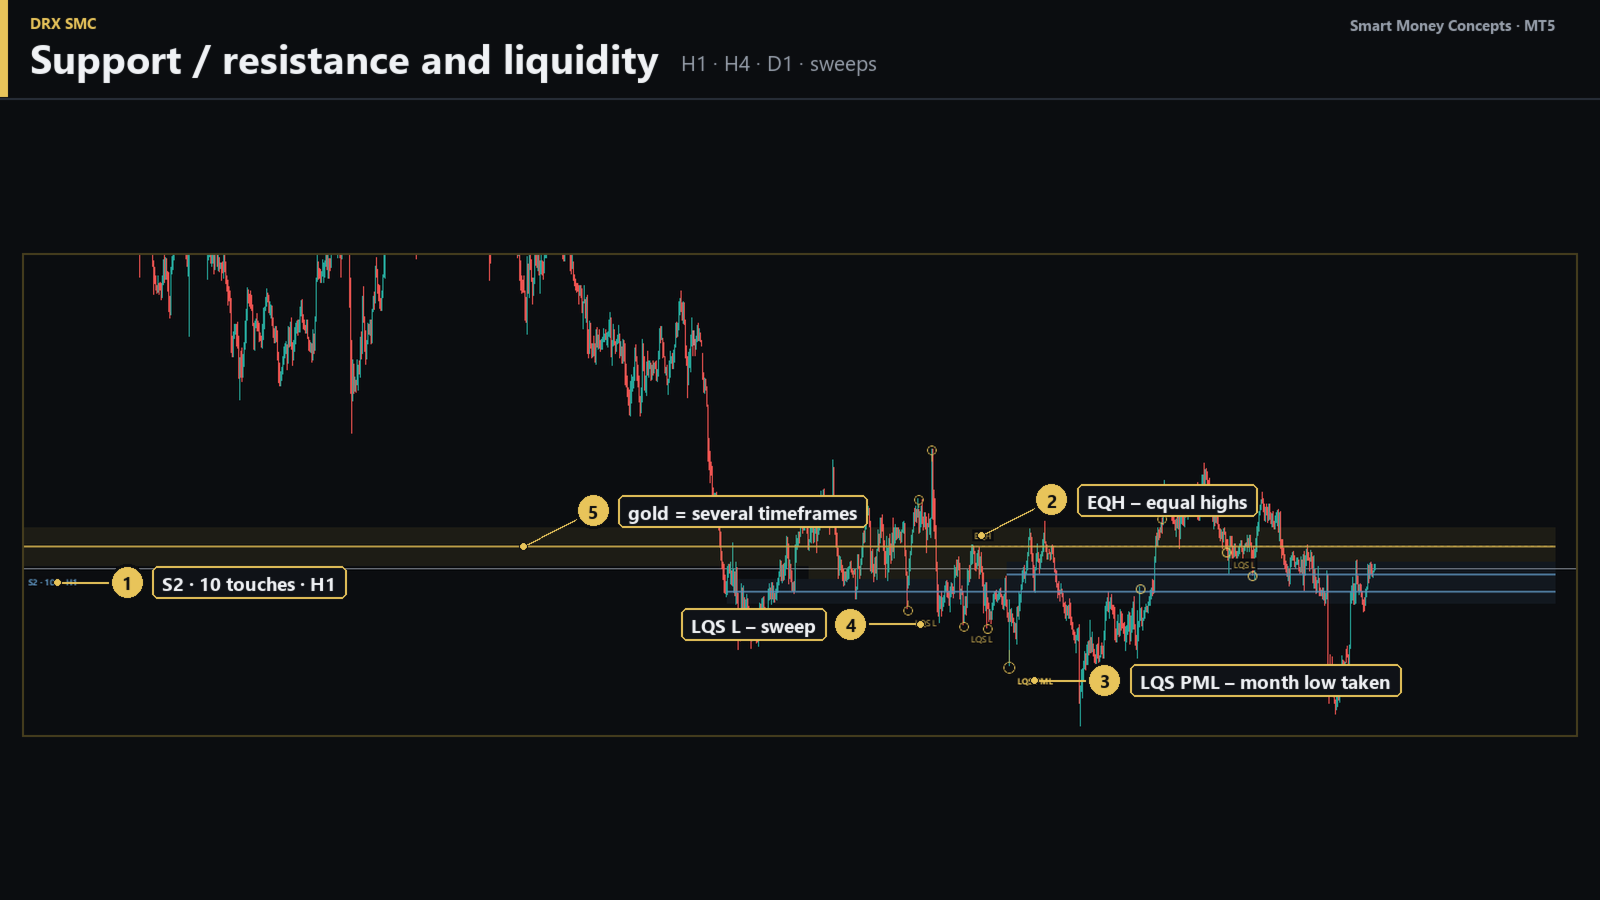
Dynamic pivot levels calculated across H1, H4, and D1 timeframes with ATR-adaptive padding. Each key level displays touch metrics and active timeframes on the left margin (e.g., "R1 · 4x · H4 D1"). Key level role reversals (Flip levels) switch to dashed formatting, while aligning levels across multiple timeframes are highlighted in gold.
7. Liquidity Analysis: Liquidity Sweeps, EQH/EQL, PDH/PDL
- Liquidity Sweep Engine (LQS): Highlights stop runs across critical liquidity pools, including Previous Day High/Low ("LQS PDH"), Equal Lows/Highs ("LQS EQL"), or key swing points.
- Equal Highs & Equal Lows (EQH/EQL): Marks buy-side and sell-side liquidity clusters where retail stop-loss orders accumulate.
- Higher Timeframe Key Levels: Displays Previous Day High/Low (PDH/PDL), Previous Week High/Low (PWH/PWL), and Previous Month High/Low (PMH/PML) along the right chart margin.
8. Premium vs. Discount, Fibonacci & ICT Golden Pocket (OTE)
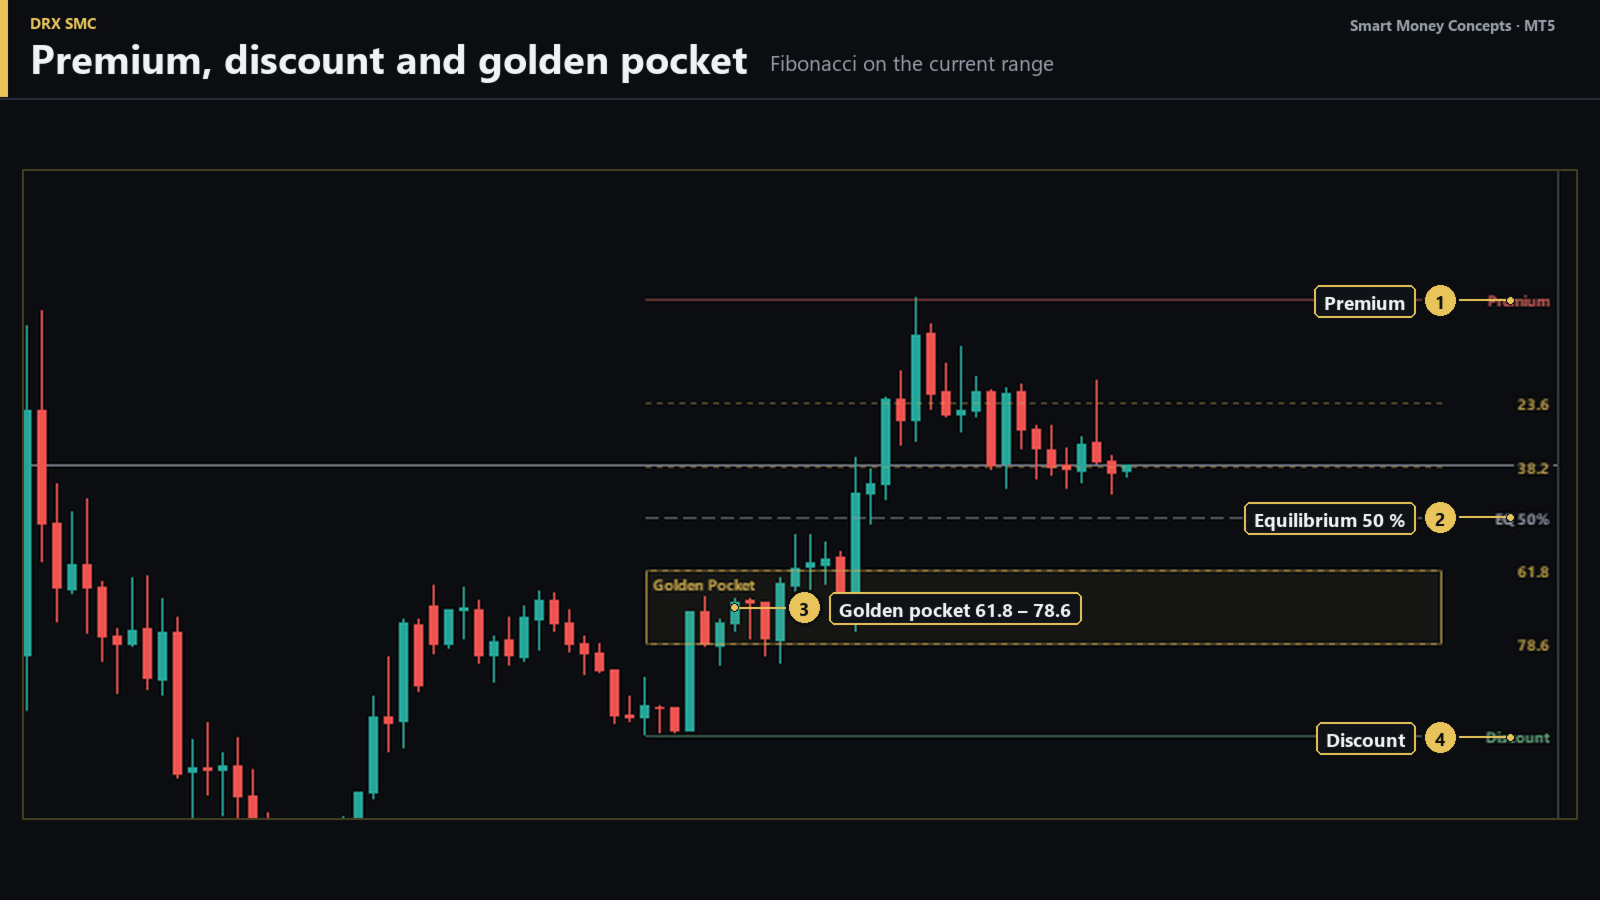
DRX SMC automatically calculates the current dealing range and maps institutional pricing zones: Premium Zone (overpriced/selling area), Equilibrium (EQ 50%), and Discount Zone (underpriced/buying area). The ICT Optimal Trade Entry (OTE) / Golden Pocket zone between the 61.8% and 78.6% Fibonacci retracement levels is rendered as a distinct high-confluence box.
9. VWAP (Volume-Weighted Average Price) & Prior Day VWAP
Track institutional benchmark pricing with a dynamic, color-coded VWAP line (Blue = Bullish / Red = Bearish). Yesterday's closing VWAP projects continuously through today's session, establishing critical dynamic support (Green when below price) or resistance (Red when above price).
10. Trend Band: Market Structure vs. Classic Trend Filters
Located at the base of your chart, the dual-row Trend Band compares early market structure shifts against traditional trend indicators (EMA 20/50, ADX 20+, H1 EMA 50). A built-in confluence counter tells you exactly how many candles traditional trend filters lag behind actual structure shifts.
11. Volume Profile (Visible Range) with POC, VAH, VAL
Inspect volume distribution across the visible chart area with an integrated Volume Profile histogram. Instantly identify the Point of Control (POC), Value Area High (VAH), and Value Area Low (VAL) with optional delta volume splitting (buying vs. selling pressure).
12. ICT Sessions, Killzones & Opening Reference Levels
- ICT Killzones & Sessions: Renders Asia, London, and New York trading sessions as visual time boxes in New York local time, complete with automatic broker GMT offset detection and daylight saving adjustments.
- Opening Price Levels: Marks Daily Open and NY Midnight Open (True Day Open) for precise ICT power of 3 (AMD) setups.
- Opening Gaps (NDOG / NWOG): Tracks New Day Opening Gaps and New Week Opening Gaps along with their 50% midpoint levels.
- Asia Range Manipulation: Clearly displays Asia High and Low levels to identify London/NY session liquidity sweeps.
13. The Gold Confluence Frame Engine
DRX SMC continuously evaluates every zone on your chart across multiple technical parameters: Fair Value Gaps, Golden Pocket OTE, Premium/Discount status, VWAP alignment, Prior Day VWAP, POC levels, Support/Resistance pivots, Higher Timeframe zones, and recent Liquidity Sweeps. When 3 or more confluence factors align at a single price zone, the indicator highlights the area with a prominent gold confluence frame detailing the exact trade rationale (e.g., "OB · FVG · Golden Pocket · VWAP y'day · Discount").
14. "Time & News" Panel & Real-Time News Flash Alerts
- Session Progress & Narrative: Real-time ICT trading session timeline with status updates (e.g., "London took the Asia high").
- Economic Calendar: Live countdowns and event listings for currencies relevant to your active chart symbol.
- Breaking News Flash: Instant visual pop-up windows comparing Actual vs. Forecast economic data (CPI, NFP, FOMC, PPI) with multi-channel alerts (Pop-up, Mobile Push, Email, Sound).
Supported Markets and Timeframes
DRX SMC is compatible with all financial instruments and timeframes on MetaTrader 5:
- Precious Metals: Gold (XAUUSD), Silver (XAGUSD).
- Forex Majors & Minors: EURUSD, GBPUSD, USDJPY, AUDUSD, USDCAD, EURGBP, etc.
- Stock Market Indices: NASDAQ 100 (US100 / USTEC), S&P 500 (US500), Dow Jones (US30), DAX 40 (GER40), FTSE 100.
- Cryptocurrencies: Bitcoin (BTCUSD), Ethereum (ETHUSD), Solana, and major crypto CFDs.
- Individual Equities & Commodities: Stock CFDs, Crude Oil (WTI/Brent), Natural Gas.
- Timeframes: M1 and M5 for scalping; M15 and H1 for day trading; H4 and D1 for swing trading.
How to Get Started in 3 Simple Steps
- Step 1: Drag and drop DRX SMC onto any MetaTrader 5 chart.
- Step 2: Press hotkey D to toggle detail density between FEW, NORMAL, and MANY, then choose your preferred Higher Timeframe analysis mode at the top-left menu.
- Step 3: Customize your view using the left rail control buttons (STR, ZON, LIQ, P/D, CHN, S/R) or press SET for detailed configuration. Press hotkey H to view all available keyboard shortcuts.
Tip: Download the free demo version in the MetaTrader 5 Strategy Tester to test all features in real-time visual mode.
Frequently Asked Questions (FAQ)
- What are Smart Money Concepts (SMC) and ICT Trading? Smart Money Concepts and ICT (Inner Circle Trader) strategies focus on tracking institutional market dynamics by analyzing liquidity sweeps, order flow, fair value gaps, market structure breaks, and session timing rather than traditional lagging indicators.
- What is an Institutional Order Block? An order block represents the last opposite-color candle prior to a strong impulse move, indicating where institutional market participants built large position blocks.
- What is a Fair Value Gap (FVG)? A fair value gap is a three-candle price imbalance created during aggressive market expansion, leaving an inefficiently filled price area that market makers frequently rebalance.
- What is the difference between BOS and CHoCH? A Break of Structure (BOS) signals trend continuation in the direction of the macro trend, whereas a Change of Character (CHoCH) signals a potential market structure reversal.
- Does the DRX SMC indicator repaint? No. Market structure, breaks, and channels are calculated strictly using confirmed swing points and closed candles. Mitigated order blocks or filled fair value gaps disappear automatically to maintain a clean chart.
- Can I display higher timeframe SMC analysis on lower timeframe charts? Yes. Selecting H1, H4, or D1 from the top-left MTF menu automatically projects higher timeframe structures and zones directly onto lower timeframes (e.g., M1, M5, M15).
- Does DRX SMC generate automated buy and sell signals? No. DRX SMC is an analytical market reading tool designed for discretionary manual trading. It does not provide automatic entry signals, target prices, or stop-loss placement.
- Is DRX SMC suitable for Prop Firm Challenges (FTMO, Funded Next, etc.)? Yes. DRX SMC is a pure chart analysis indicator that does not execute automated trades, making it 100% compliant with all prop firm trading rules.
- Does DRX SMC require an additional Expert Advisor (EA)? No. DRX SMC functions as a standalone MT5 indicator.
- Is DRX SMC compatible with other DRX tools? Yes. DRX SMC features built-in multi-tool layout management and adjusts its position automatically when run alongside DRX Cockpit or DRX DrawPad on the same chart.
DRX SMC – The Ultimate Smart Money Concepts Indicator for MT5. Bring institutional market structure, order blocks, fair value gaps, breaker blocks, liquidity sweeps, trend channels, support/resistance, VWAP, volume profile, ICT killzones, multi-timeframe analysis, and gold confluence detection into one powerful, high-speed indicator for MetaTrader 5.