Volume Profile V6
- Indicators
- Version: 2.18
- Updated: 5 May 2026
- Activations: 9

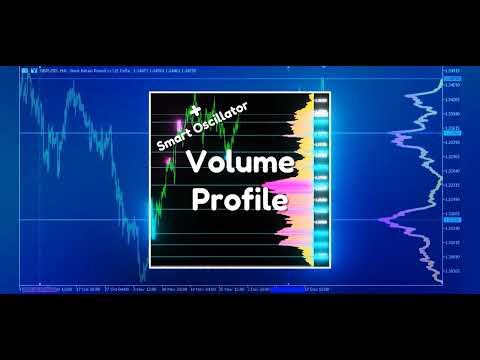
Market Volume Profile indicator + Smart Oscillator. Works on almost all instruments — currency pairs, stocks, futures, cryptocurrencies — using both real and tick volumes. You can set the profile range either automatically (for example, a week, a month, etc.) or manually by moving the boundaries (two vertical lines: red and blue). The profile is displayed as a histogram. The width of the histogram at a given level represents, conditionally, the number of trades executed at that level. The "Mode level line color" parameter allows automatic display of the most significant volume levels, from which the price is highly likely to react, while the "Maximum color (POC)" parameter separately highlights the level with the highest traded volume within the selected range.
The Smart Oscillator shows overbought and oversold zones. It analyzes data coming from several indicators and, based on processed information, highlights overbought and oversold areas with corresponding colors.
In the Volume every day section, the Range period parameter defines the time range for building the profile, while the Range count parameter defines the number of such ranges. For example, Range period = 1 Day and Range count = 10 means that the profile will be built for one-day periods over the last ten days. It is important that changing the chart timeframe does not affect the profile calculation, which is an additional advantage of this indicator.
The indicator is very simple and convenient to use, while remaining highly informative. With this indicator, the market maker will not be able to hide their buying or selling activity from you. Thousands of users have already downloaded this product and there has not been a single negative review.
Examples of settings for some instruments can be found in the discussions section, message №14.
Other useful free and paid products can be found here: https://www.mql5.com/ru/users/raprofit/seller
PARAMETERS:
Use Smart Oscillator — enable/disable the indicator.
Smart Oscillator Alerts — block for enabling and disabling Smart Oscillator signal notifications. Notifications are generated only for confirmed Smart Oscillator signals:
— START signal (beginning of the zone) is sent after the bar closes where the oscillator line is already formed and will not repaint
— END signal (end of the zone) is sent after the first bar closes where the line has disappeared
SmartAlertPopup — enable/disable popup notifications in the terminal.
SmartAlertPush — enable/disable push notifications to a mobile device (requires prior configuration of MetaQuotes ID in the terminal).
SmartAlertEmail — enable/disable email notifications (requires prior email setup in the terminal).
Use Volume Range — enable/disable the indicator.
Range mode — method of defining the range boundaries:
- Between lines - between two lines
- Last minutes - last RangeMinutes minutes
- Minitues to line - RangeMinutes to the right line
Range minutes — number of minutes for RangeMode 1 and 2.
Mode step (points) — minimum distance between modes, selected individually for each instrument.
Point scale — point scaling for histogram drawing. A higher value increases performance but reduces precision.
Volume type — type of volume: tick or real. Real volume may not be available from the broker, in which case the indicator will display nothing.
Data source — data source:
- Ticks (MT5 only) - ticks from your broker’s server (if available)
- M1, M5, M15 - interpolated ticks based on bars of the selected timeframe
Bar style — histogram bar style:
- Lines - lines
- Empty bar - empty rectangles
- Filled bar - filled rectangles
- Outline - outline
- Color - color
Histogram position — histogram placement:
- Window left - left side of the window
- Window right - right side of the window
- Left outside - from the left boundary outward
- Right outside - from the right boundary outward
- Left inside - from the left boundary inward
- Right inside - from the right boundary inward
Color 1 — histogram color 1. Set None to use the chart background color.
Color 2 — histogram color 2. Set None to use the chart background color.
Line width — histogram line thickness.
Mode color (None=disable) — color of local volume peaks (modes). Set None to disable.
Maximum color (POC) (None=disable) — color of the maximum volume level. Set None to disable.
VWAP color (None=disable) — color of VWAP (volume-weighted average price). Set None to disable.
Mode level line color — color of levels drawn at modes. Set None to disable.
Mode level line style — style of mode level lines.
Identifier — indicator identifier. Use different values when running multiple instances on the same chart.
Use Volume every day — enable/disable the indicator.
Range period — period, standard values from M1 to MN1 (1, 5, 15, 30, 60, 240, 1440, 10080, 43200). MT5 also supports custom timeframes.
Range count — number of ranges.
Mode step (points) — minimum distance between modes, selected individually for each instrument.
Point scale — point scaling for histogram drawing. A higher value increases performance but reduces precision.
Volume type — type of volume: tick or real. Real volume may not be available from the broker, in which case the indicator will display nothing.
Data source — data source:
- Ticks (MT5 only) - ticks from your broker’s server (if available)
- M1, M5, M15 - interpolated ticks based on bars of the selected timeframe
Bar style — histogram bar style:
- Lines - lines
- Empty bar - empty rectangles
- Filled bar - filled rectangles
- Outline - outline
- Color - color
Draw direction — histogram drawing direction: left to right or right to left.
Color 1 — histogram color 1. Set None to use the chart background color.
Color 2 — histogram color 2. Set None to use the chart background color.
Line width — histogram line thickness.
Mode color (None=disable) — color of local volume peaks (modes). Set None to disable.
Maximum color (None=disable) — color of the maximum volume level. Set None to disable.
VWAP color (None=disable) — color of VWAP (volume-weighted average price). Set None to disable.
Mode line width — thickness of mode lines.
Identifier — indicator identifier. Use different values when running multiple instances on the same chart.


very supportive seller and excellent value add for my trading! thx a lot